INTRODUCTION
OVERVIEW
BODY 1-2
Explain Inyour own words what the chart(s)/graph(s)/diagram(s) is showing
• Only 1 sentence
• Paraphrase the question
Tell what the main features are
Explain these features in detail
3.
INTRODUCTION
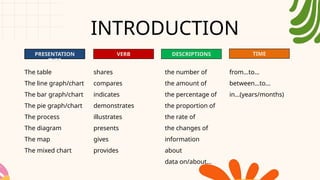
PRESENTATION
TYPE
VERB DESCRIPTIONS TIME
Thetable
The line graph/chart
The bar graph/chart
The pie graph/chart
The process
The diagram
The map
The mixed chart
shares
compares
indicates
demonstrates
illustrates
presents
gives
provides
the number of
the amount of
the percentage of
the proportion of
the rate of
the changes of
information
about
data on/about…
from...to…
between…to…
in…(years/months)
4.
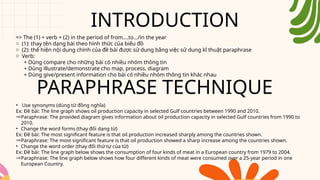
INTRODUCTION
=> The (1)+ verb + (2) in the period of from….to…/in the year
o (1): thay tên dạng bài theo hình thức của biểu đồ
o (2): thể hiện nội dung chính của đề bài được sử dung bằng việc sử dung kĩ thuật paraphrase
o Verb:
+ Dùng compare cho những bài có nhiều nhóm thông tin
+ Dùng illustrate/demonstrate cho map, process, diagram
+ Dùng give/present information cho bài có nhiều nhóm thông tin khác nhau
PARAPHRASE TECHNIQUE
• Use synonyms (dùng từ đồng nghĩa)
Ex: Đề bài: The line graph shows oil production capacity in selected Gulf countries between 1990 and 2010.
ÞParaphrase: The provided diagram gives information about oil production capacity in selected Gulf countries from 1990 to
2010.
• Change the word forms (thay đổi dạng từ)
Ex: Đề bài: The most significant feature is that oil production increased sharply among the countries shown.
ÞParaphrase: The most significant feature is that oil production showed a sharp increase among the countries shown.
• Change the word order (thay đổi thứ tự của từ)
Ex: Đề bài: The line graph below shows the consumption of four kinds of meat in a European country from 1979 to 2004.
ÞParaphrase: The line graph below shows how four different kinds of meat were consumed over a 25-year period in one
European Country.
5.
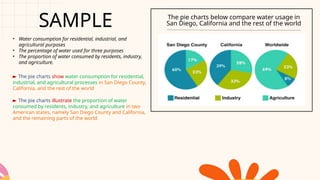
SAMPLE The piecharts below compare water usage in
San Diego, California and the rest of the world
• Water consumption for residential, industrial, and
agricultural purposes
• The percentage of water used for three purposes
• The proportion of water consumed by residents, industry,
and agriculture.
► The pie charts show water consumption for residential,
industrial, and agricultural processes in San Diego County,
California, and the rest of the world
► The pie charts illustrate the proportion of water
consumed by residents, industry, and agriculture in two
American states, namely San Diego County and California,
and the remaining parts of the world
6.
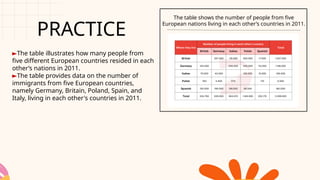
PRACTICE
The table showsthe number of people from five
European nations living in each other’s countries in 2011.
►The table illustrates how many people from
five different European countries resided in each
other’s nations in 2011.
►The table provides data on the number of
immigrants from five European countries,
namely Germany, Britain, Poland, Spain, and
Italy, living in each other's countries in 2011.
7.
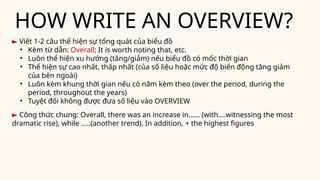
HOW WRITE ANOVERVIEW?
► Viết 1-2 câu thể hiện sự tổng quát của biểu đồ
• Kèm từ dẫn: Overall; It is worth noting that, etc.
• Luôn thể hiện xu hướng (tăng/giảm) nếu biểu đồ có mốc thời gian
• Thể hiện sự cao nhất, thấp nhất (của số liệu hoặc mức độ biến động tăng giảm
của bên ngoài)
• Luôn kèm khung thời gian nếu có năm kèm theo (over the period, during the
period, throughout the years)
• Tuyệt đối không được đưa số liệu vào OVERVIEW
► Công thức chung: Overall, there was an increase in…… (with….witnessing the most
dramatic rise), while …..(another trend). In addition, + the highest figures
8.
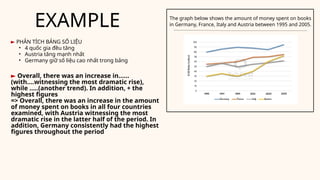
EXAMPLE The graphbelow shows the amount of money spent on books
in Germany, France, Italy and Austria between 1995 and 2005.
► PHÂN TÍCH BẢNG SỐ LIỆU
• 4 quốc gia đều tăng
• Austria tăng mạnh nhất
• Germany giữ số liệu cao nhất trong bảng
► Overall, there was an increase in……
(with….witnessing the most dramatic rise),
while …..(another trend). In addition, + the
highest figures
=> Overall, there was an increase in the amount
of money spent on books in all four countries
examined, with Austria witnessing the most
dramatic rise in the latter half of the period. In
addition, Germany consistently had the highest
figures throughout the period
9.
HOW WRITE ANOVERVIEW?
► Viết 1-2 câu thể hiện sự tổng quát của biểu đồ
• Kèm từ dẫn: Overall; It is worth noting that, etc.
• Luôn thể hiện xu hướng (tăng/giảm) nếu biểu đồ có mốc thời gian
• Thể hiện sự cao nhất, thấp nhất (của số liệu hoặc mức độ biến động tăng giảm của bên ngoài)
• Luôn kèm khung thời gian nếu có năm kèm theo (over the period, during the period,
throughout the years)
• Tuyệt đối không được đưa số liệu vào OVERVIEW
► Công thức chung: Overall, there was an increase in…… (with….witnessing the most dramatic rise),
while …..(another trend). In addition, + the highest figures
► Một số công thức khác:
• Dạng Overtime (gồm 2 năm trở lên), thường viết 1 câu về đặc điểm/xu hướng chung và 1 câu
về số liệu nổi bật nhất
Example: Overall, there was (mostly) an upward/a downward trend found in (1), and it is also
worthing noting that (2) had the most/ least + adj + NP (3) over the period.
• (1): Main information
• (2): In + số liệu nổi bật nhất
• (3): (optional) nhóm thông tin nổi bật về mặt gì (amount, numbers, growth, growth rate, etc)
10.
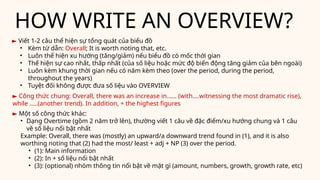
HOW WRITE ANOVERVIEW?
► Một số công thức khác:
• Dạng Static (không có năm nào hoặc chỉ có 1 năm), thường gồm 2 câu về số liệu
nổi bật nhất
Example: Overall, (1) had the most/ least + adj + NP, [regarding (2) while (3) saw the
most/ least + adj + NP [in (4)] over the period.
• (1), (3): thông tin có số lieu nổi bật nhất
• (2), (4): [optional] nói về amount, their numbers, the growth, the growth rate,
etc.
► Một số công thức khác:
• Overall, there was an upward/a downward trend recorded in…., it is worth noting
that……
• Overall, A + increased/ decreased, while B saw an opposite pattern/ exhibited a
contrasting pattern/ the opposite was true for…..
11.
PRATICE
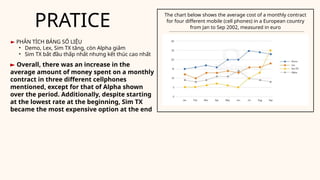
The chart belowshows the average cost of a monthly contract
for four different mobile (cell phones) in a European country
from Jan to Sep 2002, measured in euro
► PHÂN TÍCH BẢNG SỐ LIỆU
• Demo, Lex, Sim TX tăng, còn Alpha giảm
• Sim TX bắt đầu thấp nhất nhưng kết thúc cao nhất
► Overall, there was an increase in the
average amount of money spent on a monthly
contract in three different cellphones
mentioned, except for that of Alpha shown
over the period. Additionally, despite starting
at the lowest rate at the beginning, Sim TX
became the most expensive option at the end
12.
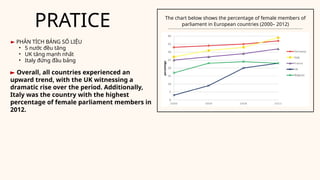
PRATICE The chartbelow shows the percentage of female members of
parliament in European countries (2000– 2012)
► PHÂN TÍCH BẢNG SỐ LIỆU
• 5 nước đều tăng
• UK tăng mạnh nhất
• Italy đứng đầu bảng
► Overall, all countries experienced an
upward trend, with the UK witnessing a
dramatic rise over the period. Additionally,
Italy was the country with the highest
percentage of female parliament members in
2012.


![HOW WRITE AN OVERVIEW?
► Một số công thức khác:
• Dạng Static (không có năm nào hoặc chỉ có 1 năm), thường gồm 2 câu về số liệu
nổi bật nhất
Example: Overall, (1) had the most/ least + adj + NP, [regarding (2) while (3) saw the
most/ least + adj + NP [in (4)] over the period.
• (1), (3): thông tin có số lieu nổi bật nhất
• (2), (4): [optional] nói về amount, their numbers, the growth, the growth rate,
etc.
► Một số công thức khác:
• Overall, there was an upward/a downward trend recorded in…., it is worth noting
that……
• Overall, A + increased/ decreased, while B saw an opposite pattern/ exhibited a
contrasting pattern/ the opposite was true for…..](https://image.slidesharecdn.com/2-250910074809-d13a05c0/85/2-How-to-write-Ielts-task-1-pptx-10-320.jpg)


![[Writing task 1] Trend - Vocabulary.pptx](https://cdn.slidesharecdn.com/ss_thumbnails/writingtask1trend-vocabulary-250818030819-064d9252-thumbnail.jpg?width=640&height=640&fit=bounds)


![3. RÚT GỌN MĐ và MĐQH (lý thuyết) - [19.12.2025] - IELTS.doc](https://cdn.slidesharecdn.com/ss_thumbnails/3-260111003400-c70a5322-thumbnail.jpg?width=640&height=640&fit=bounds)


