1. LINE CHART
Howto get high score?
- Use a wide range of uncommon words
- Diversify structures
- Diversify time expression
- Give appropriate comparison with
complex structures
- Avoid mistakes
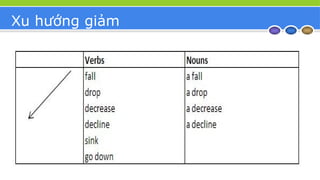
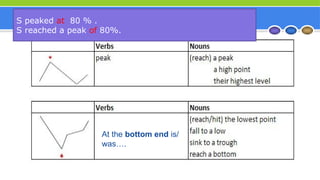
Dao động
A experience(d)an erratic behaviour.
A witness(ed) a fluctuation period / an erratic behaviour between a high of A% in
2000 and a low of B % in 2010.
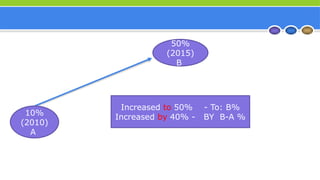
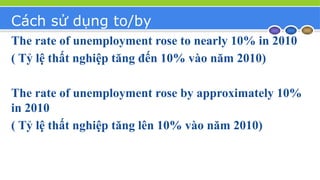
Cách sử dụngto/by
The rate of unemployment rose to nearly 10% in 2010
( Tỷ lệ thất nghiệp tăng đến 10% vào năm 2010)
The rate of unemployment rose by approximately 10%
in 2010
( Tỷ lệ thất nghiệp tăng lên 10% vào năm 2010)
23.
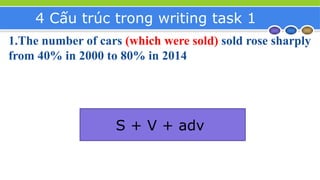
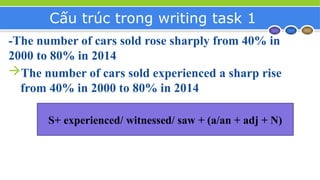
4 Cấu trúctrong writing task 1
1.The number of cars sold rose sharply from 40% in
2000 to 80% in 2014
2.There was/ is + (a/an + Adj + N) + in the…
3. The number of cars sold…. ( experienced/
witnessed/ saw)
4. The number of cars sold….
24.
4 Cấu trúctrong writing task 1
1.The number of cars (which were sold) sold rose sharply
from 40% in 2000 to 80% in 2014
S + V + adv
25.
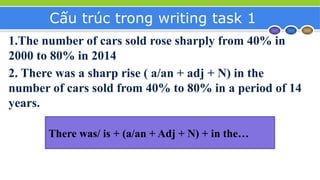
Cấu trúc trongwriting task 1
1.The number of cars sold rose sharply from 40% in
2000 to 80% in 2014
2. There was a sharp rise ( a/an + adj + N) in the
number of cars sold from 40% to 80% in a period of 14
years.
There was/ is + (a/an + Adj + N) + in the…
26.
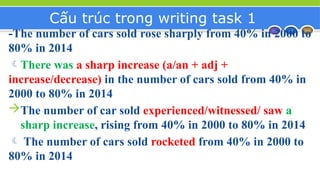
Cấu trúc trongwriting task 1
-The number of cars sold rose sharply from 40% in
2000 to 80% in 2014
The number of cars sold experienced a sharp rise
from 40% in 2000 to 80% in 2014
S+ experienced/ witnessed/ saw + (a/an + adj + N)
27.
Cấu trúc trongwriting task 1
-The number of cars sold rose sharply from 40% in
2000 to 80% in 2014
The number of cars sold soared/ rocketed from 40%
in 2000 to 80% in 2014
A + soared/rocketed +…..
S + strong V
28.
Cấu trúc trongwriting task 1
-The number of cars sold rose sharply from 40% in 2000 to
80% in 2014
There was a sharp increase (a/an + adj +
increase/decrease) in the number of cars sold from 40% in
2000 to 80% in 2014
The number of car sold experienced/witnessed/ saw a
sharp increase, rising from 40% in 2000 to 80% in 2014
The number of cars sold rocketed from 40% in 2000 to
80% in 2014
29.
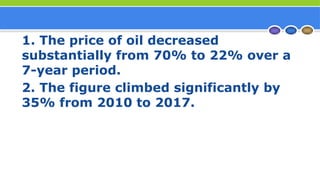
1. The priceof oil decreased
substantially from 70% to 22% over a
7-year period.
2. The figure climbed significantly by
35% from 2010 to 2017.
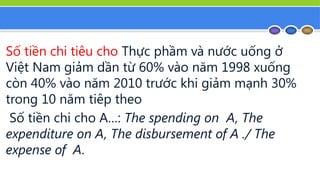
Số tiền chitiêu cho Thực phầm và nước uống ở
Việt Nam giảm dần từ 60% vào năm 1998 xuống
còn 40% vào năm 2010 trước khi giảm mạnh 30%
trong 10 năm tiêp theo
Số tiền chi cho A…: The spending on A, The
expenditure on A, The disbursement of A ./ The
expense of A.
34.
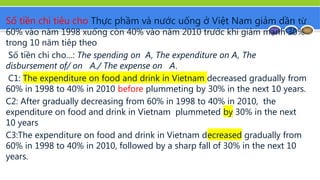
Số tiền chitiêu cho Thực phầm và nước uống ở Việt Nam giảm dần từ
60% vào năm 1998 xuống còn 40% vào năm 2010 trước khi giảm mạnh 30%
trong 10 năm tiêp theo
Số tiền chi cho…: The spending on A, The expenditure on A, The
disbursement of/ on A./ The expense on A.
C1: The expenditure on food and drink in Vietnam decreased gradually from
60% in 1998 to 40% in 2010 before plummeting by 30% in the next 10 years.
C2: After gradually decreasing from 60% in 1998 to 40% in 2010, the
expenditure on food and drink in Vietnam plummeted by 30% in the next
10 years
C3:The expenditure on food and drink in Vietnam decreased gradually from
60% in 1998 to 40% in 2010, followed by a sharp fall of 30% in the next 10
years.
35.
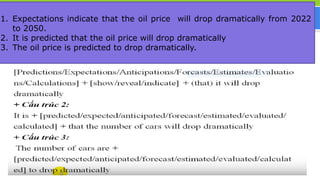
Cách nói vềtương lai
1 Có thể dự đoán rằng, giá dầu sẽ giảm mạnh
từ năm 2022 đến năm 2025
36.
Cách nói vềtương lai
1. Expectations indicate that the oil price will drop dramatically from 2022
to 2050.
2. It is predicted that the oil price will drop dramatically
3. The oil price is predicted to drop dramatically.
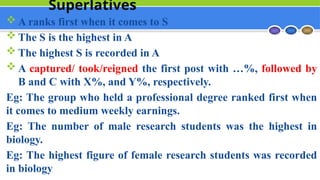
Superlatives
A ranksfirst when it comes to S
The S is the highest in A
The highest S is recorded in A
A captured/ took/reigned the first post with …%, followed by
B and C with X%, and Y%, respectively.
Eg: The group who held a professional degree ranked first when
it comes to medium weekly earnings.
Eg: The number of male research students was the highest in
biology.
Eg: The highest figure of female research students was recorded
in biology
39.
A ranks firstwhen it comes to S
Số lượng học sinh TP dẫn đầu khi nói đến/ về lĩnh vực giải
thưởng quốc gia.
The number of Tp gifted students ranks first when it comes
to Academic national prizes.
Số lượng học sinh Thái Phiên dẫn đầu khi nói về tỉ lệ đỗ cấp
3.
The number of Tphien students ranks first when it comes to
the ratio of students who passed the high school entrance
exam/ passing the high school entrance exam.
40.
The S isthe highest in A
The highest S is recorded in A
Số lượng học sinh nữ tham gia các clb nghệ thuật/ là/
cao nhất ở trường Cấp 2 Chu Văn An.
The number of female students (who take part in /
participate in art club) participating in art club is the
highest in Chu Van An Secondary school.
The highest number of female students participating
in art club was recorded in ChuVan An Secondary
school.
41.
Lead/ top thetable/ list
Số lượng hoa khôi của Trần Nguyên Hãn
đứng đầu các trường cấp 3 trên địa bàn TP
Hải Phòng.
The number of TNH hot girls tops the list
among high schools in Hai Phong city.
42.
A captured/ took/reignedthe first post with …%,
followed by B and C with…%, and….%, respectively.
Số ca nhiễm covid 19 là cao nhất ở Tp Hồ Chí Minh ,
với 16K ca, theo sau bởi Hà Nội và Hải phòng, lần lượt
là 10k và 8K ca.
The number of Covid 19 cases in Ho Chi Minh city
captured/ took/ reigned the first post with 16 thousand
cases, followed by the figure for Ha Noi and Hai Phong,
with 10 thousand and 8 thousand cases, respectively.
43.
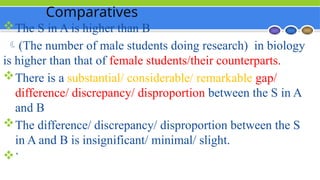
Comparatives
The S inA is higher than B
(The number of male students doing research) in biology
is higher than that of female students/their counterparts.
There is a substantial/ considerable/ remarkable gap/
difference/ discrepancy/ disproportion between the S in A
and B
The difference/ discrepancy/ disproportion between the S
in A and B is insignificant/ minimal/ slight.
`
44.
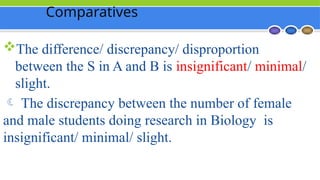
Comparatives
The difference/ discrepancy/disproportion
between the S in A and B is insignificant/ minimal/
slight.
The discrepancy between the number of female
and male students doing research in Biology is
insignificant/ minimal/ slight.
45.
Example
There was aremarkable gap between male
and female students in physics.
The statistic of male students in Vet
surpassed that of females by a narrow
margin.
46.
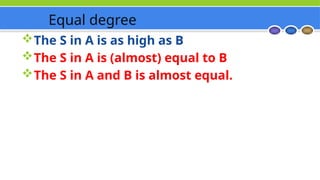
Equal degree
The Sin A is as high as B
The S in A is (almost) equal to B
The S in A and B is almost equal.
47.
Practice 1:
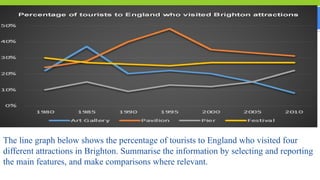
The linegraph below shows the percentage of tourists to England who visited four
different attractions in Brighton. Summarise the information by selecting and reporting
the main features, and make comparisons where relevant.
48.
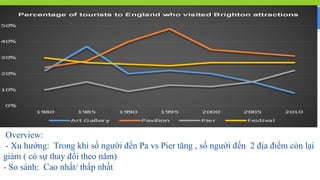
Practice 1:
Overview:
- Xuhướng: Trong khi số người đến Pa vs Pier tăng , số người đến 2 địa điểm còn lại
giảm ( có sự thay đổi theo năm)
- So sánh: Cao nhất/ thấp nhất
49.
Plan
- Paraphrase taskheading, using some different words.
- Summary paragraph
[1] the % visiting the Pier and the Pavilion increased
[2] the % visiting the other attractions fell.
- Paragraph 3: report some figures and report trends for
the Pier and the Pavilion. Include comparisons.
- Paragraph 4: report some figures and report trends for
the Festival and the Art Gallery. Include comparisons.
50.
Introduction
The line graphbelow shows the percentage of tourists to
England who visited four different attractions in
Brighton.
The graph illustrates the proportion of visitors to
England who went to four different tourist attractions in
Brighton between 1980 and 2010.
51.
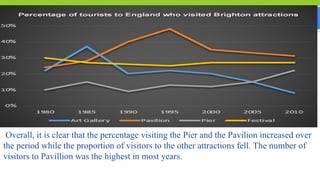
Practice 1:
Overall, itis clear that the percentage visiting the Pier and the Pavilion increased over
the period while the proportion of visitors to the other attractions fell. The number of
visitors to Pavillion was the highest in most years.
52.
Overview
Overall, it isclear that the percentage visiting the Pier
and the Pavilion increased over the period while the
proportion of visitors to the other attractions fell. The
number of visitors to Pavillion was the highest in most
years.
53.
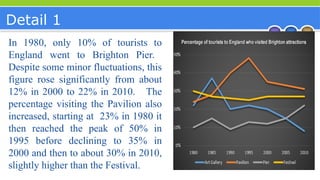
Detail 1
In 1980,only 10% of tourists to
England went to Brighton Pier.
Despite some minor fluctuations, this
figure rose significantly from about
12% in 2000 to 22% in 2010. The
percentage visiting the Pavilion also
increased, starting at 23% in 1980 it
then reached the peak of 50% in
1995 before declining to 35% in
2000 and then to about 30% in 2010,
slightly higher than the Festival.
54.
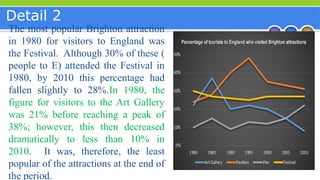
Detail 2
The mostpopular Brighton attraction
in 1980 for visitors to England was
the Festival. Although 30% of these (
people to E) attended the Festival in
1980, by 2010 this percentage had
fallen slightly to 28%.In 1980, the
figure for visitors to the Art Gallery
was 21% before reaching a peak of
38%; however, this then decreased
dramatically to less than 10% in
2010. It was, therefore, the least
popular of the attractions at the end of
the period.
55.
Step to studywriting task 1
While u write:
- Analyze the question (3’)
- Write the first time (15’)
- Check your answer (2’)- grammar ( S_V
agreement, preposition, punctuation,
spelling), repetition-paraphrase.
56.
Step to studywriting task 1
After you write:
Rewrite task 1 after you get the score and
feedback from the teacher.
You MUST:
- Don’t repeat your mistakes in other tests
- Don’t lose your point due to wrong
spelling.


![Plan
- Paraphrase task heading, using some different words.
- Summary paragraph
[1] the % visiting the Pier and the Pavilion increased
[2] the % visiting the other attractions fell.
- Paragraph 3: report some figures and report trends for
the Pier and the Pavilion. Include comparisons.
- Paragraph 4: report some figures and report trends for
the Festival and the Art Gallery. Include comparisons.](https://image.slidesharecdn.com/linechart-new-250411152036-7c5073db/85/Ielts-Writing-Task-1-Line-chart-new-pptx-49-320.jpg)


![3. RÚT GỌN MĐ và MĐQH (lý thuyết) - [19.12.2025] - IELTS.doc](https://cdn.slidesharecdn.com/ss_thumbnails/3-260111003400-c70a5322-thumbnail.jpg?width=640&height=640&fit=bounds)


![[tailieudieuky.com] Giáo trình bá»i dưỡng Há»c Sinh Giá»i và ...](https://cdn.slidesharecdn.com/ss_thumbnails/tailieudieuky-250705021953-321b0bc4-thumbnail.jpg?width=640&height=640&fit=bounds)


