BUDGETING BASICS
Aformal written statement of management’s
plans for a specified future time period,
expressed in financial terms
Primary way to communicate agreed-upon
objectives to all parts of the company
Promotes efficiency
Control device - important basis for performance
evaluation once adopted
3.
BUDGETING BASICS
Benefits ofBudgeting
Requires all levels of management to plan
ahead and formalize goals on a
recurring basis
Provides definite objectives for evaluating
performance at each level of
responsibility
Creates an early warning system
for potential problems
4.
BUDGETING BASICS
Benefits ofBudgeting
Facilitates coordination of activities
within the business
Results in greater management
awareness of the entity’s overall
operations and the impact of
external factors
Motivates personnel throughout
organization to meet planned
objectives
5.
BUDGETING BASICS
Role ofAccounting
Historical accounting data on
revenues, costs, and expenses
help in formulating future
budgets
Accountants are normally
responsible for presenting
management’s budgeting goals in
financial terms
The budget and its
administration are, however,
entirely management’s
responsibility
6.
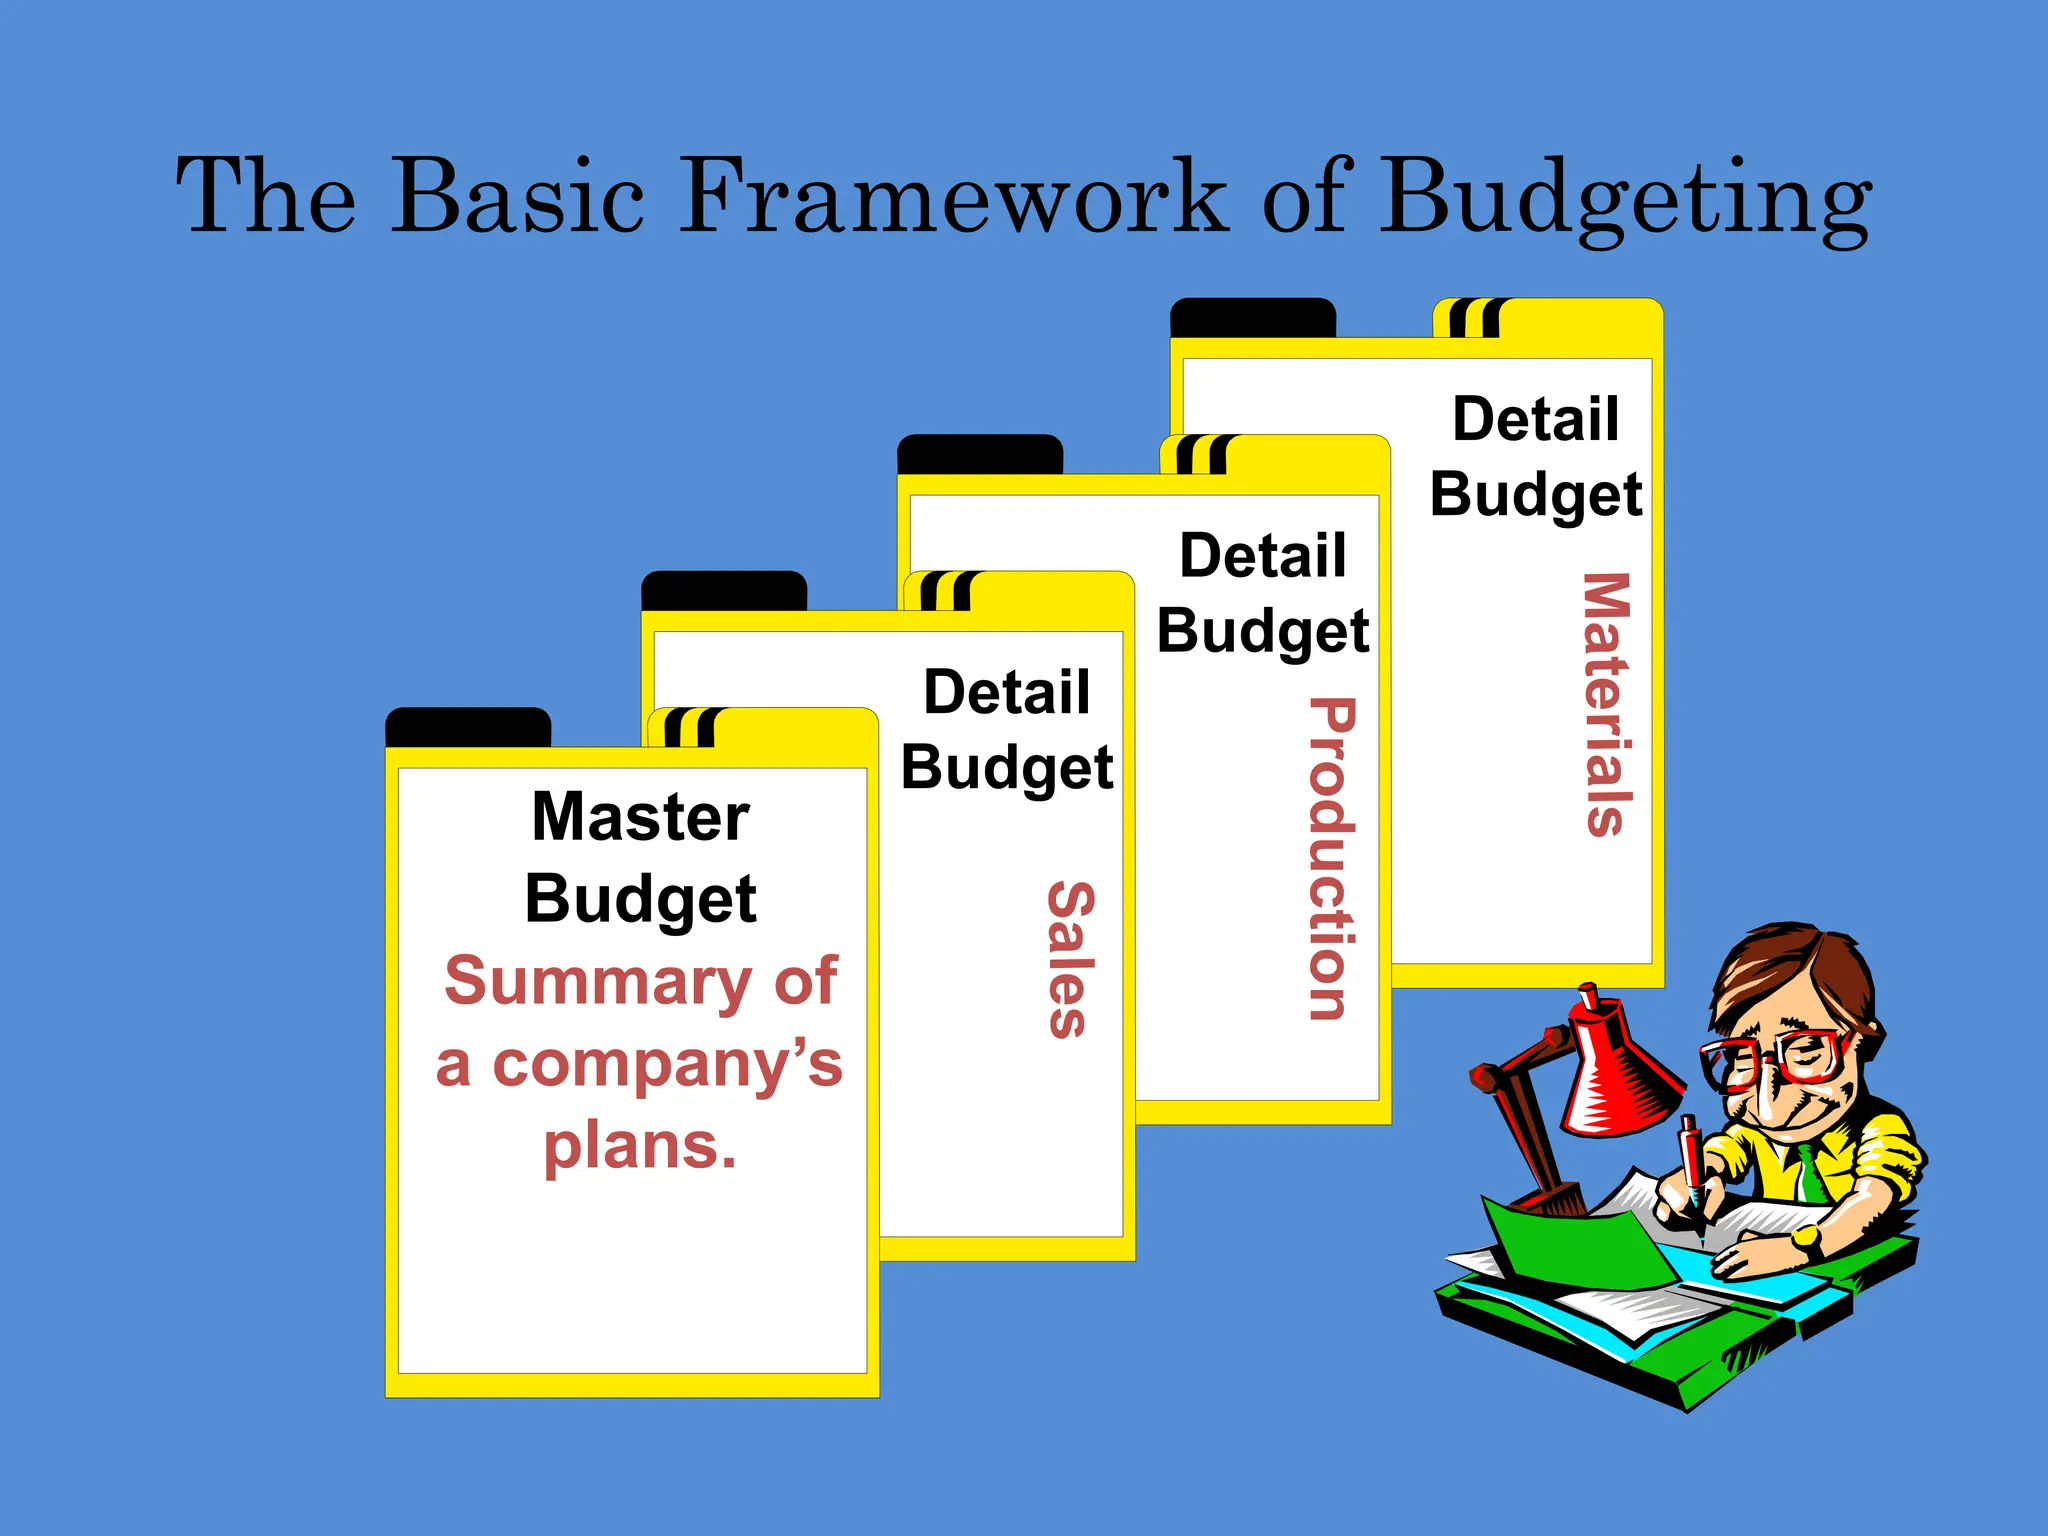
The Basic Frameworkof Budgeting
Detail
Budget
Detail
Budget
Detail
Budget
Master
Budget
Summary of
a company’s
plans.
Sal
es
Production
Mat
eri
als
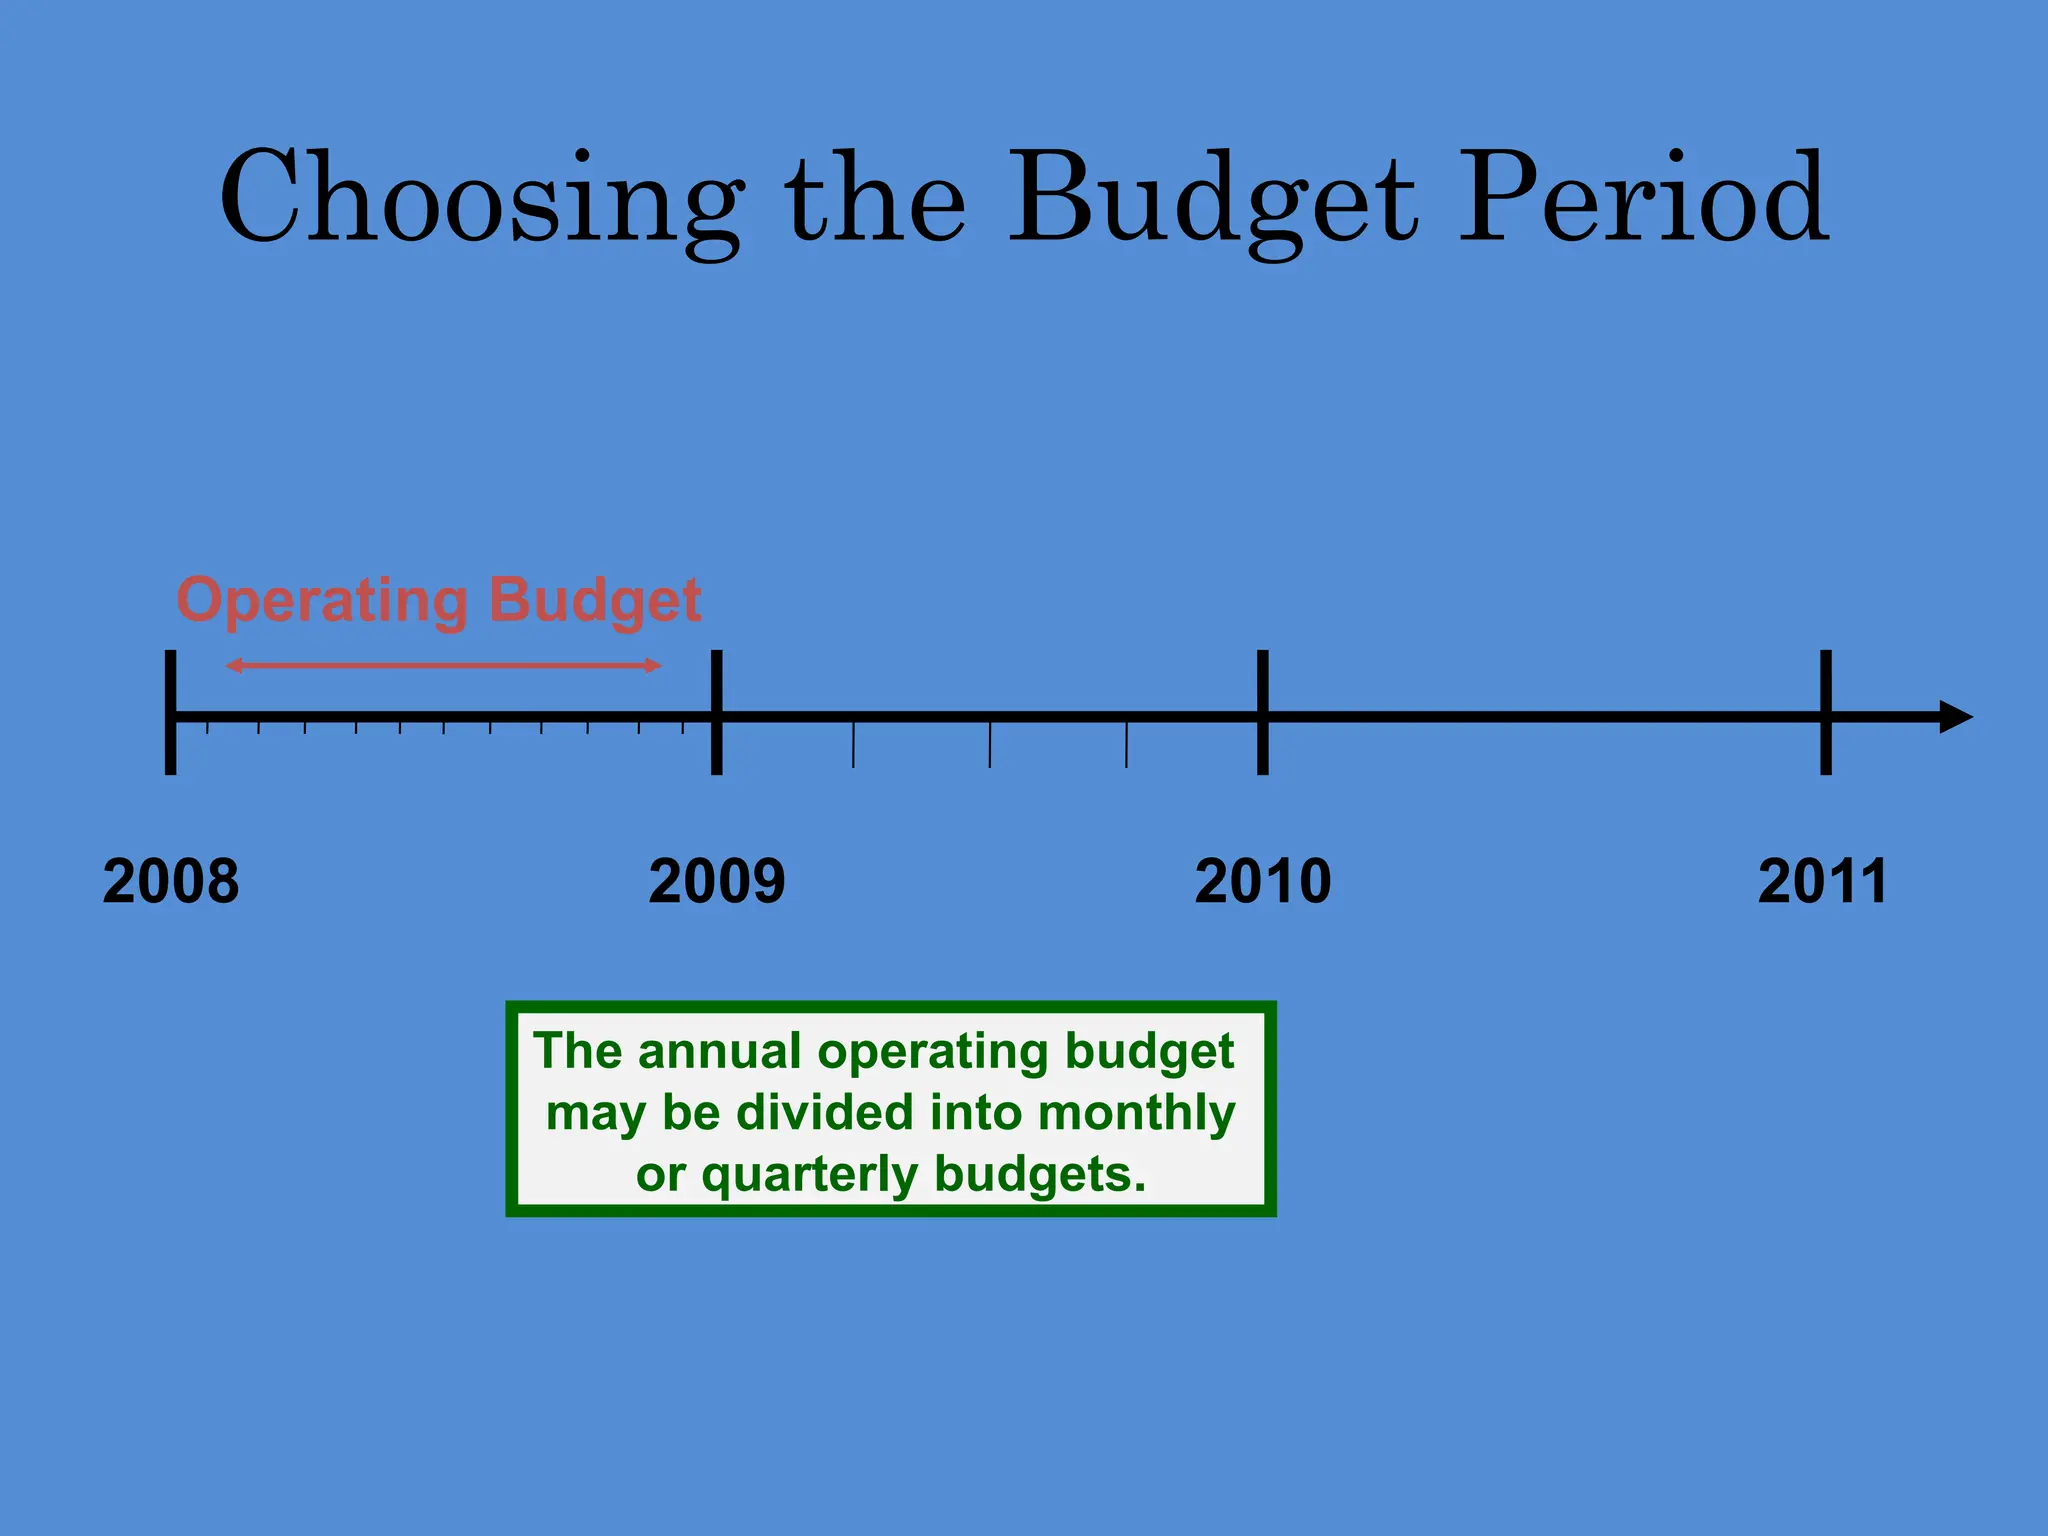
Choosing the BudgetPeriod
Operating Budget
2008 2009 2010 2011
The annual operating budget
may be divided into monthly
or quarterly budgets.
9.
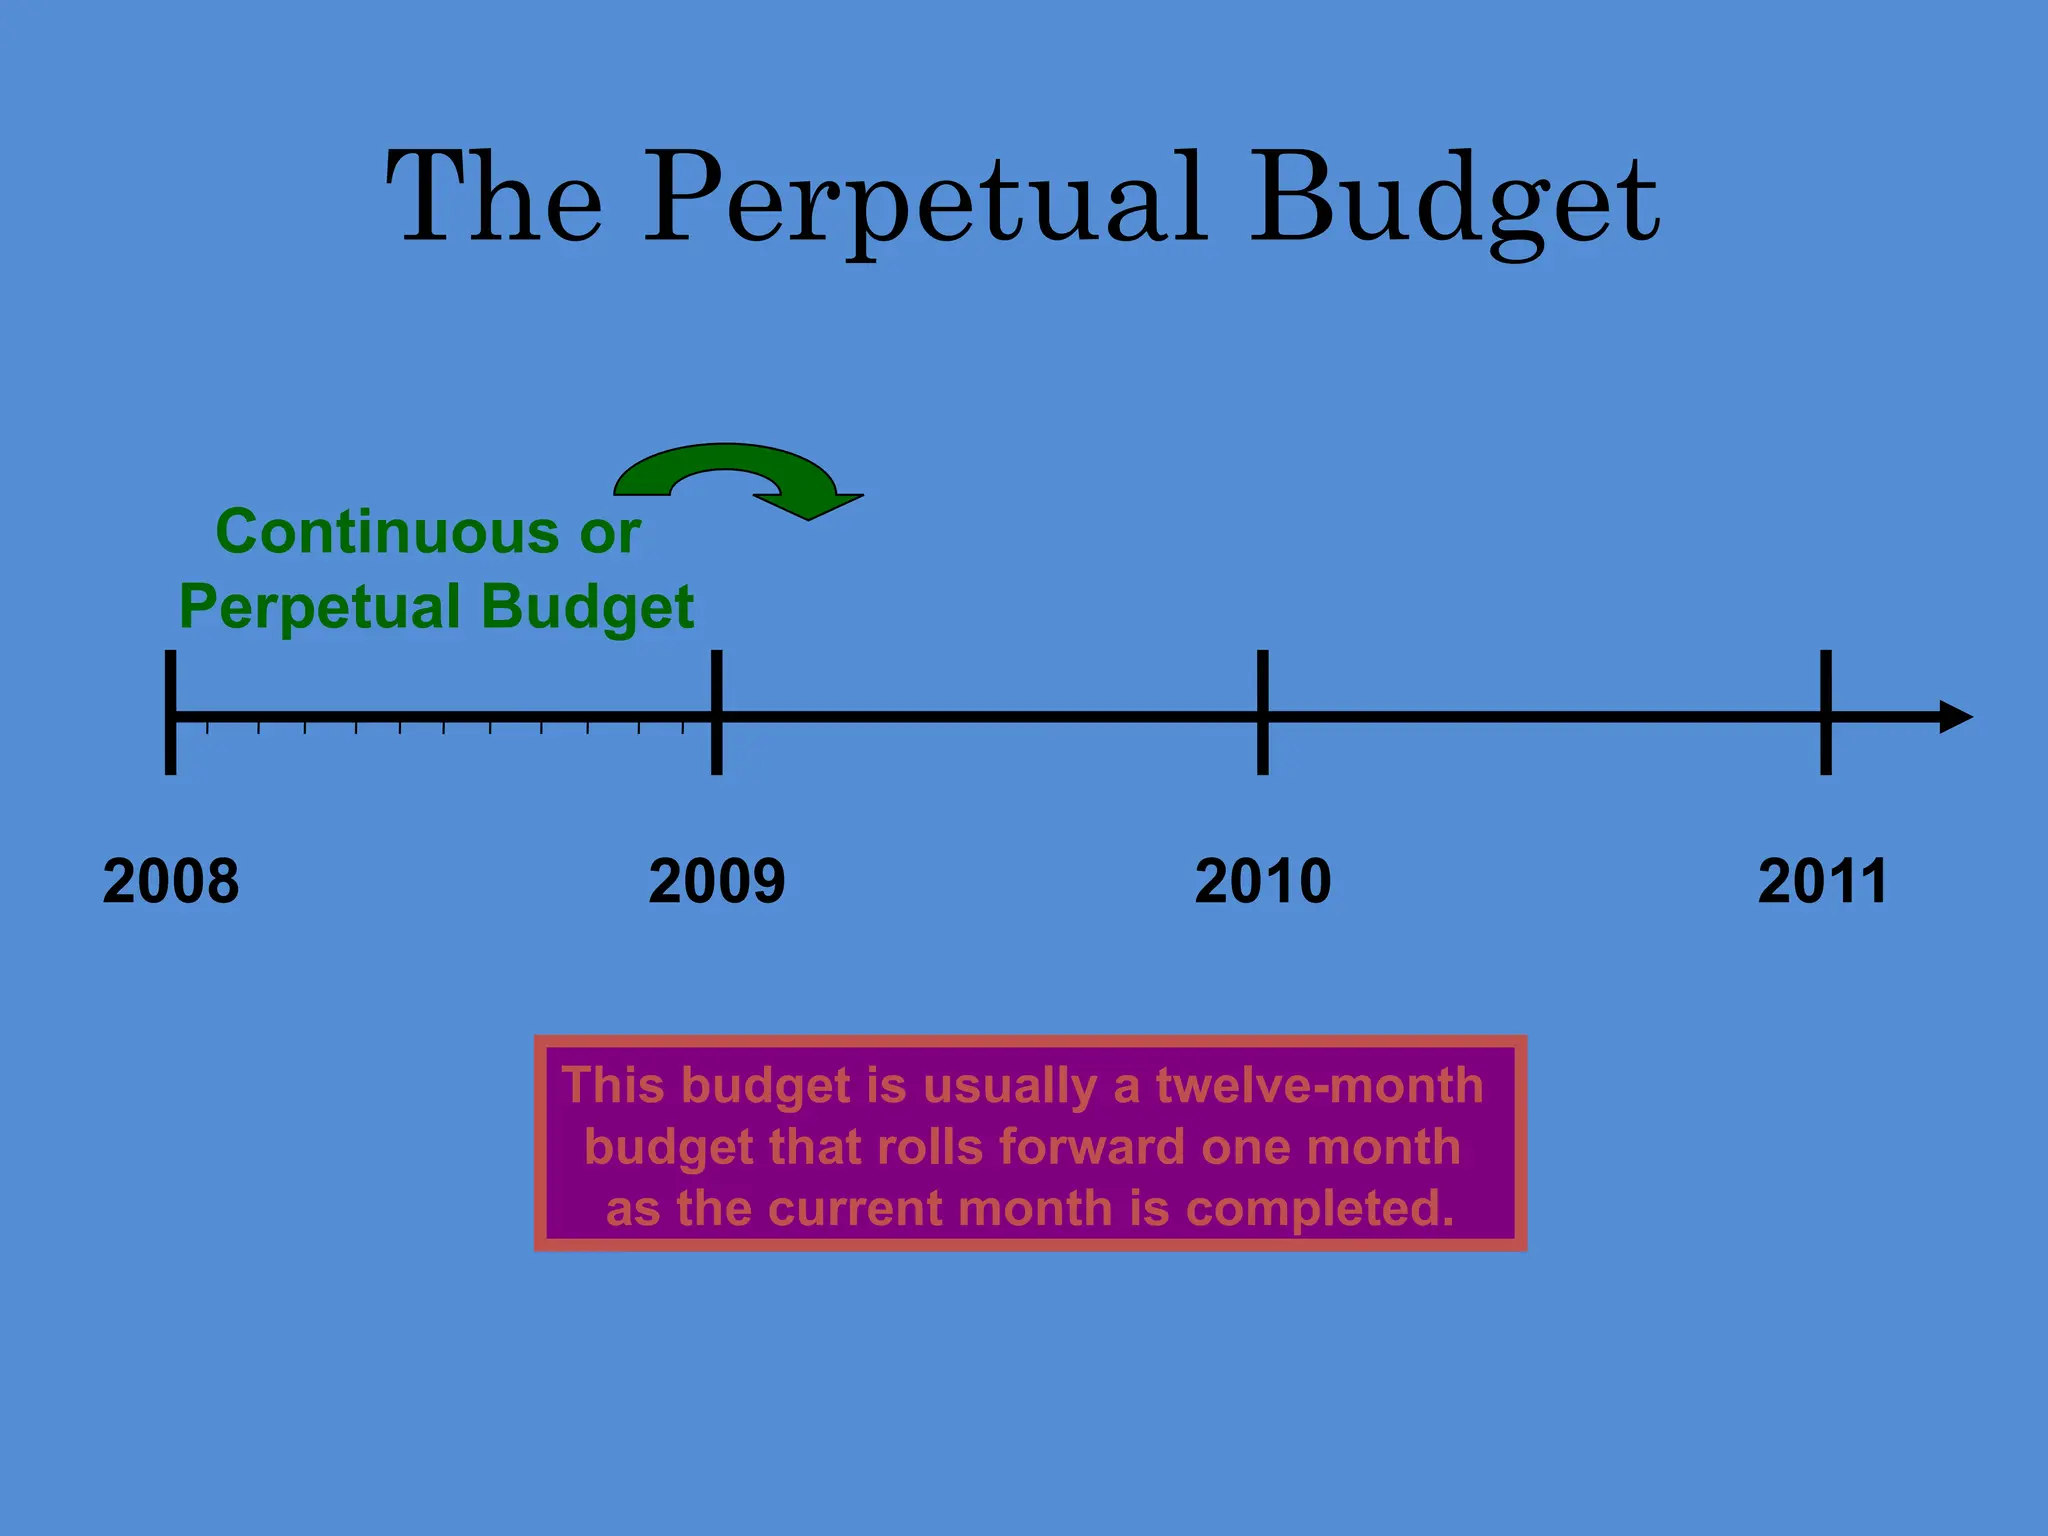
The Perpetual Budget
20082009 2010 2011
Continuous or
Perpetual Budget
This budget is usually a twelve-month
budget that rolls forward one month
as the current month is completed.
10.
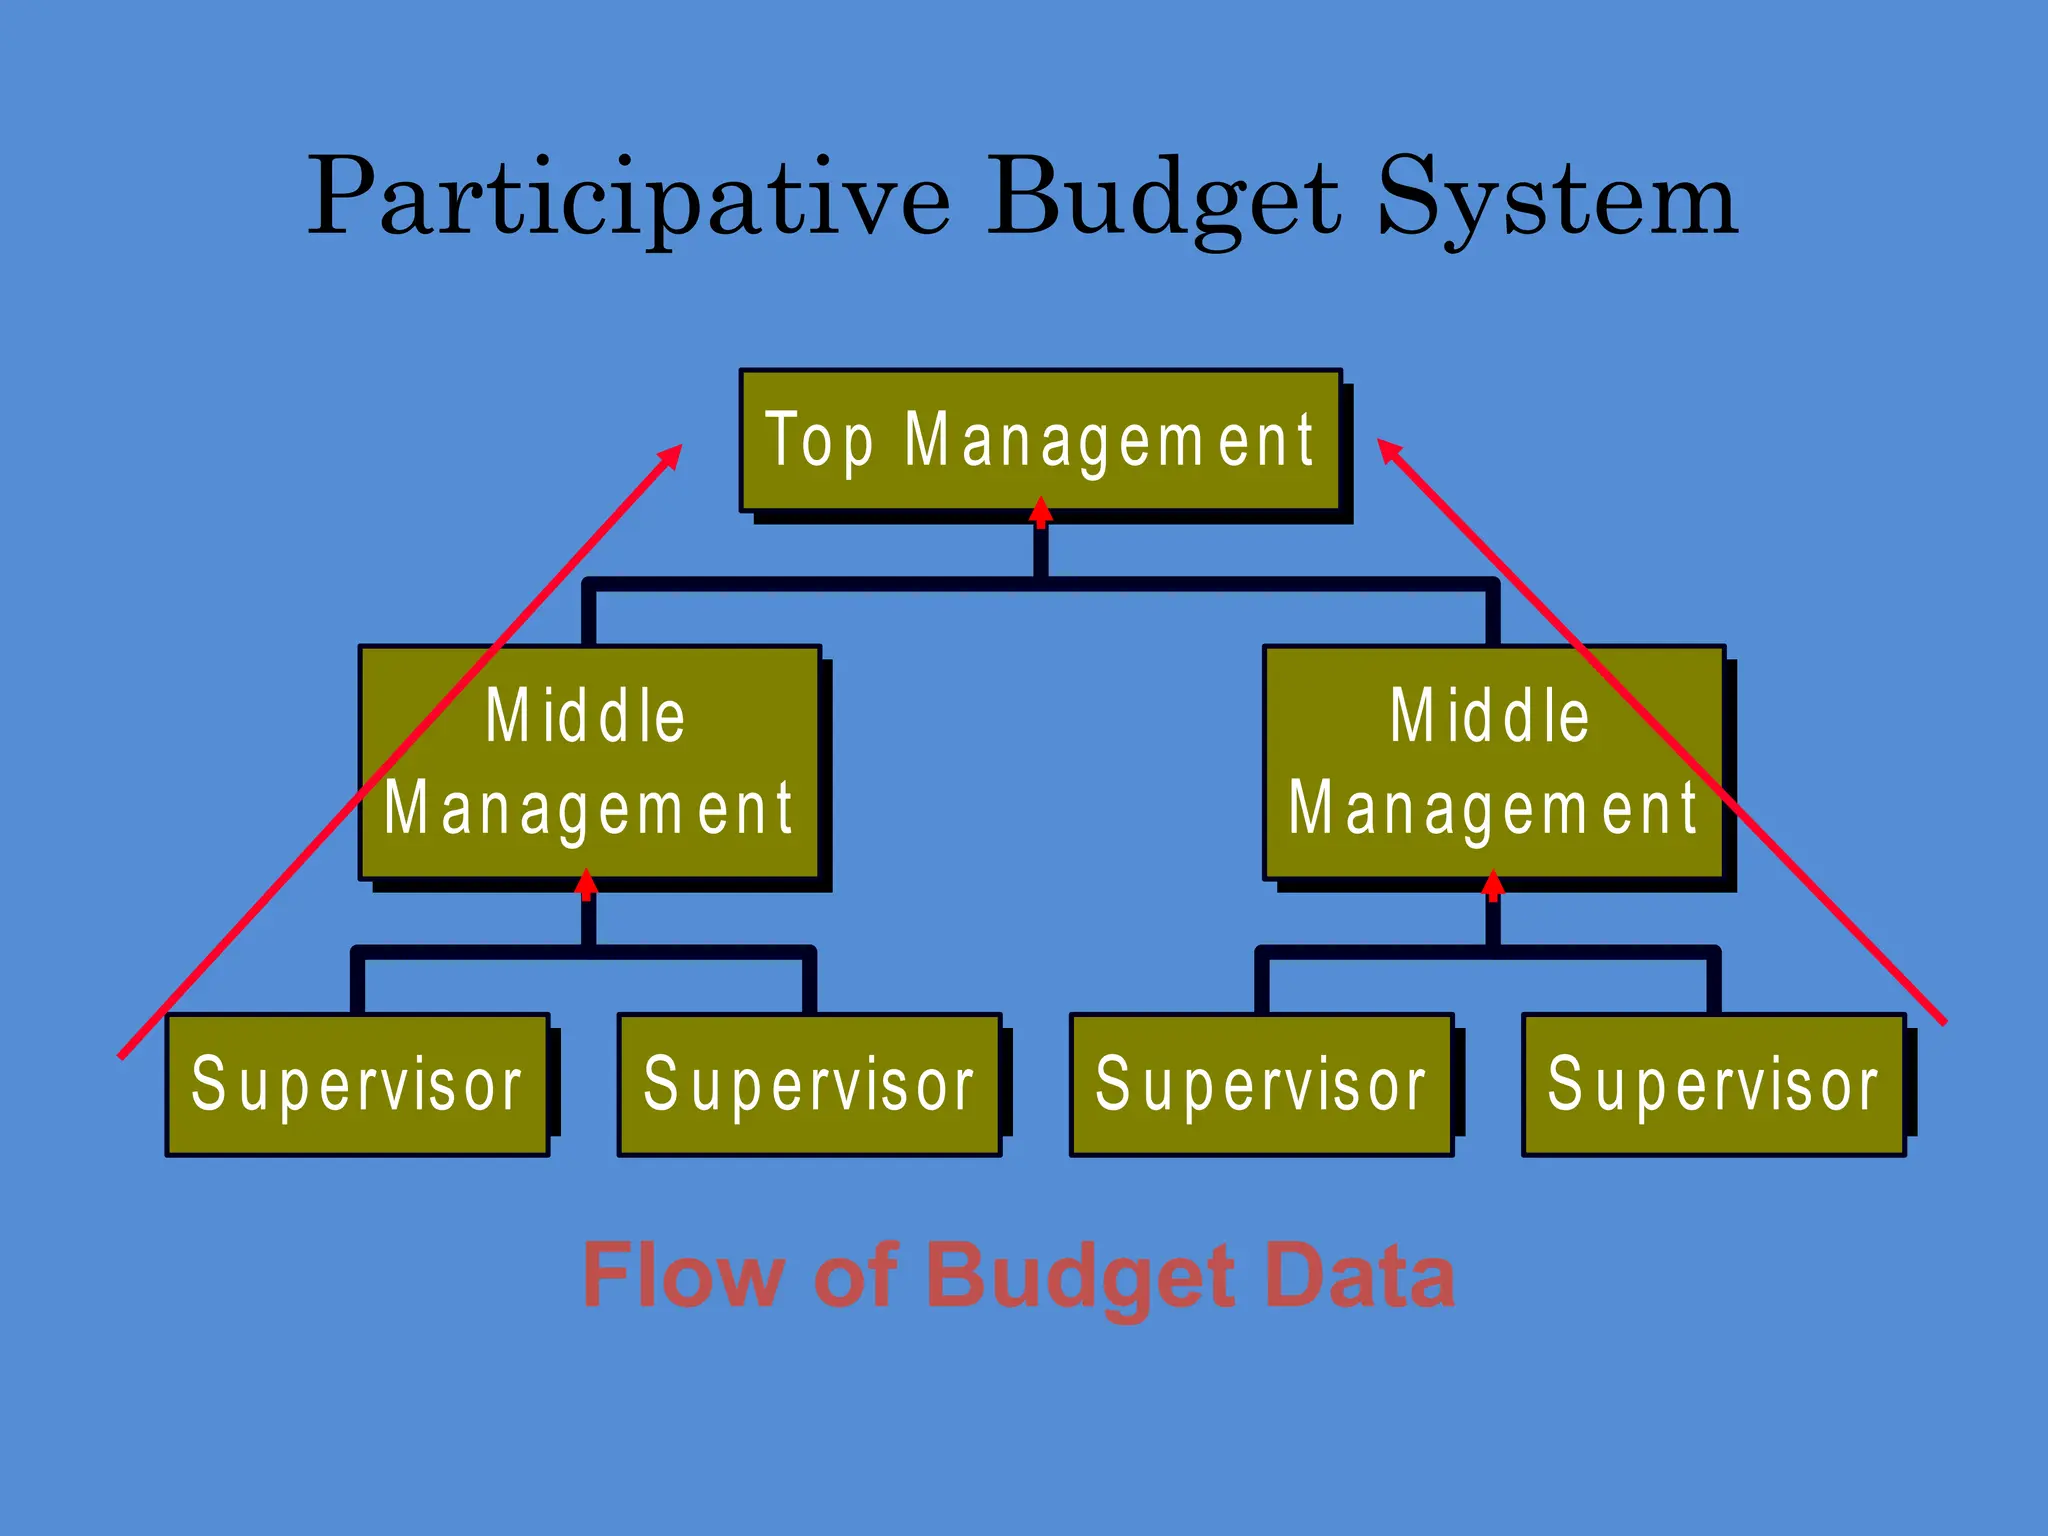
Participative Budget System
Flowof Budget Data
Supervisor Supervisor
M iddle
M anagem ent
Supervisor Supervisor
M iddle
M anagem ent
Top M anagem ent
11.
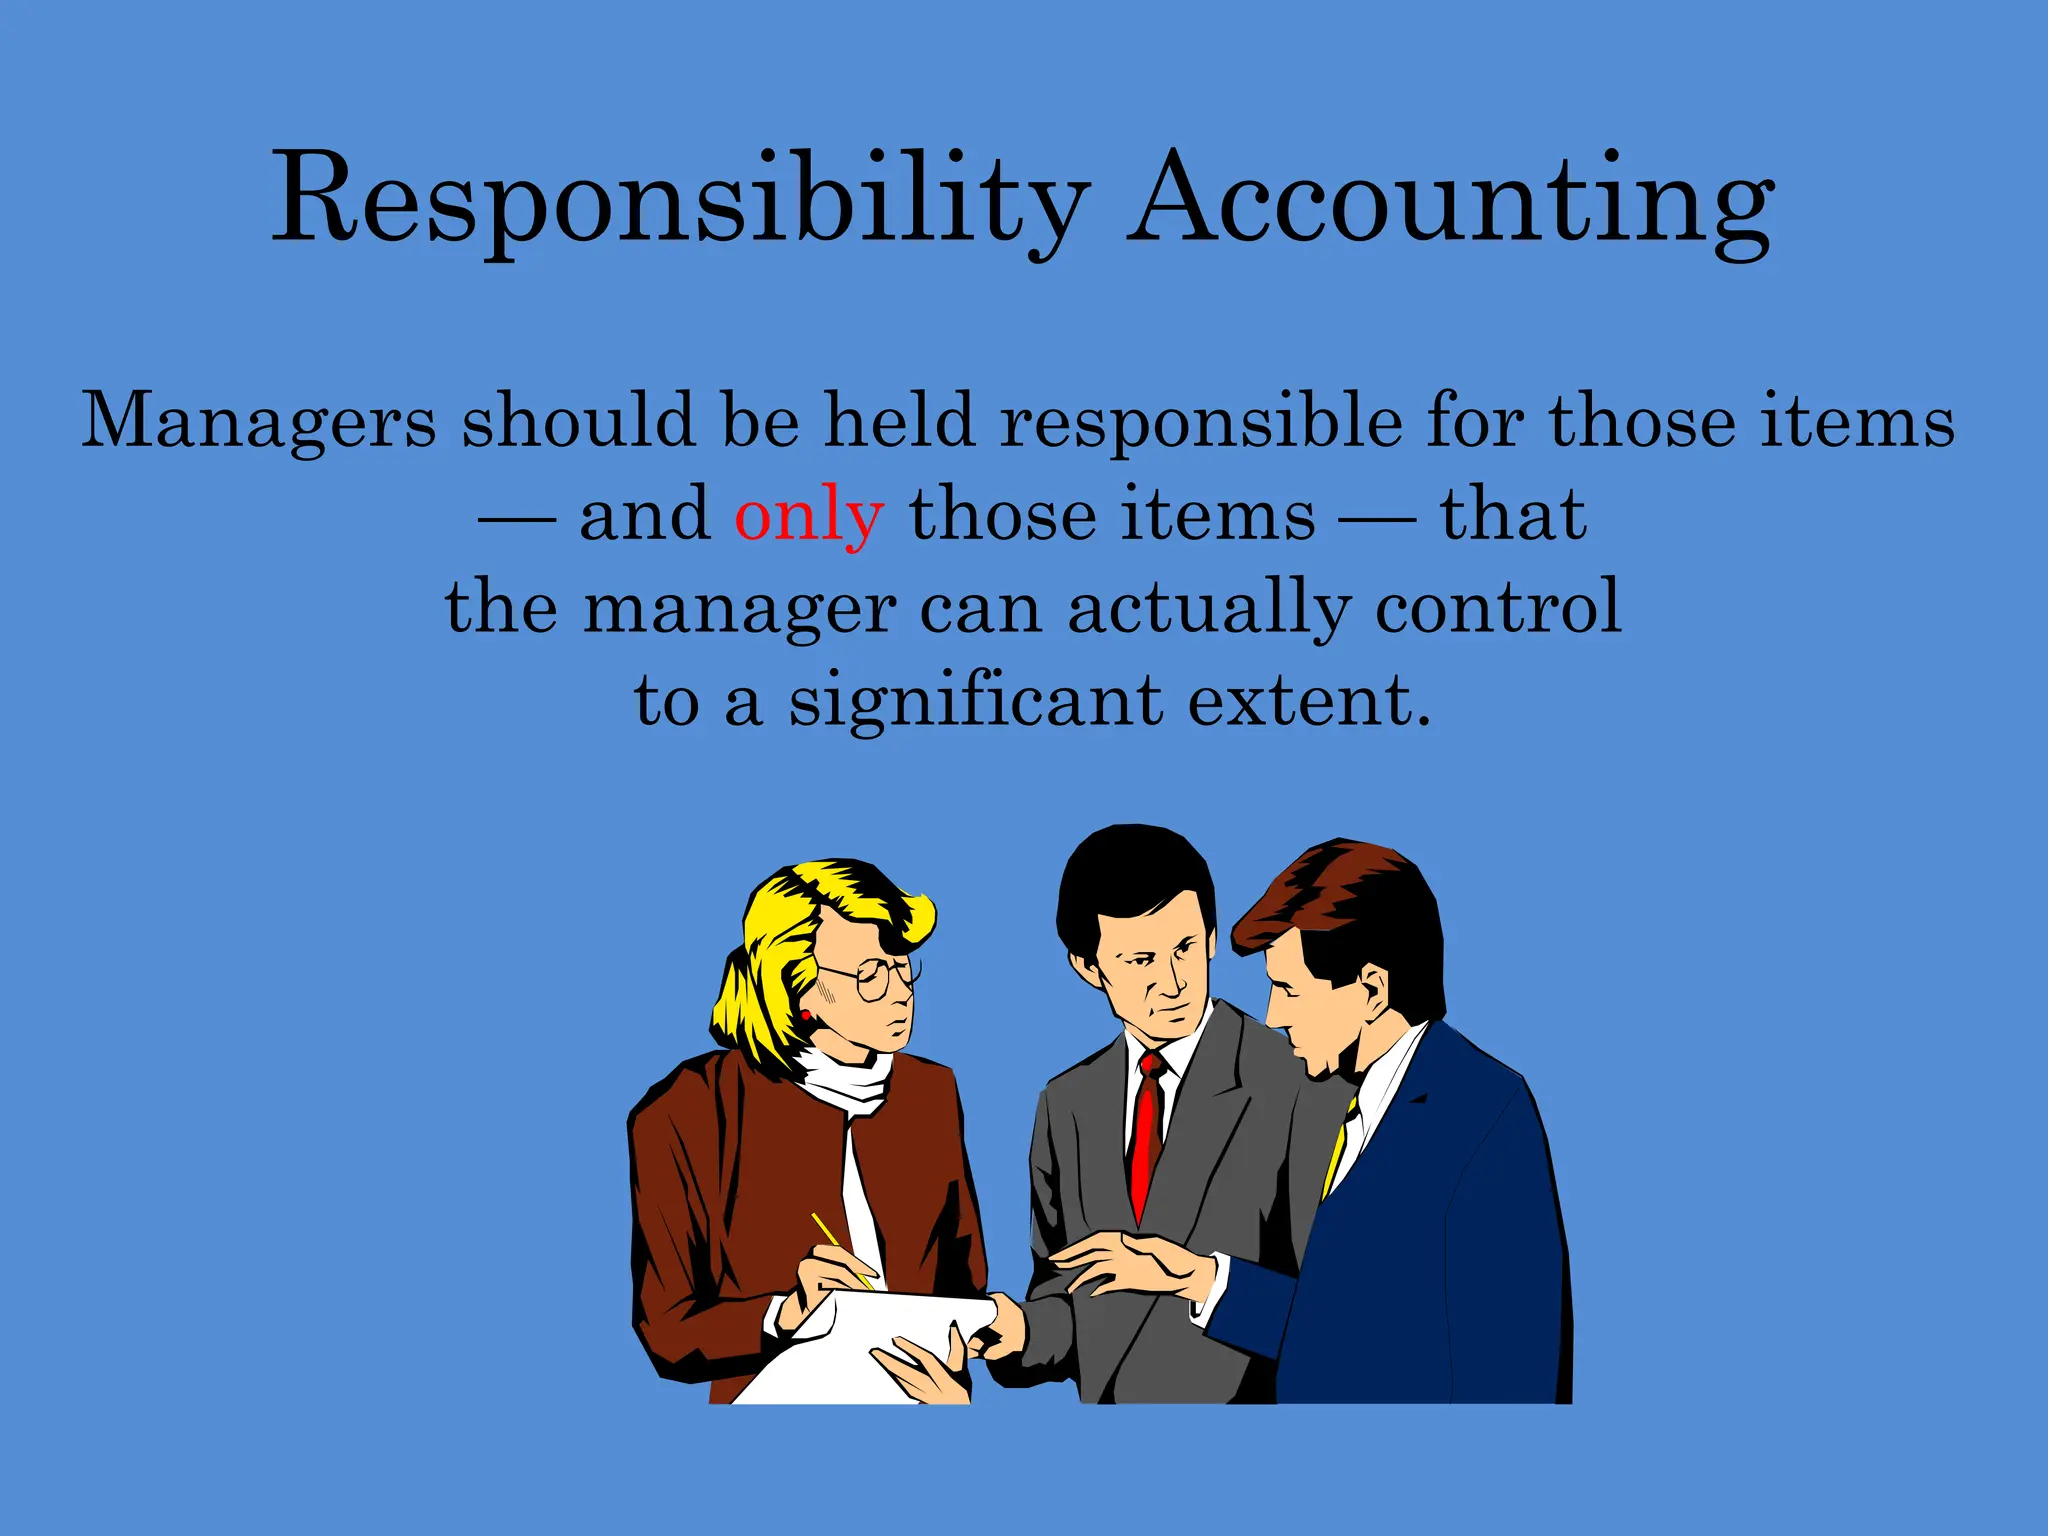
Responsibility Accounting
Managers shouldbe held responsible for those items
— and only those items — that
the manager can actually control
to a significant extent.
12.
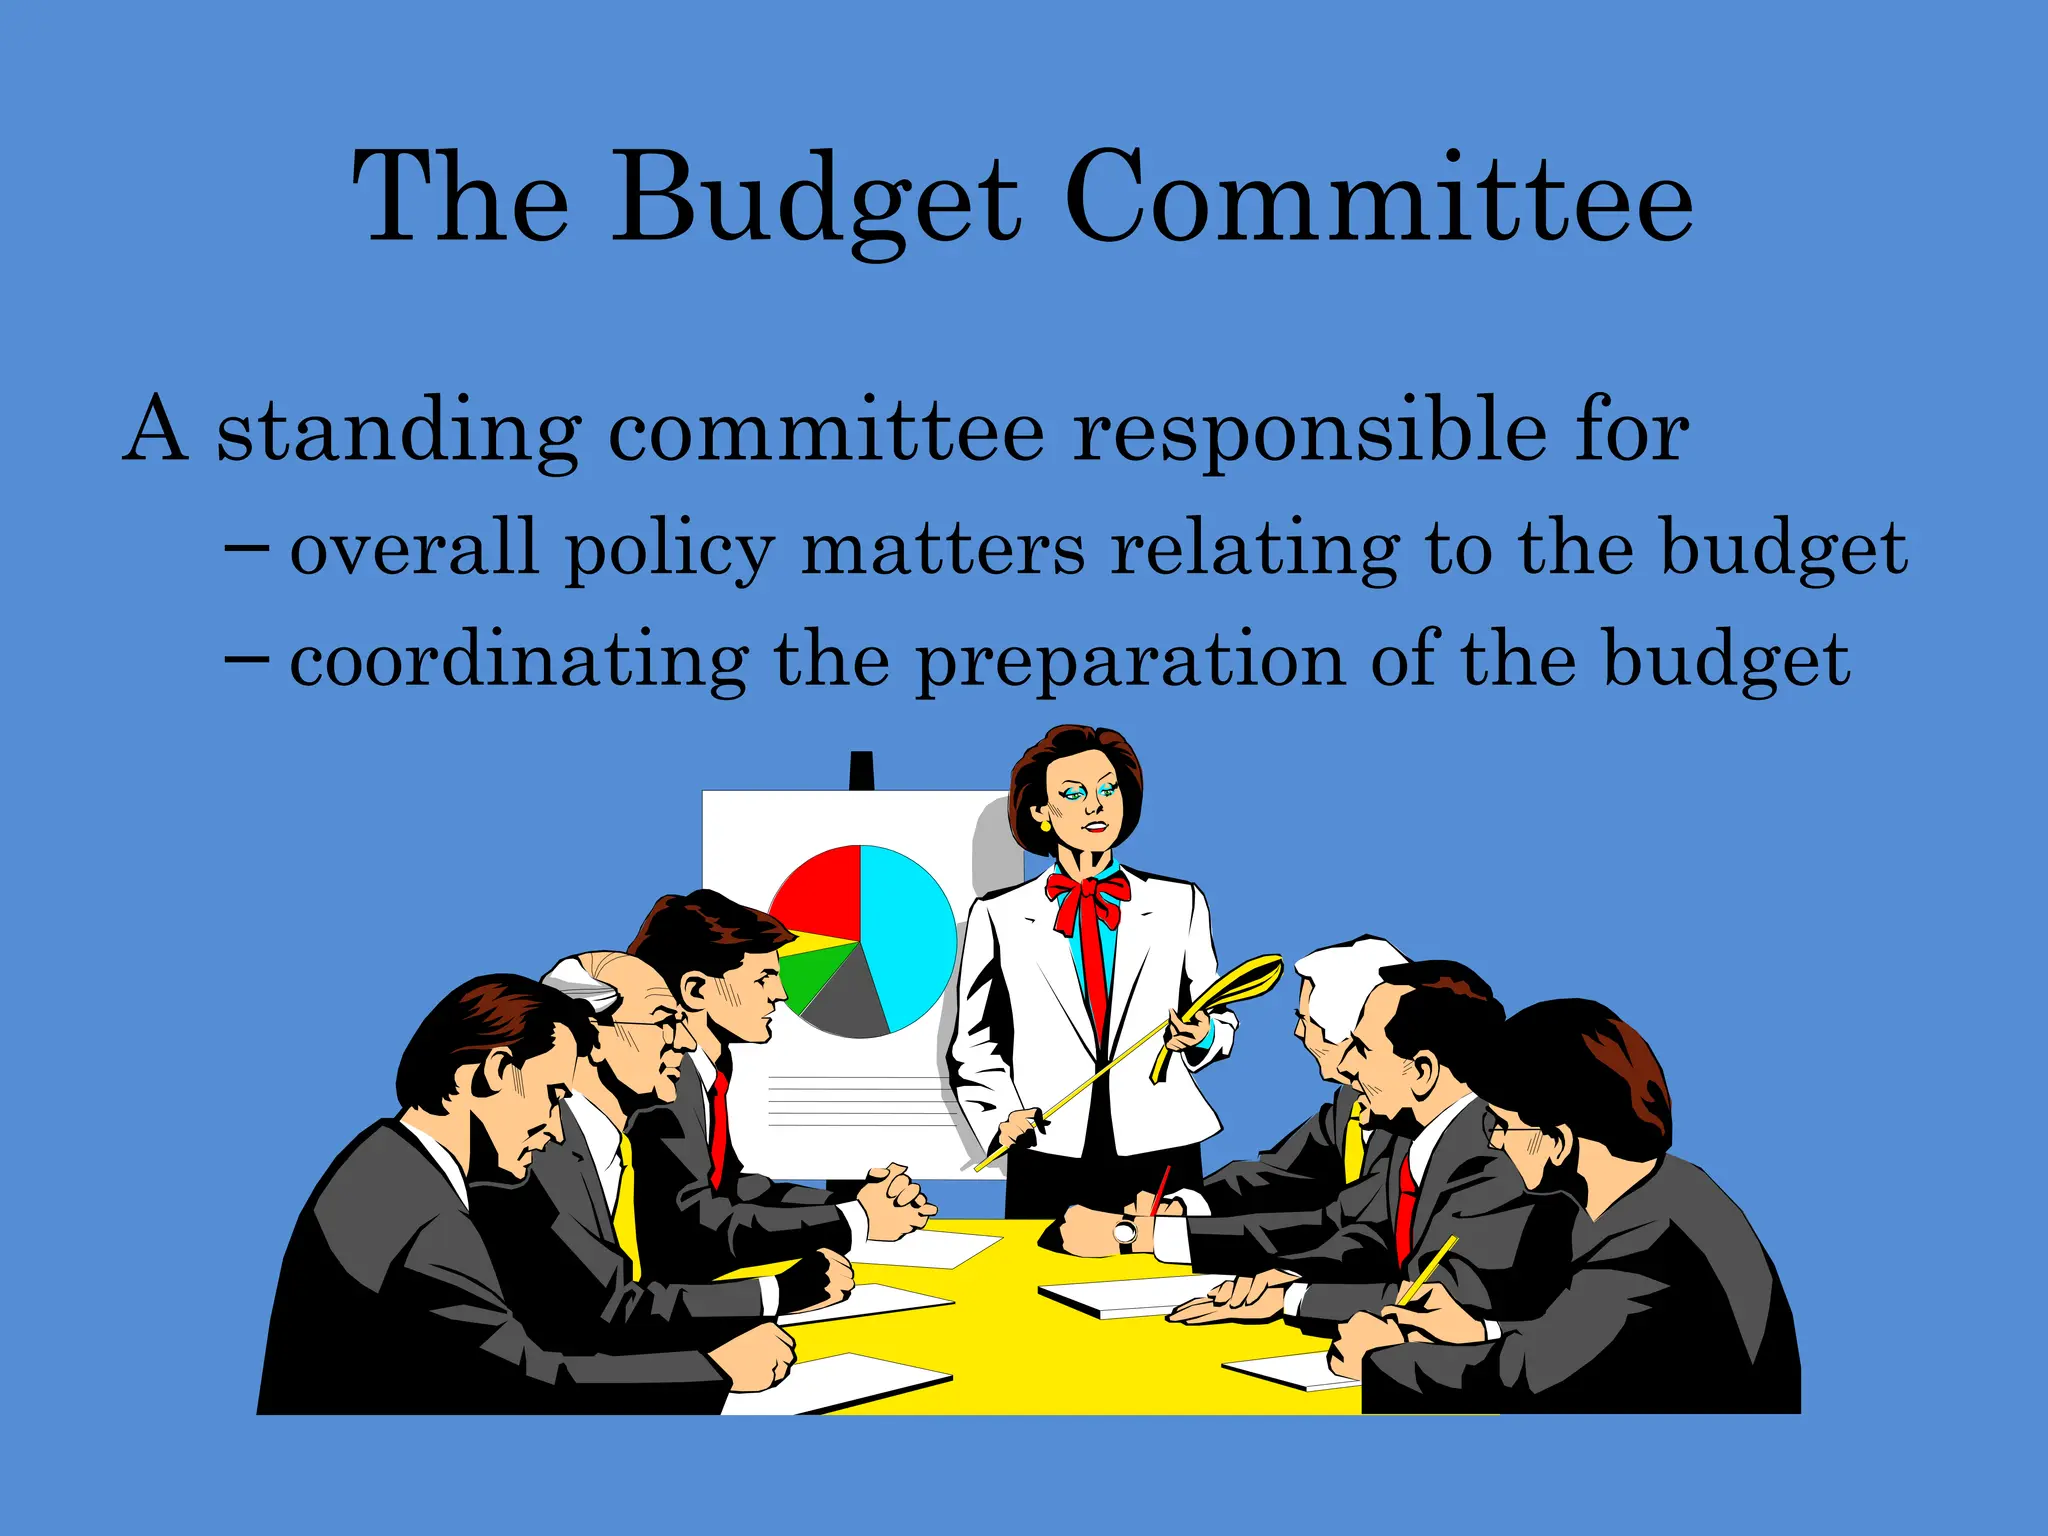
The Budget Committee
Astanding committee responsible for
– overall policy matters relating to the budget
– coordinating the preparation of the budget
13.
Chapter 9 Quiz:Question 1
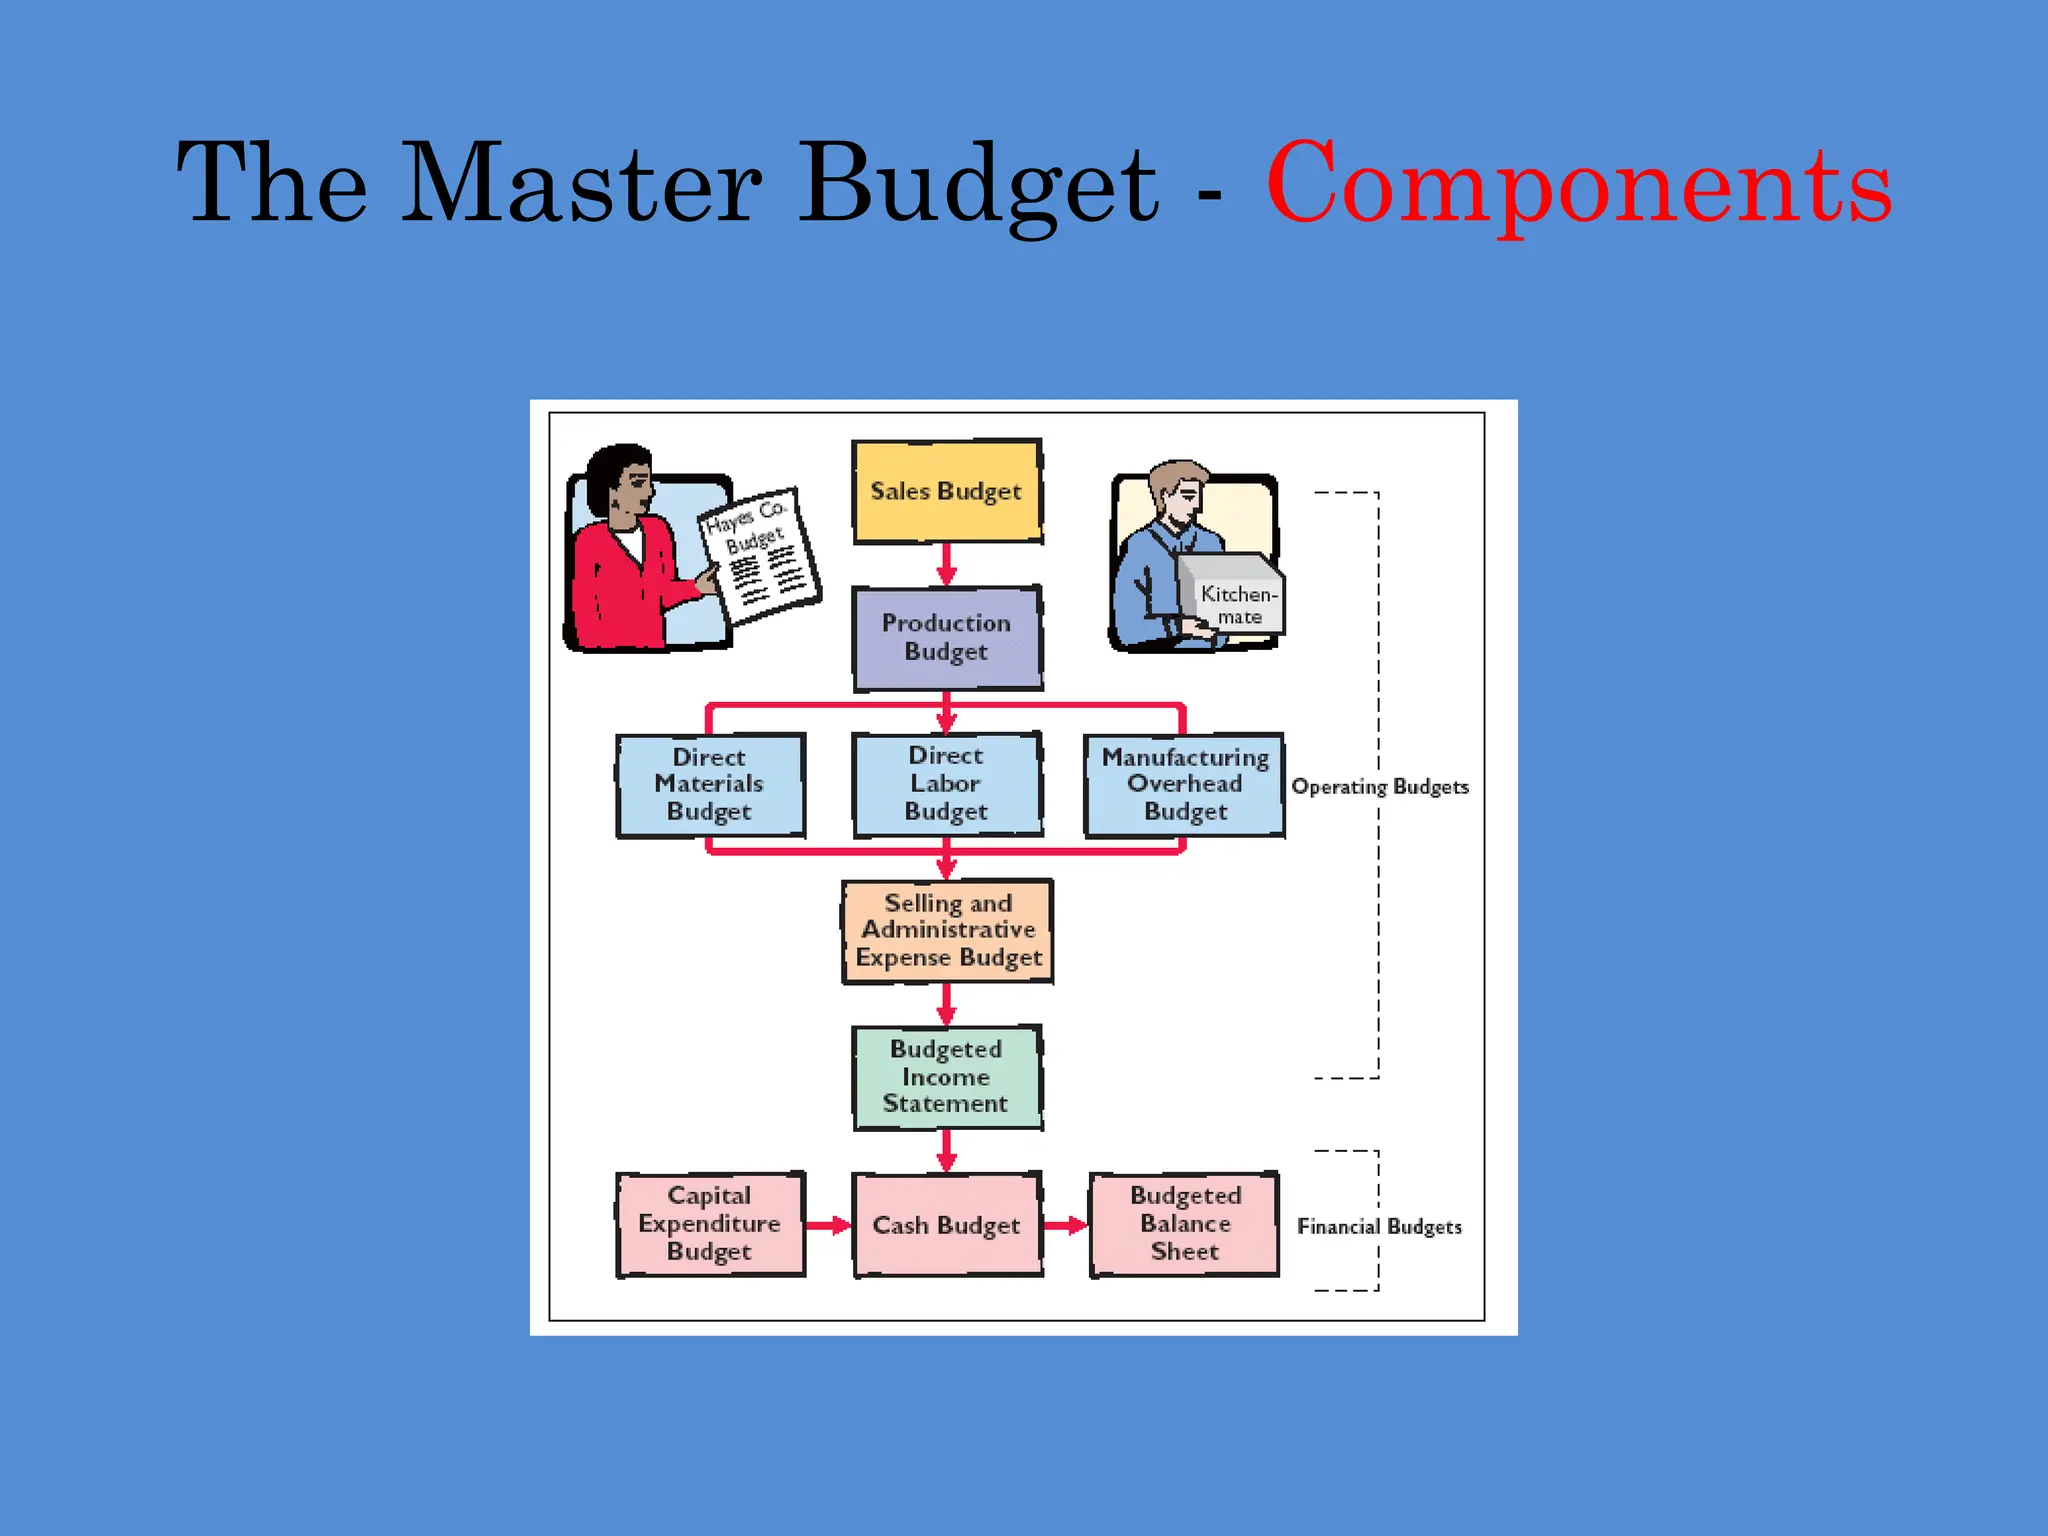
Which of the following is NOT true about the Master Budget?
a) It is composed of many interrelated budgets.
b) It consists of 2 classes of budgets: Operating Budgets and Financial
Budgets.
c) Within the master budget the first budget to be prepared is the
sales budget.
d) It constitutes a plan of action for a specified period of time.
e) All of the above are true.
14.
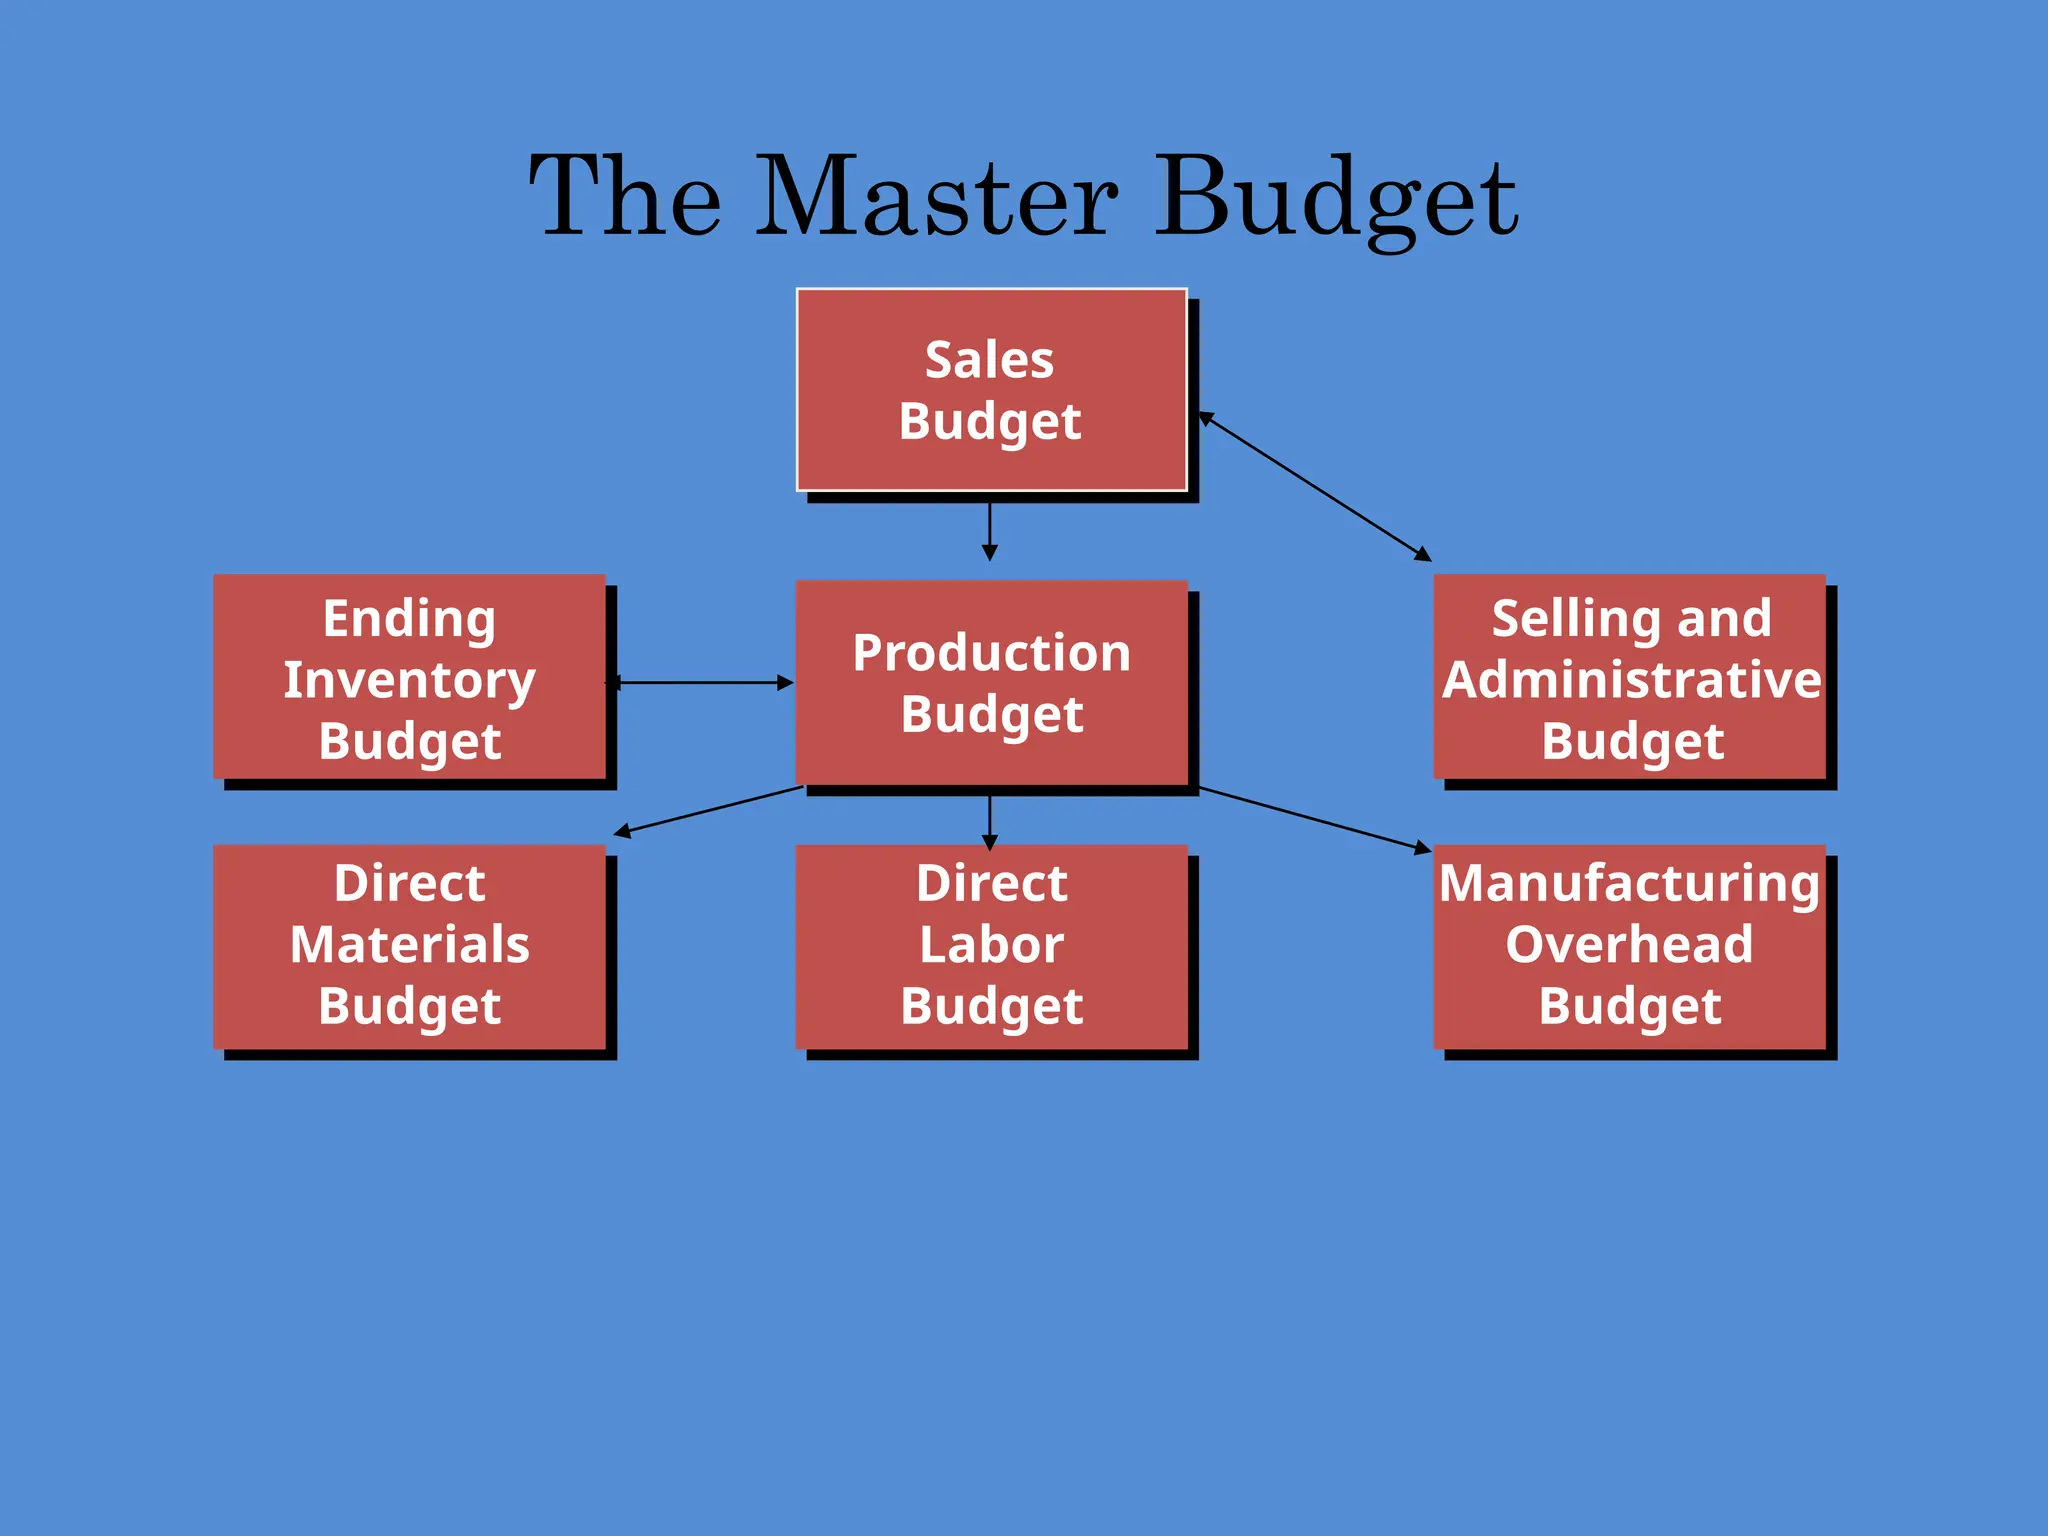
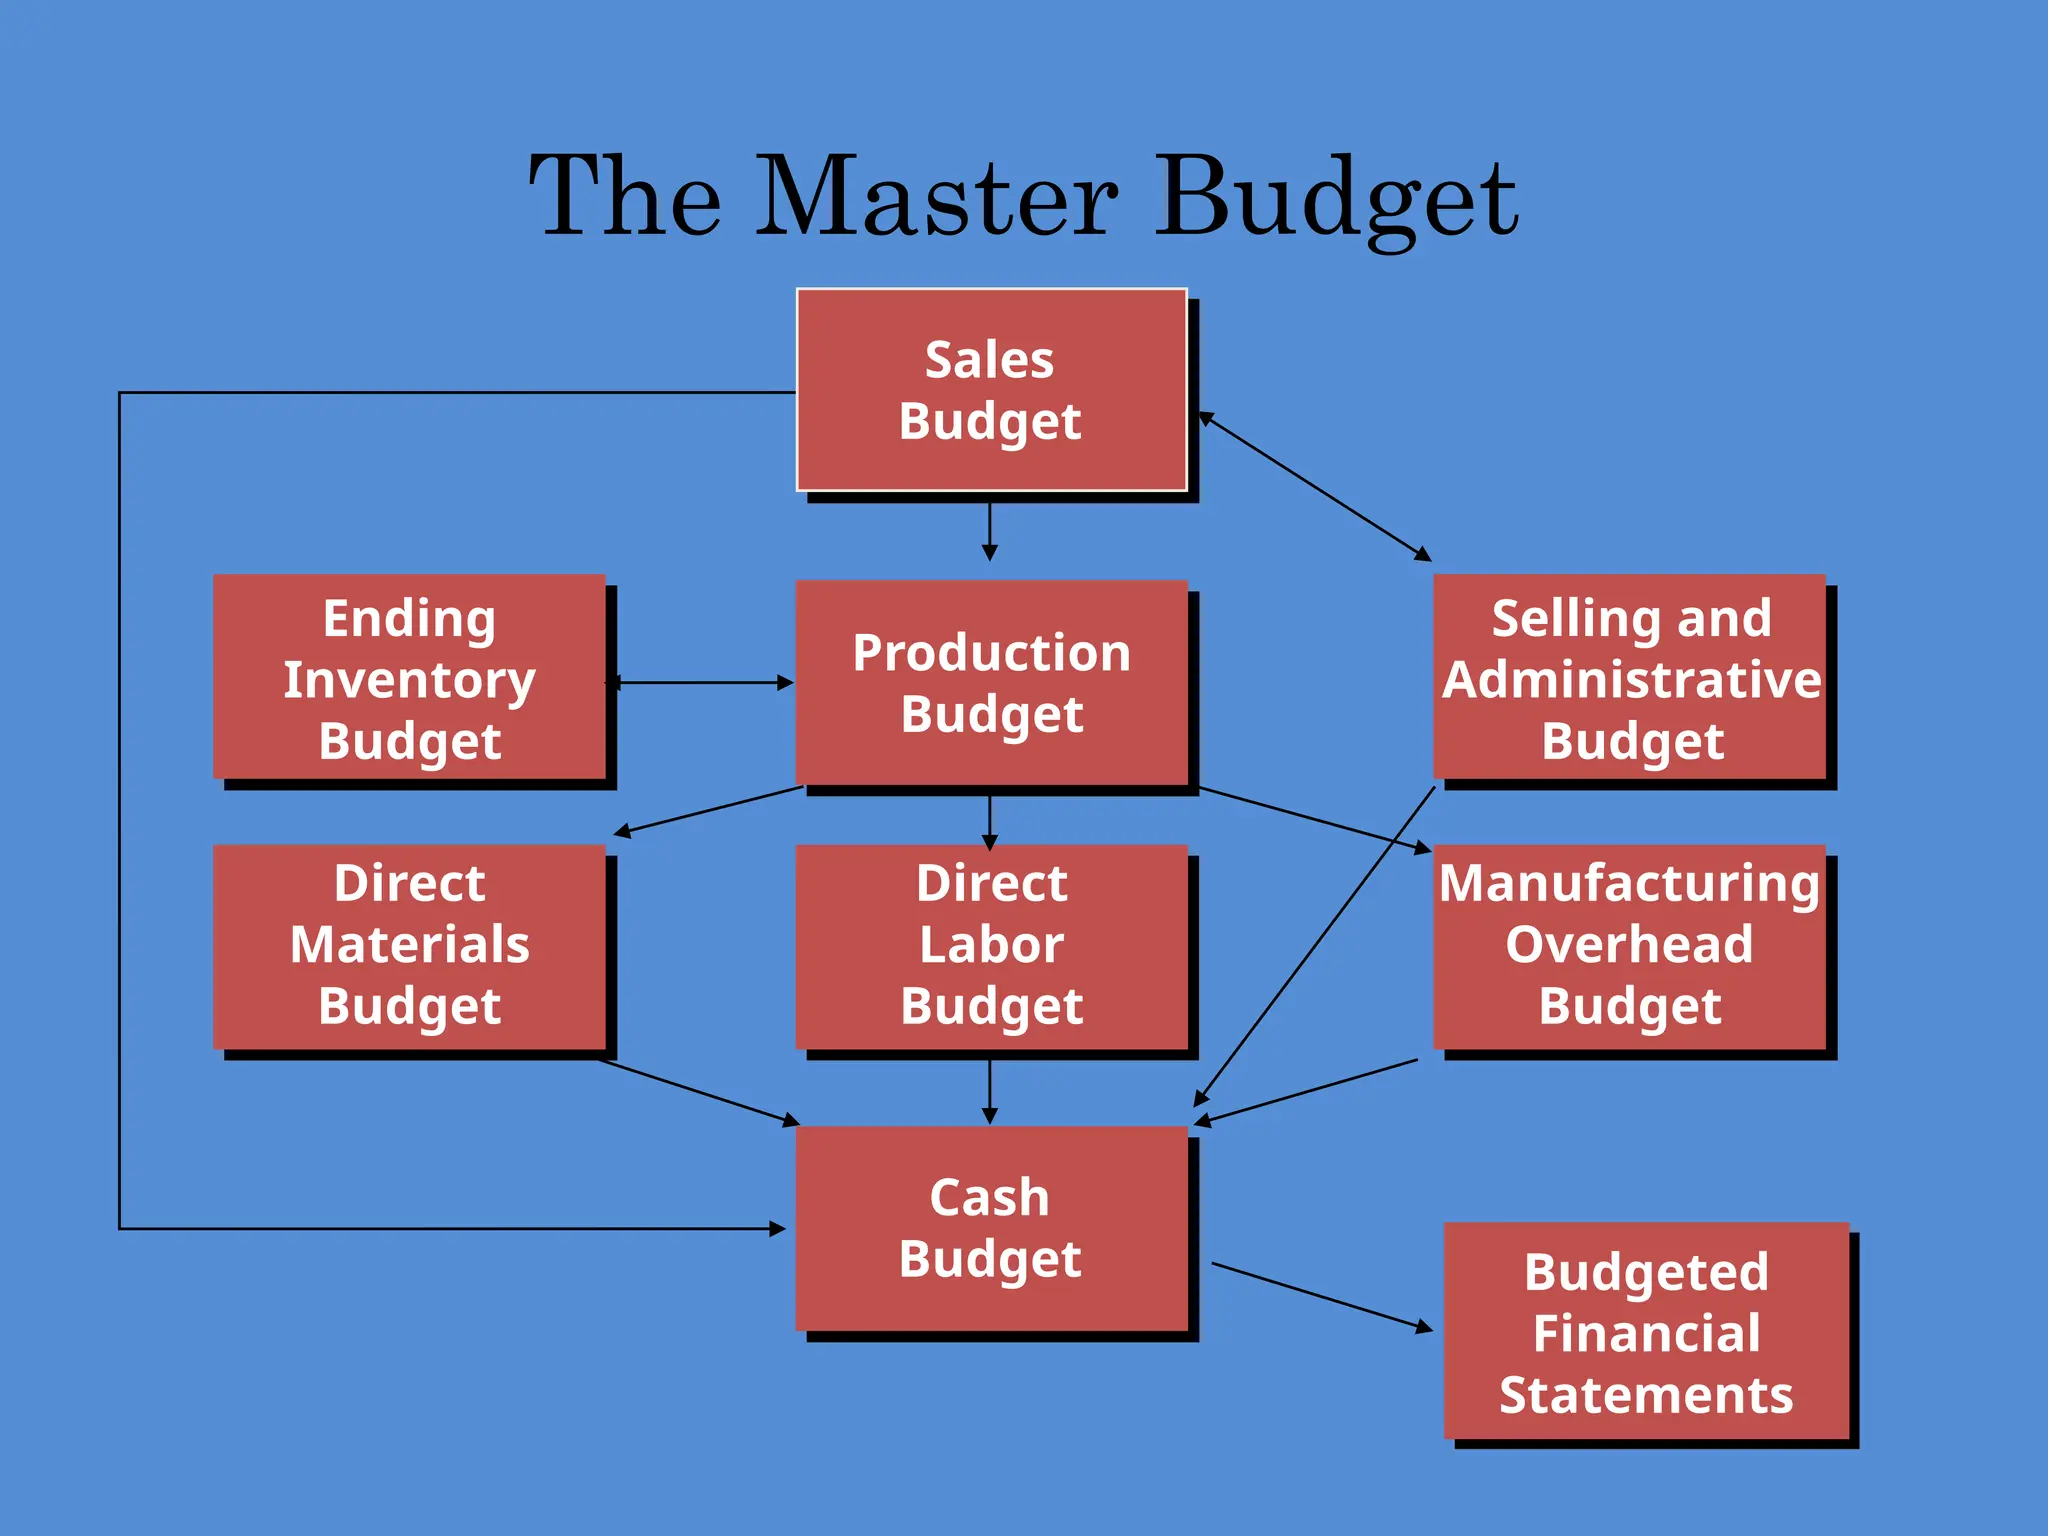
The Master Budget
Sellingand
Administrative
Budget
Production
Budget
Ending
Inventory
Budget
Direct
Materials
Budget
Direct
Labor
Budget
Manufacturing
Overhead
Budget
Sales
Budget
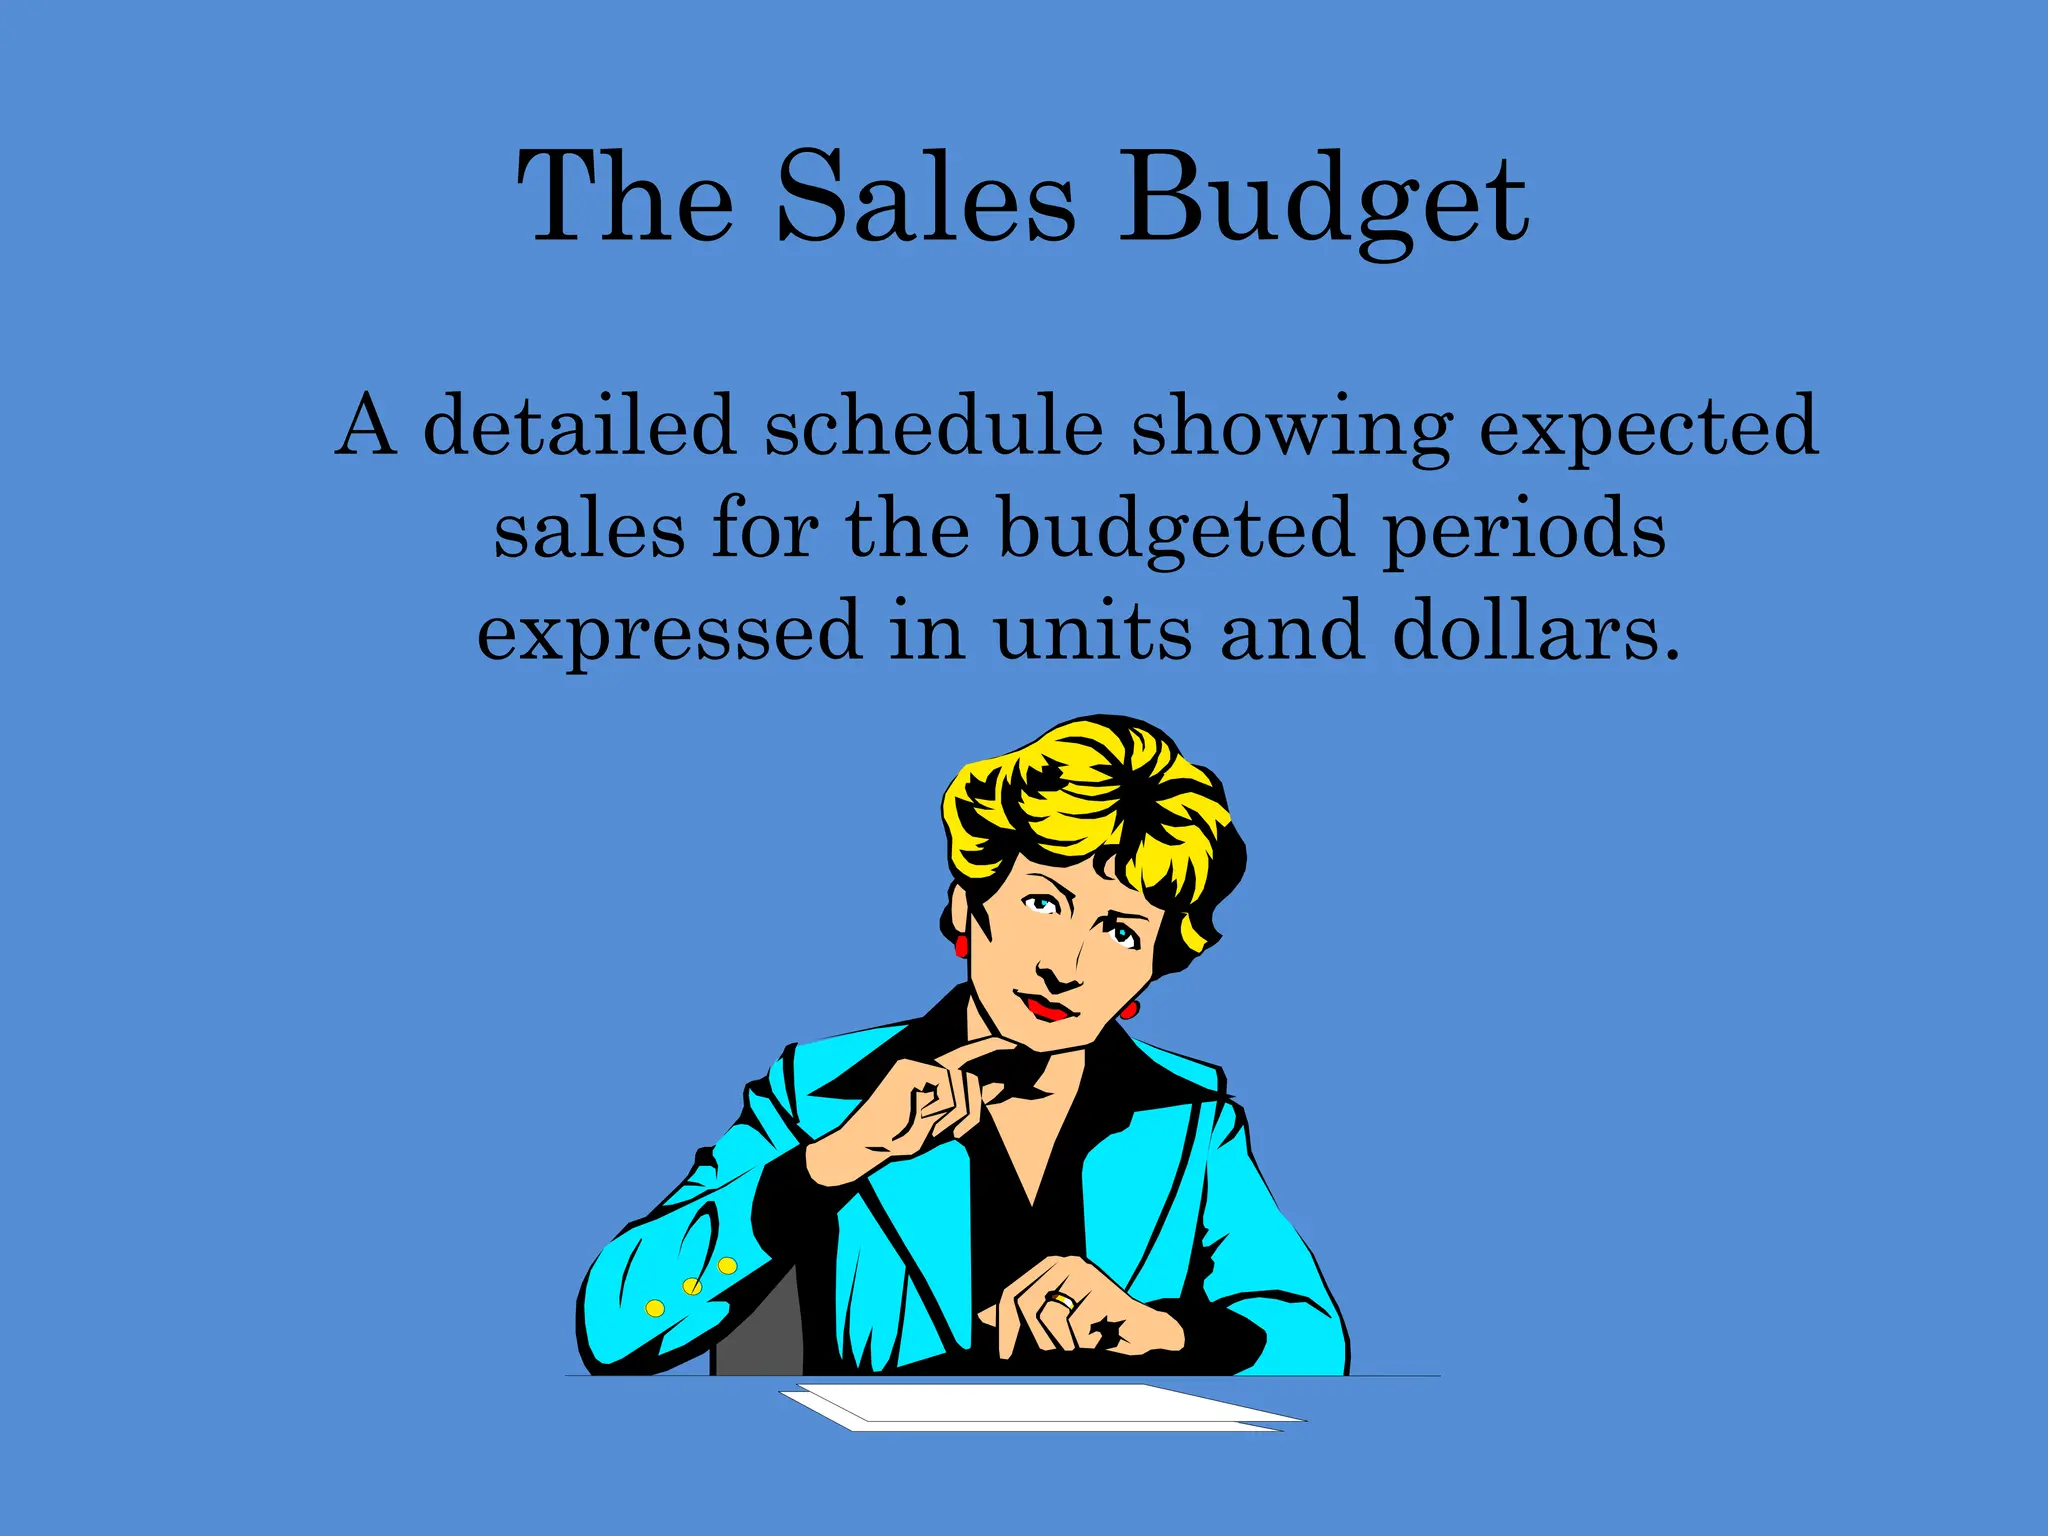
The Sales Budget
Adetailed schedule showing expected
sales for the budgeted periods
expressed in units and dollars.
17.
The Sales Budget
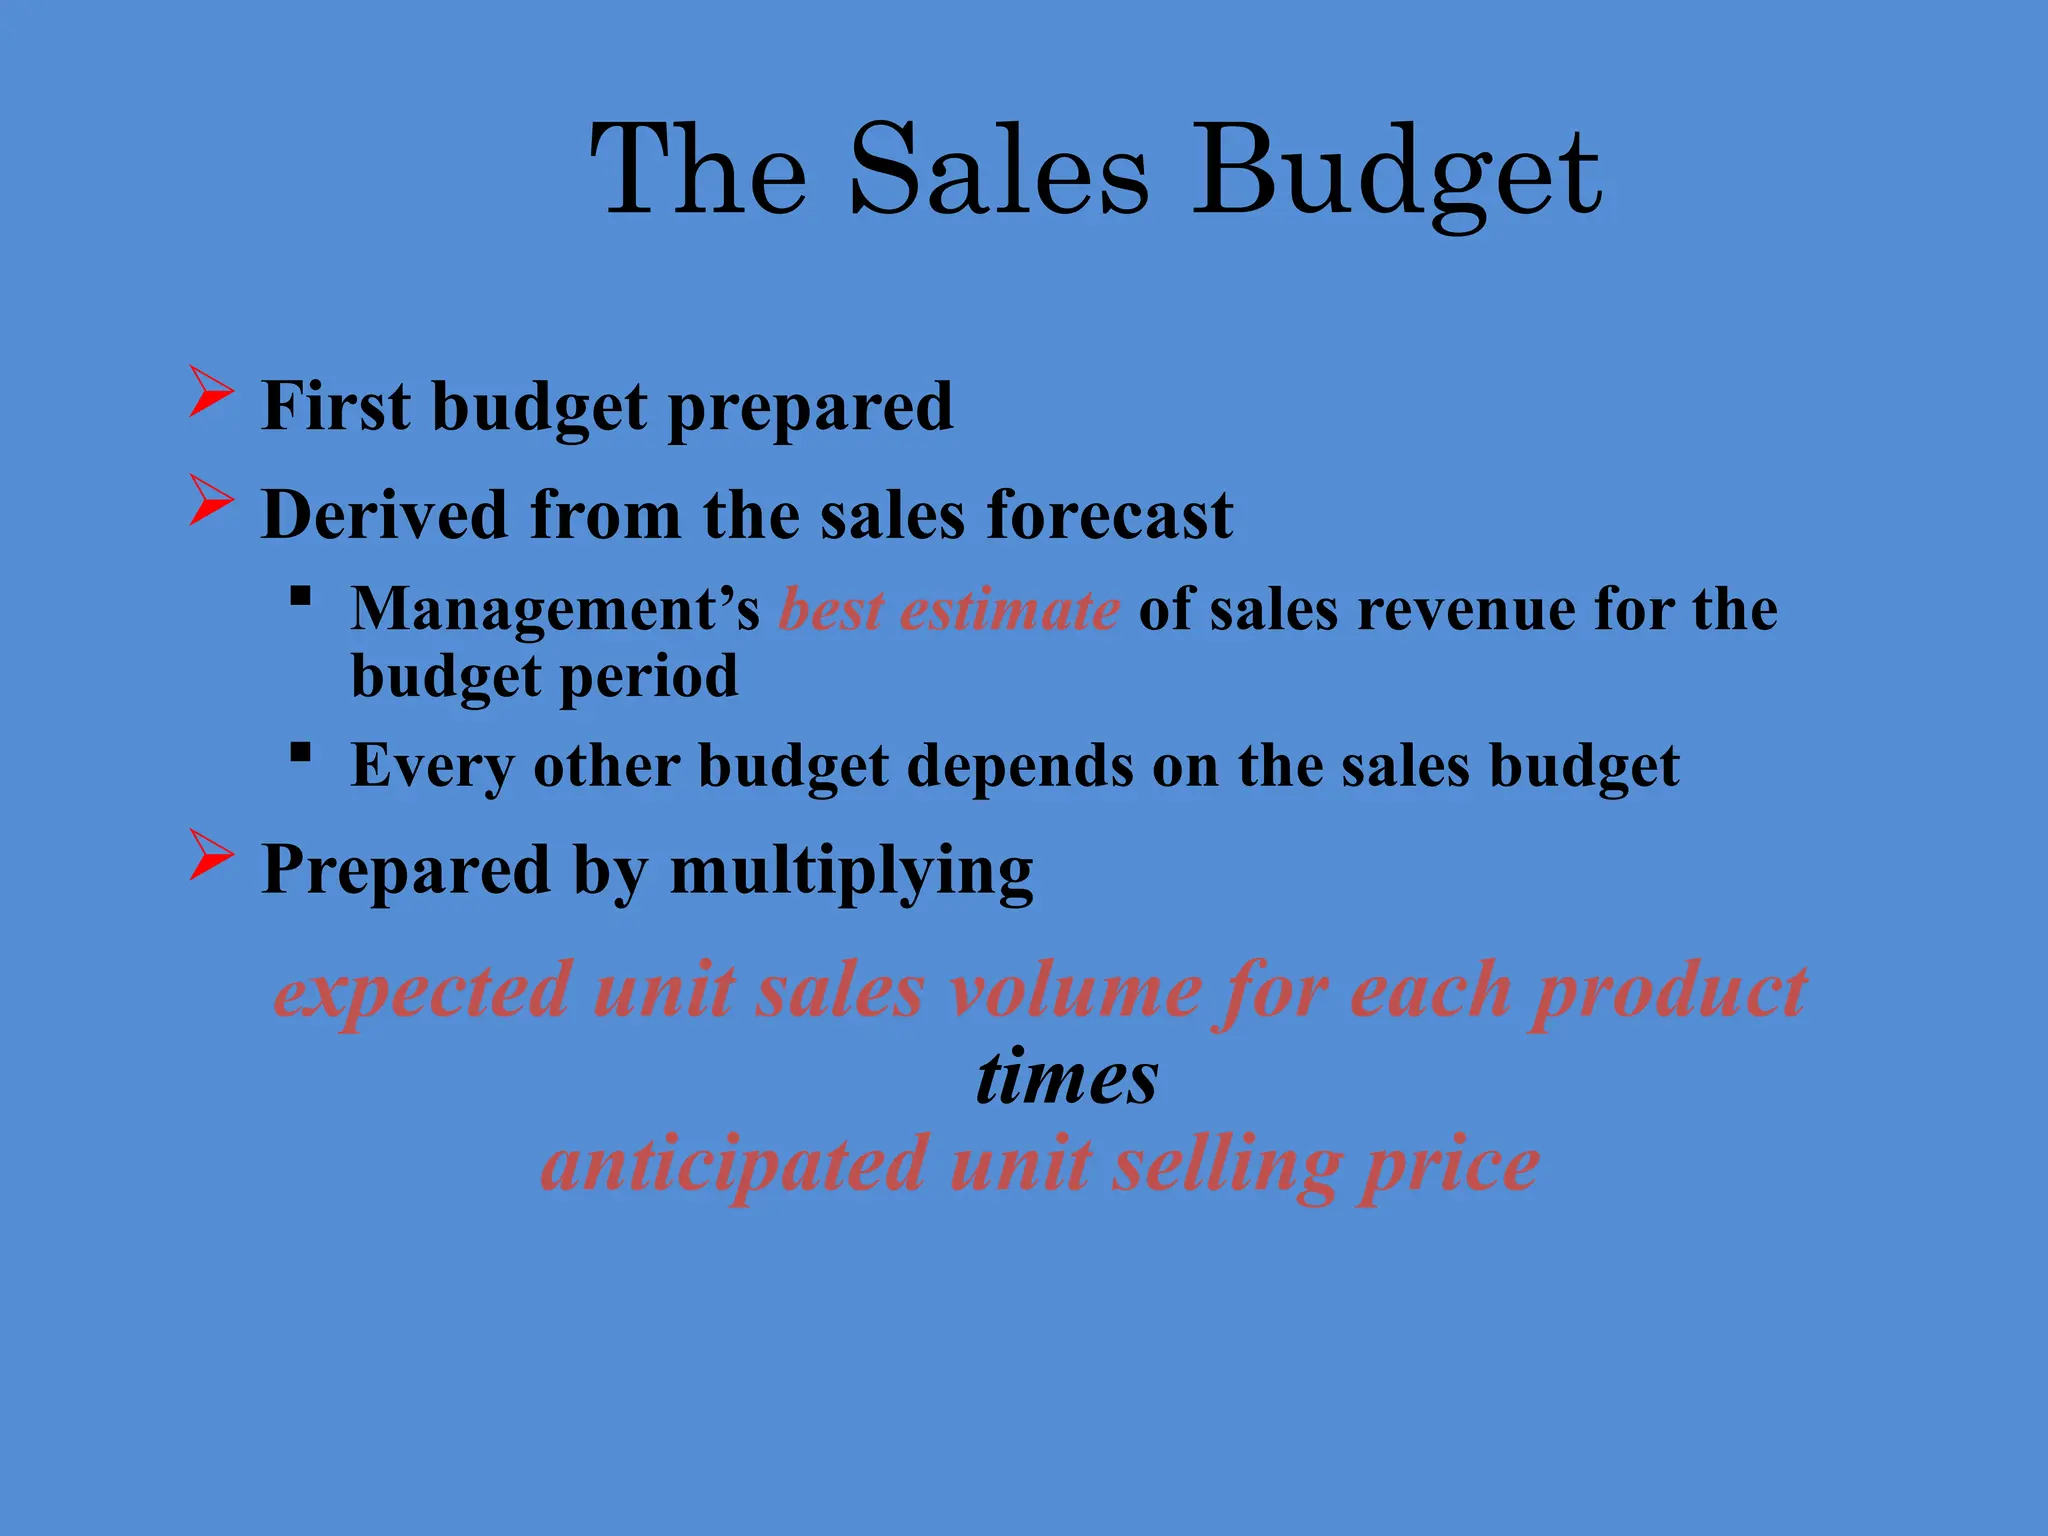
First budget prepared
Derived from the sales forecast
Management’s best estimate of sales revenue for the
budget period
Every other budget depends on the sales budget
Prepared by multiplying
expected unit sales volume for each product
times
anticipated unit selling price
18.
Factors considered inSales Forecasting:
General economic conditions
Industry trends
Market research studies
Anticipated advertising and promotion
Previous market share
Price changes
Technological developments
The Sales Budget
19.
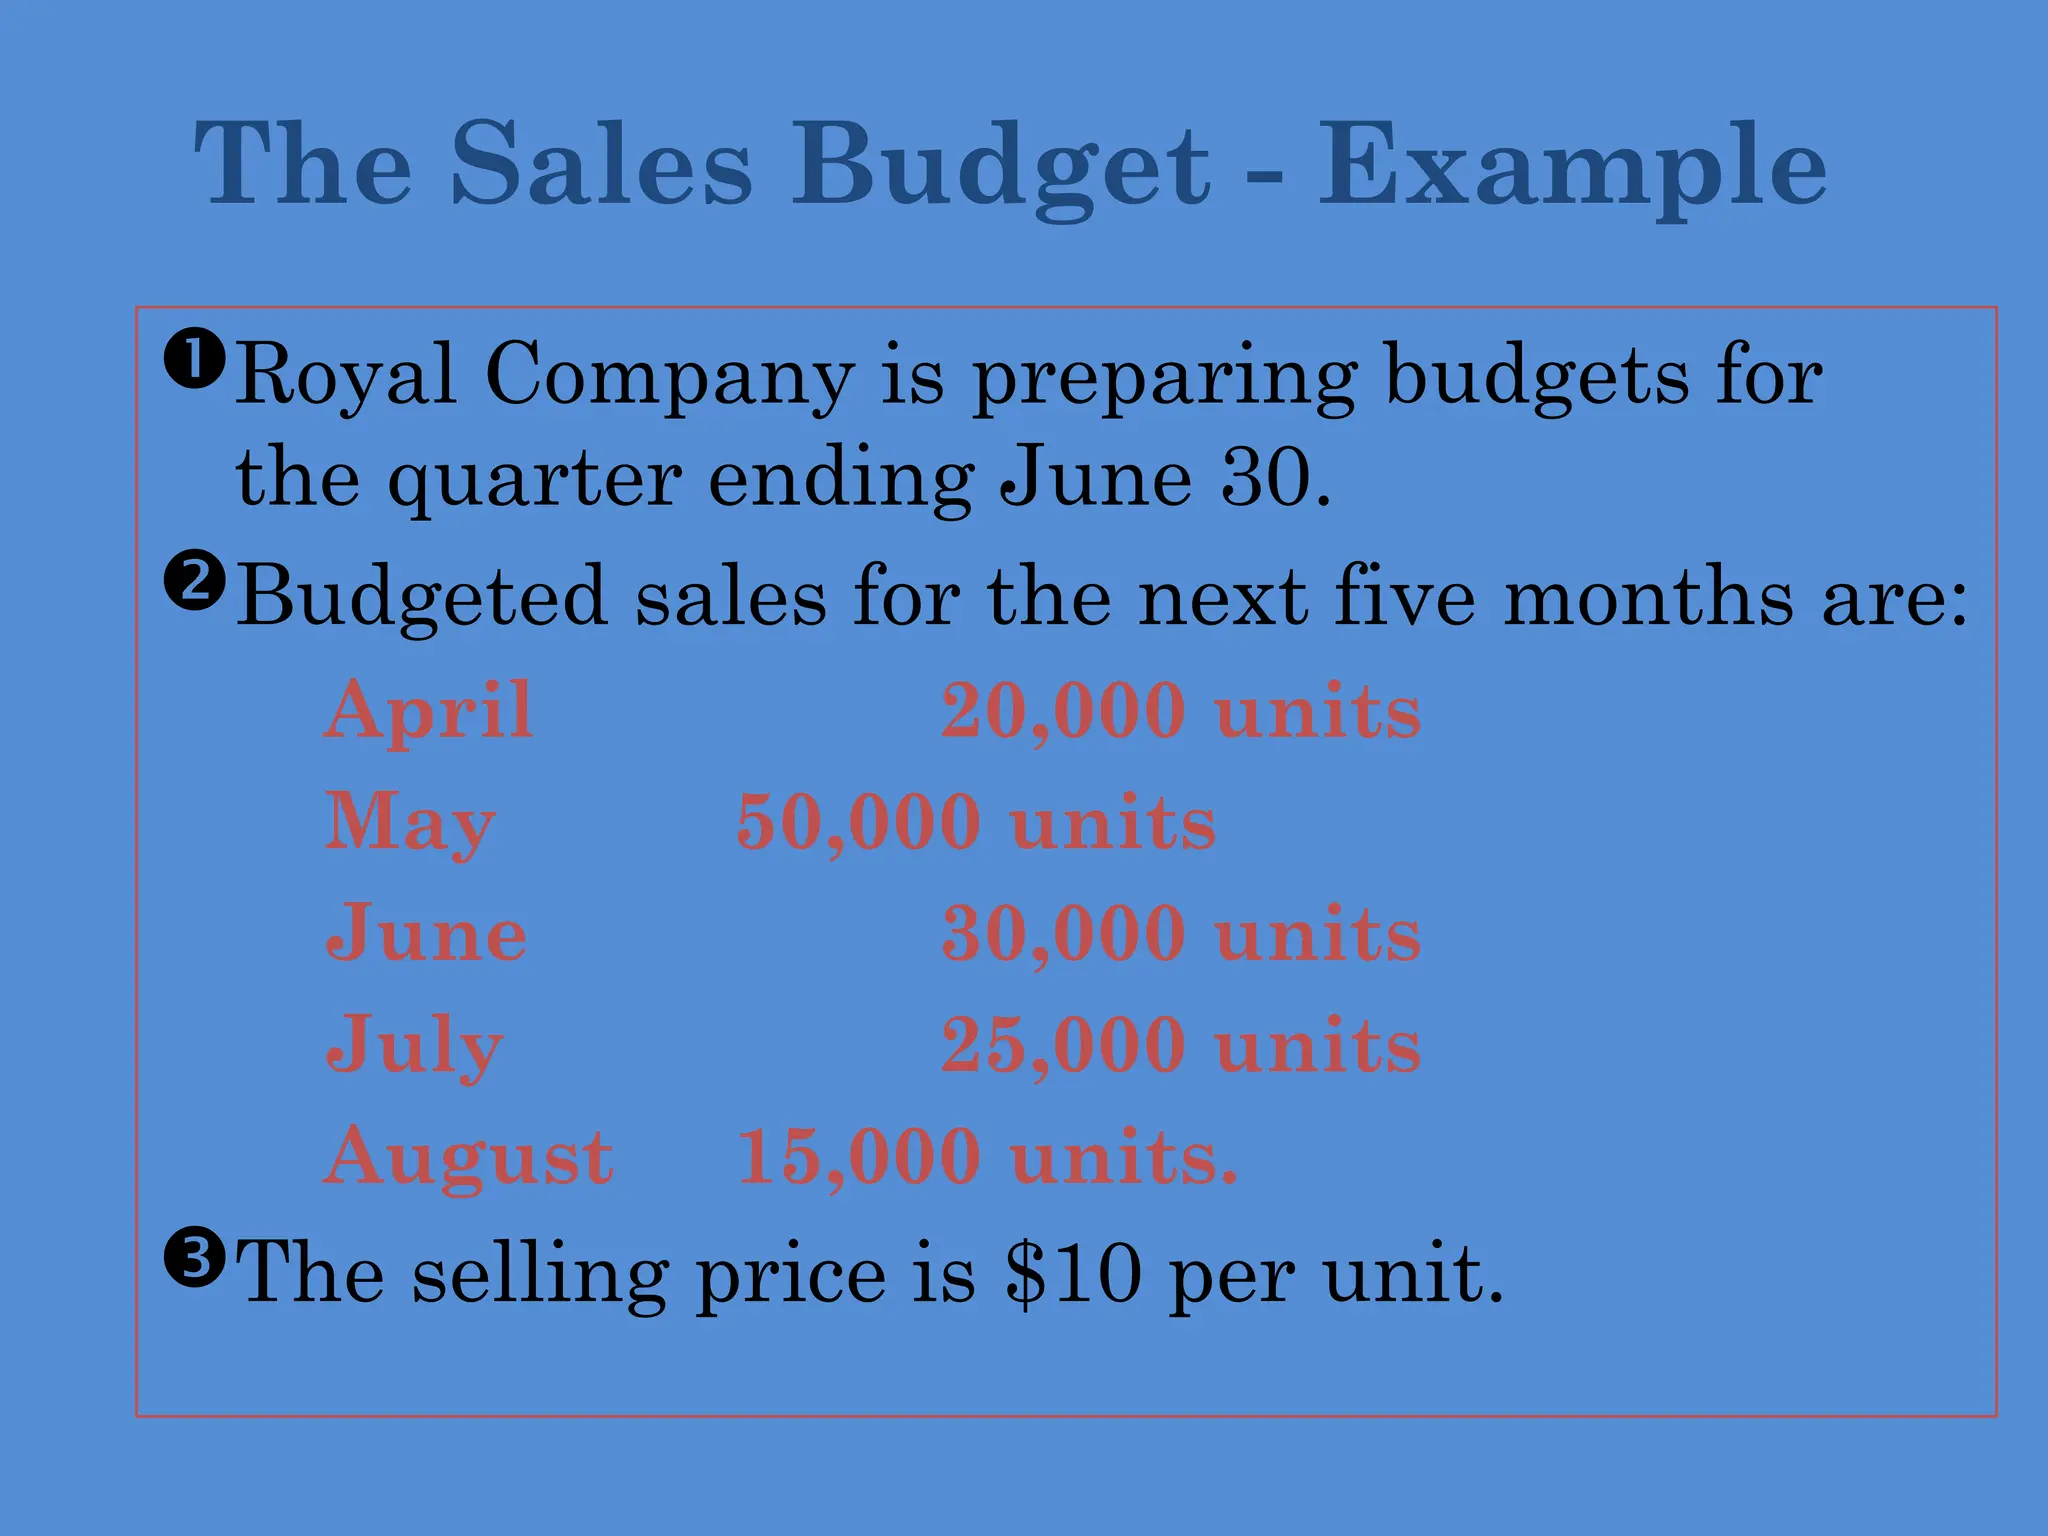
Royal Company ispreparing budgets for
the quarter ending June 30.
Budgeted sales for the next five months are:
April 20,000 units
May 50,000 units
June 30,000 units
July 25,000 units
August 15,000 units.
The selling price is $10 per unit.
The Sales Budget - Example
20.
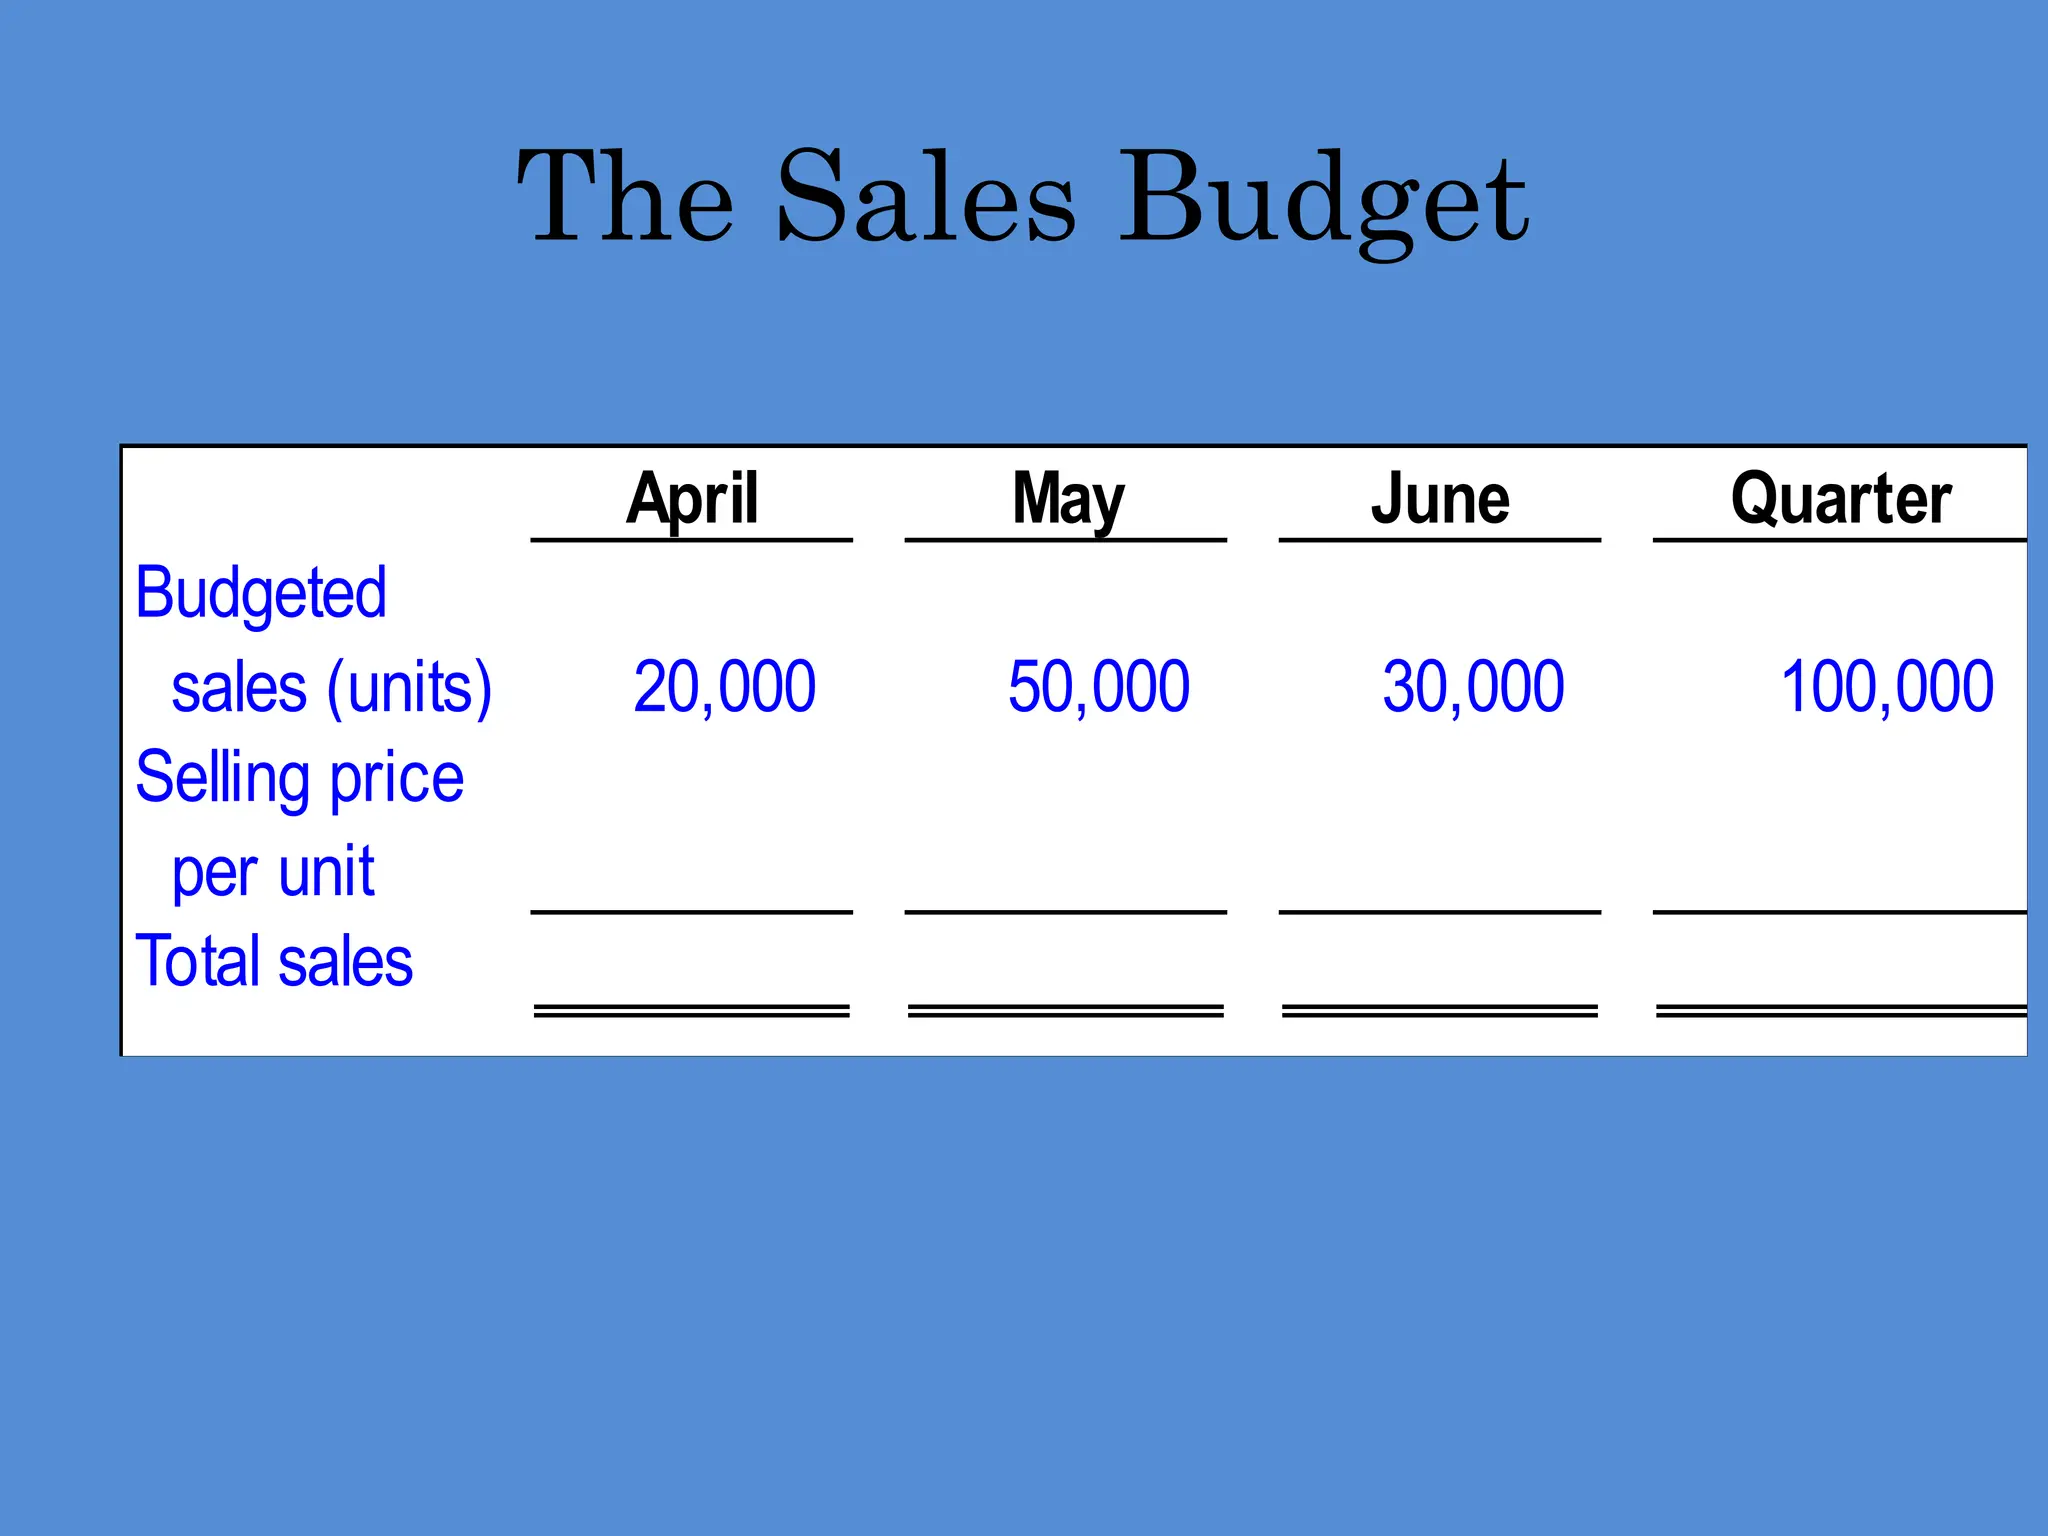
The Sales Budget
AprilMay June Quarter
Budgeted
sales (units) 20,000 50,000 30,000 100,000
Selling price
per unit
Total sales
21.
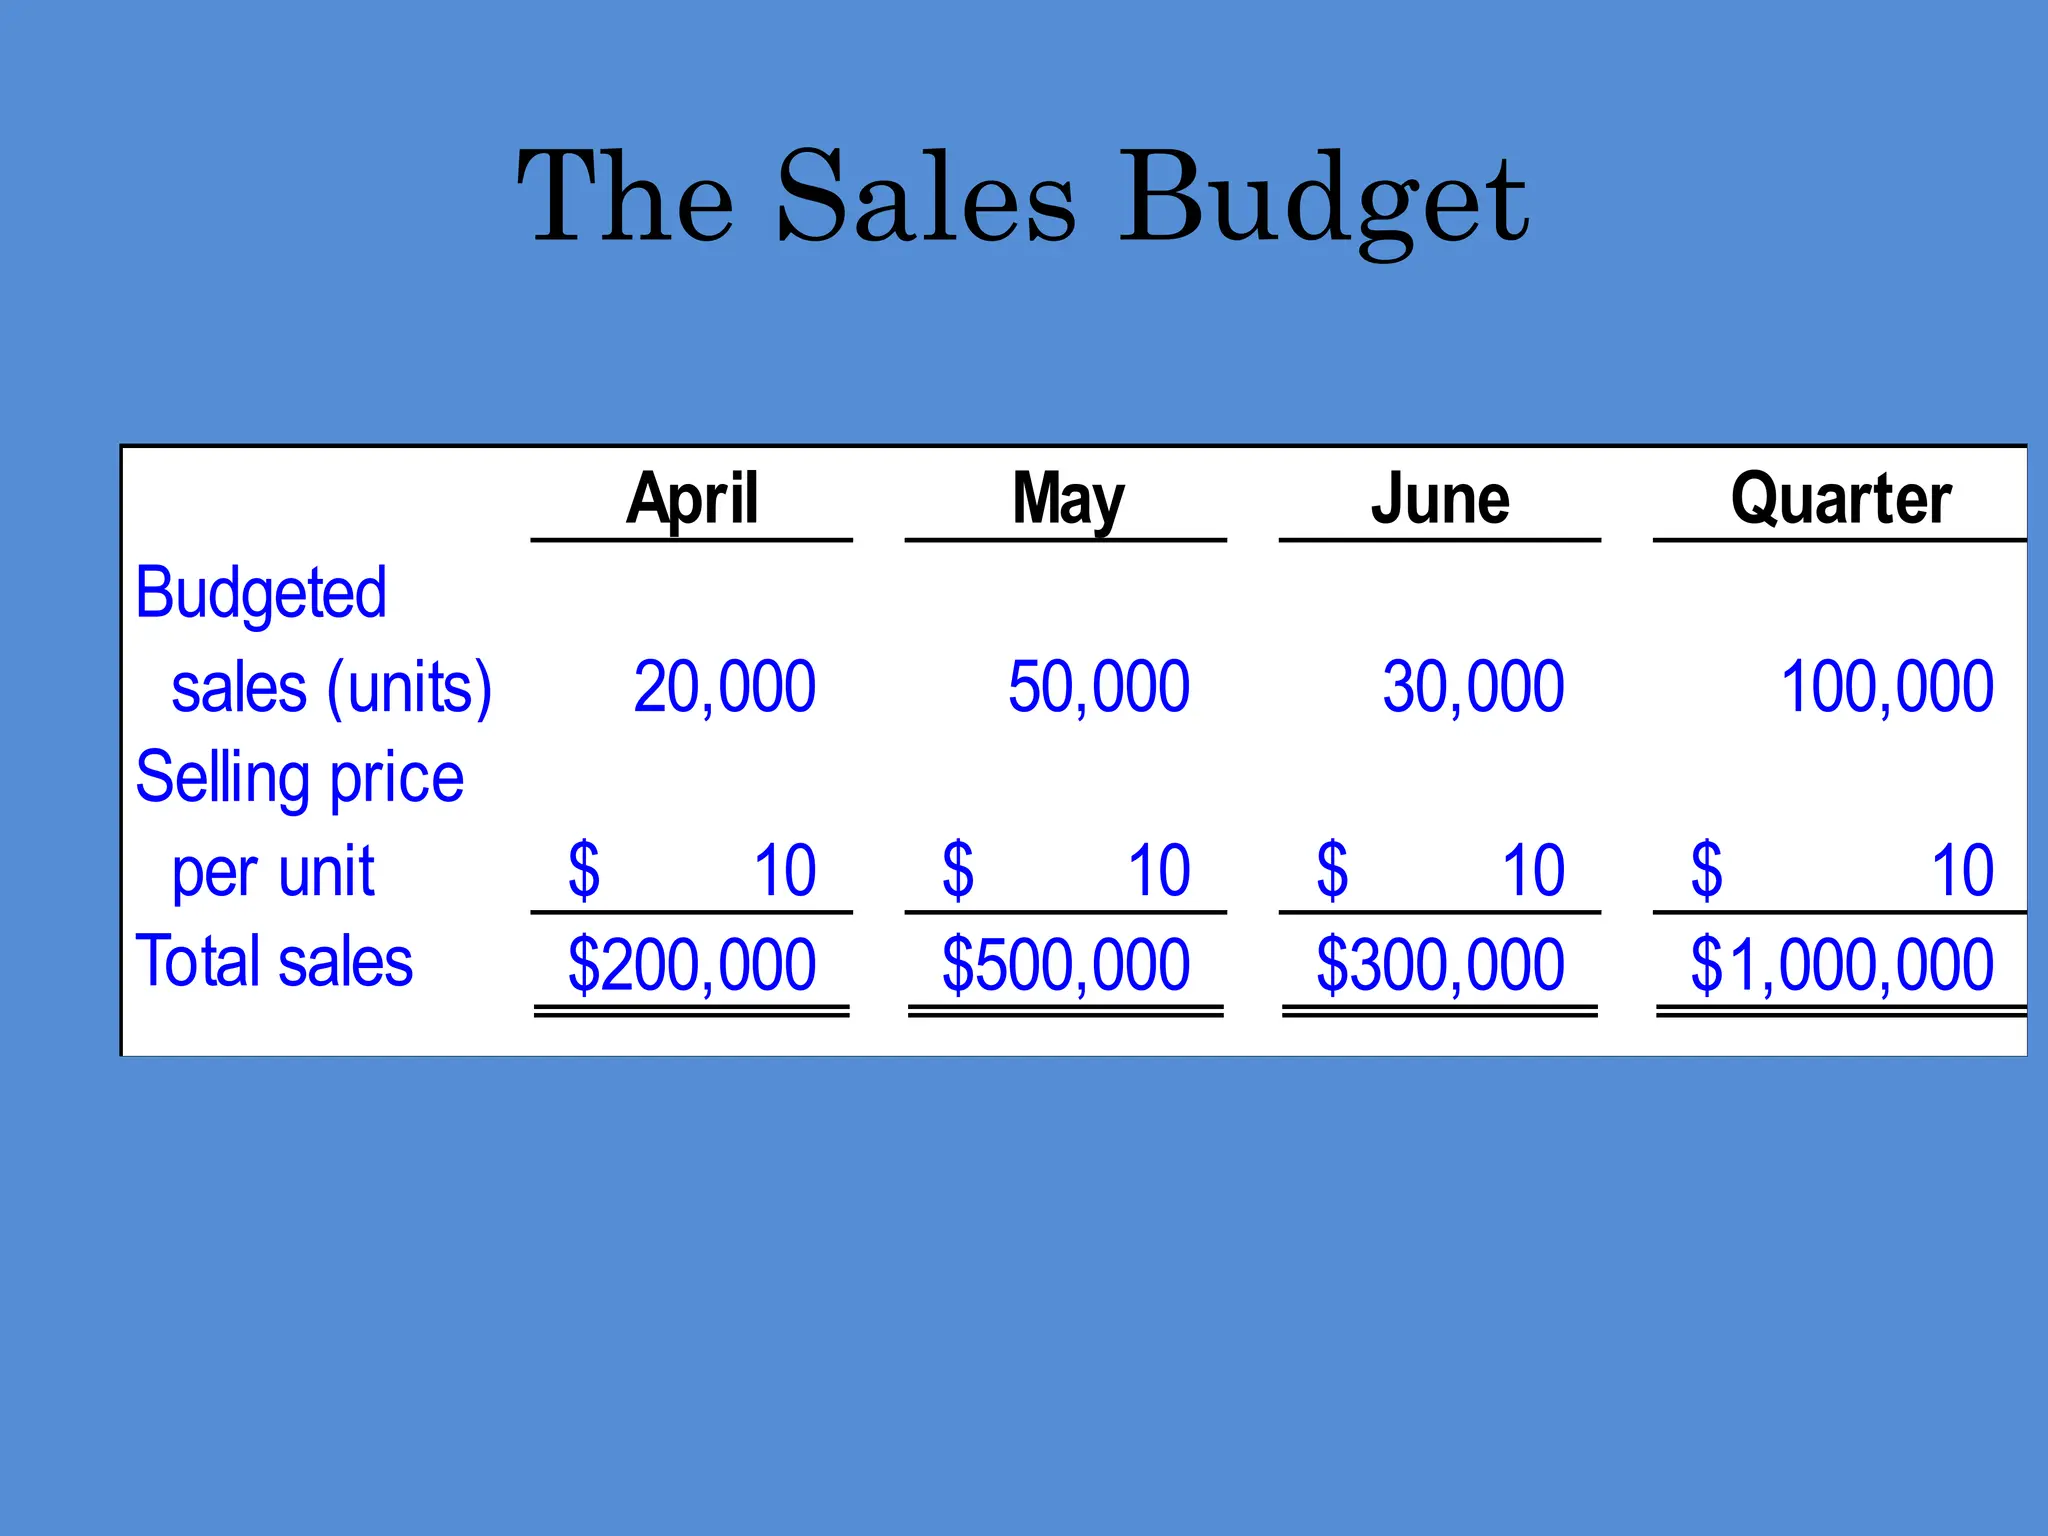
The Sales Budget
AprilMay June Quarter
Budgeted
sales (units) 20,000 50,000 30,000 100,000
Selling price
per unit 10
$ 10
$ 10
$ 10
$
Total sales 200,000
$ 500,000
$ 300,000
$ 1,000,000
$
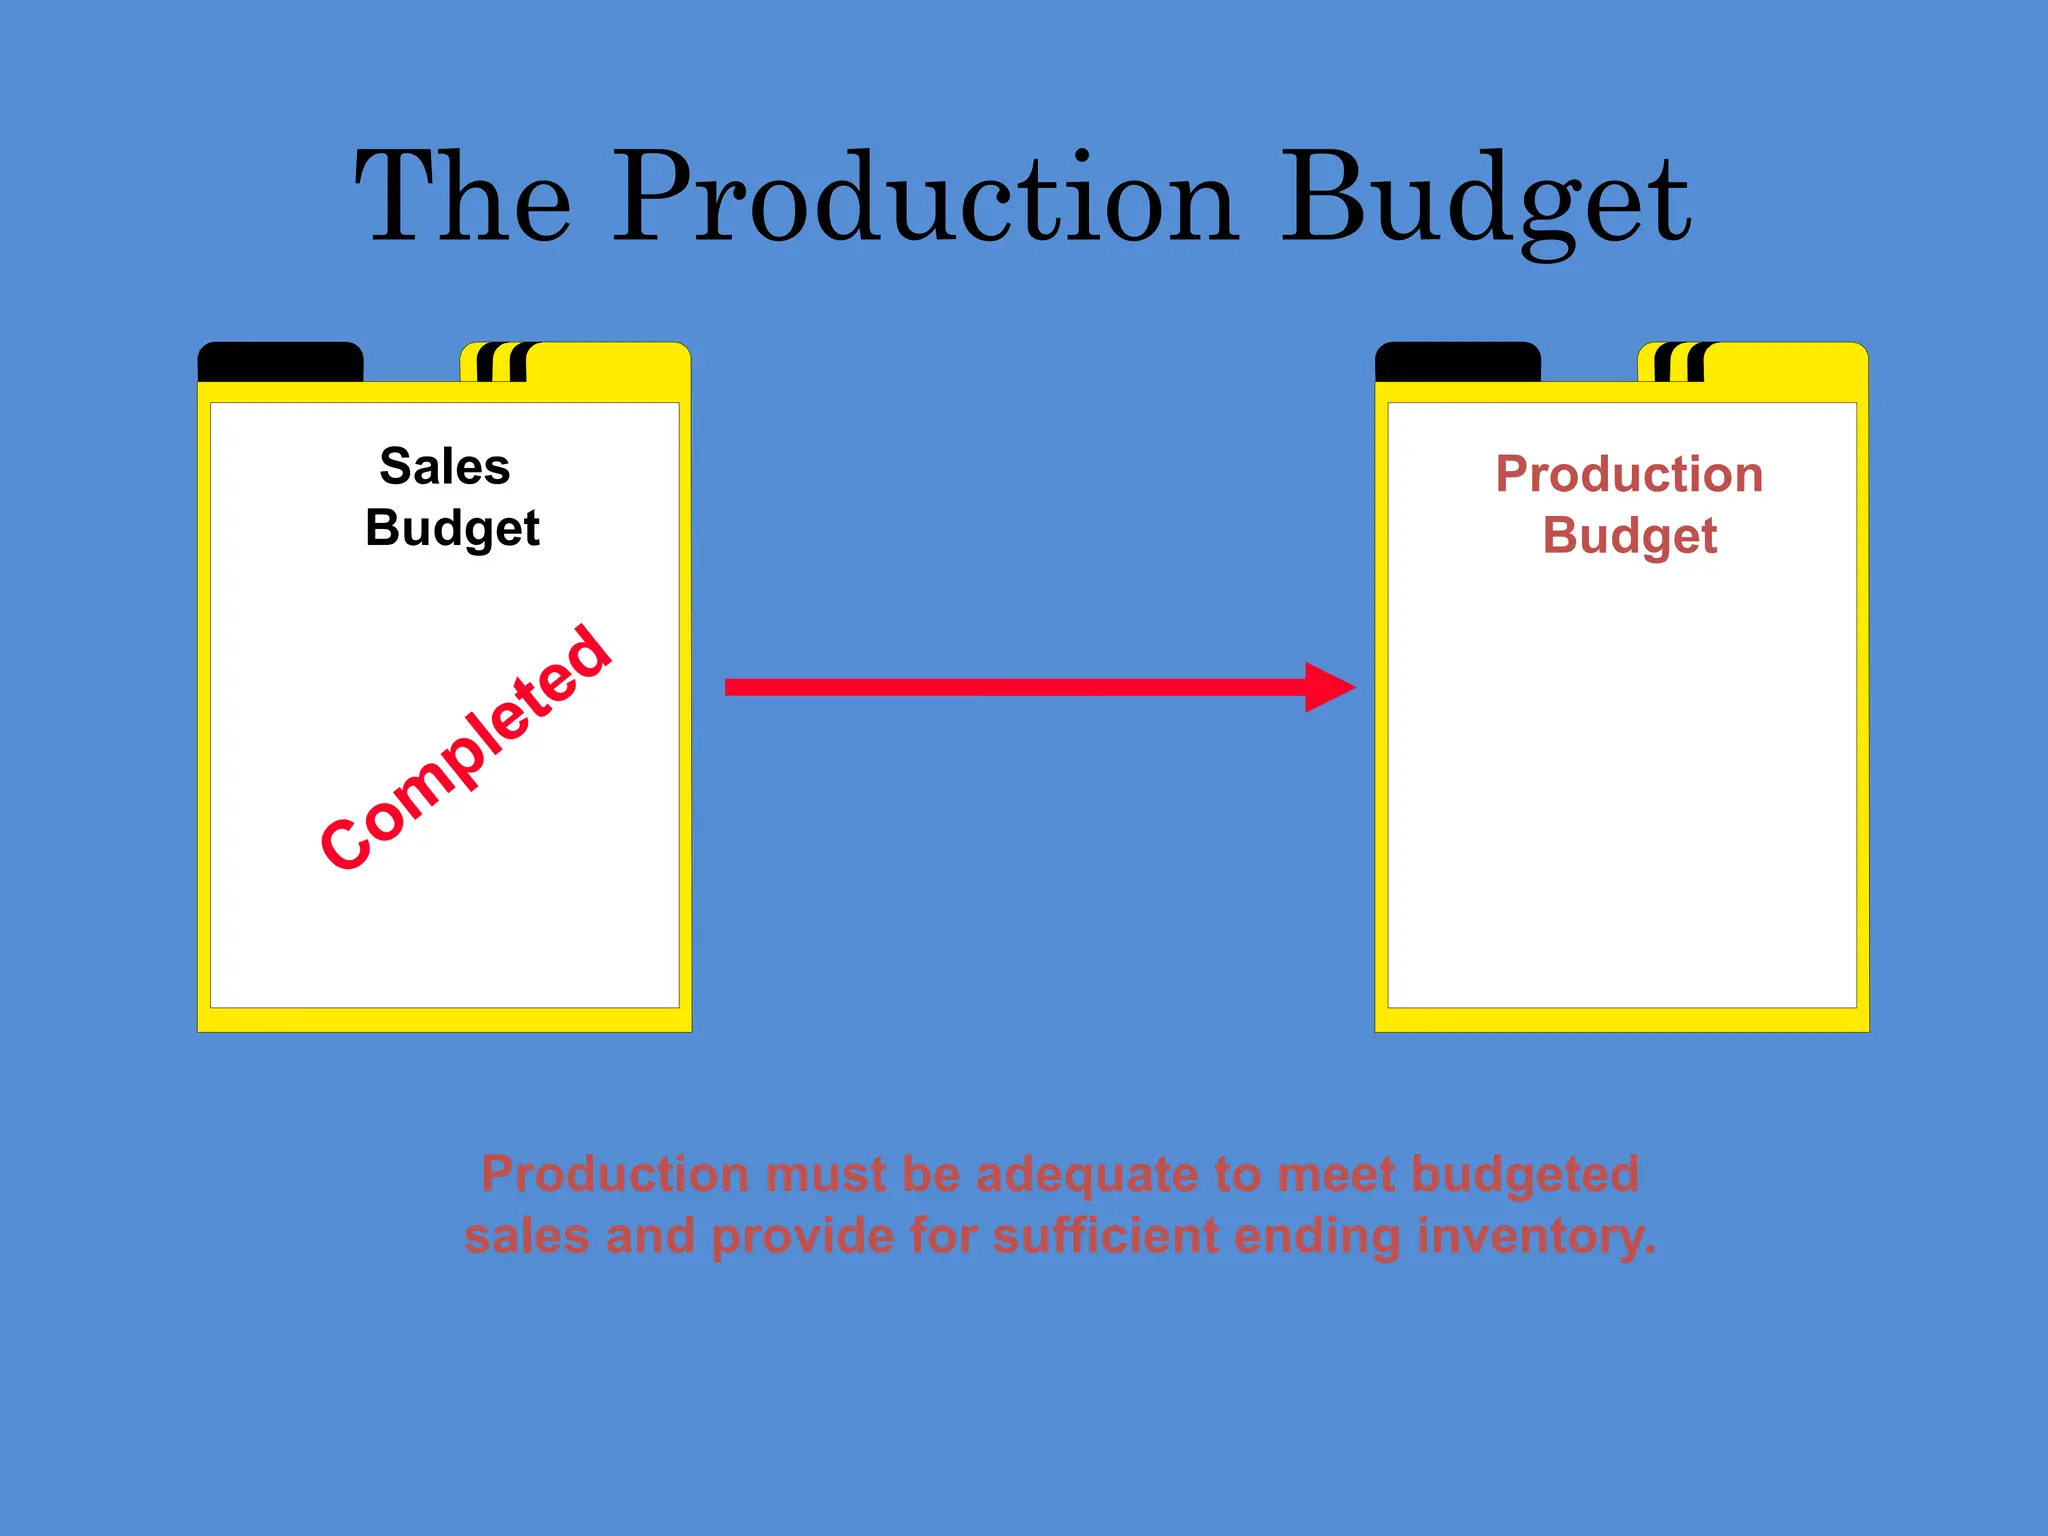
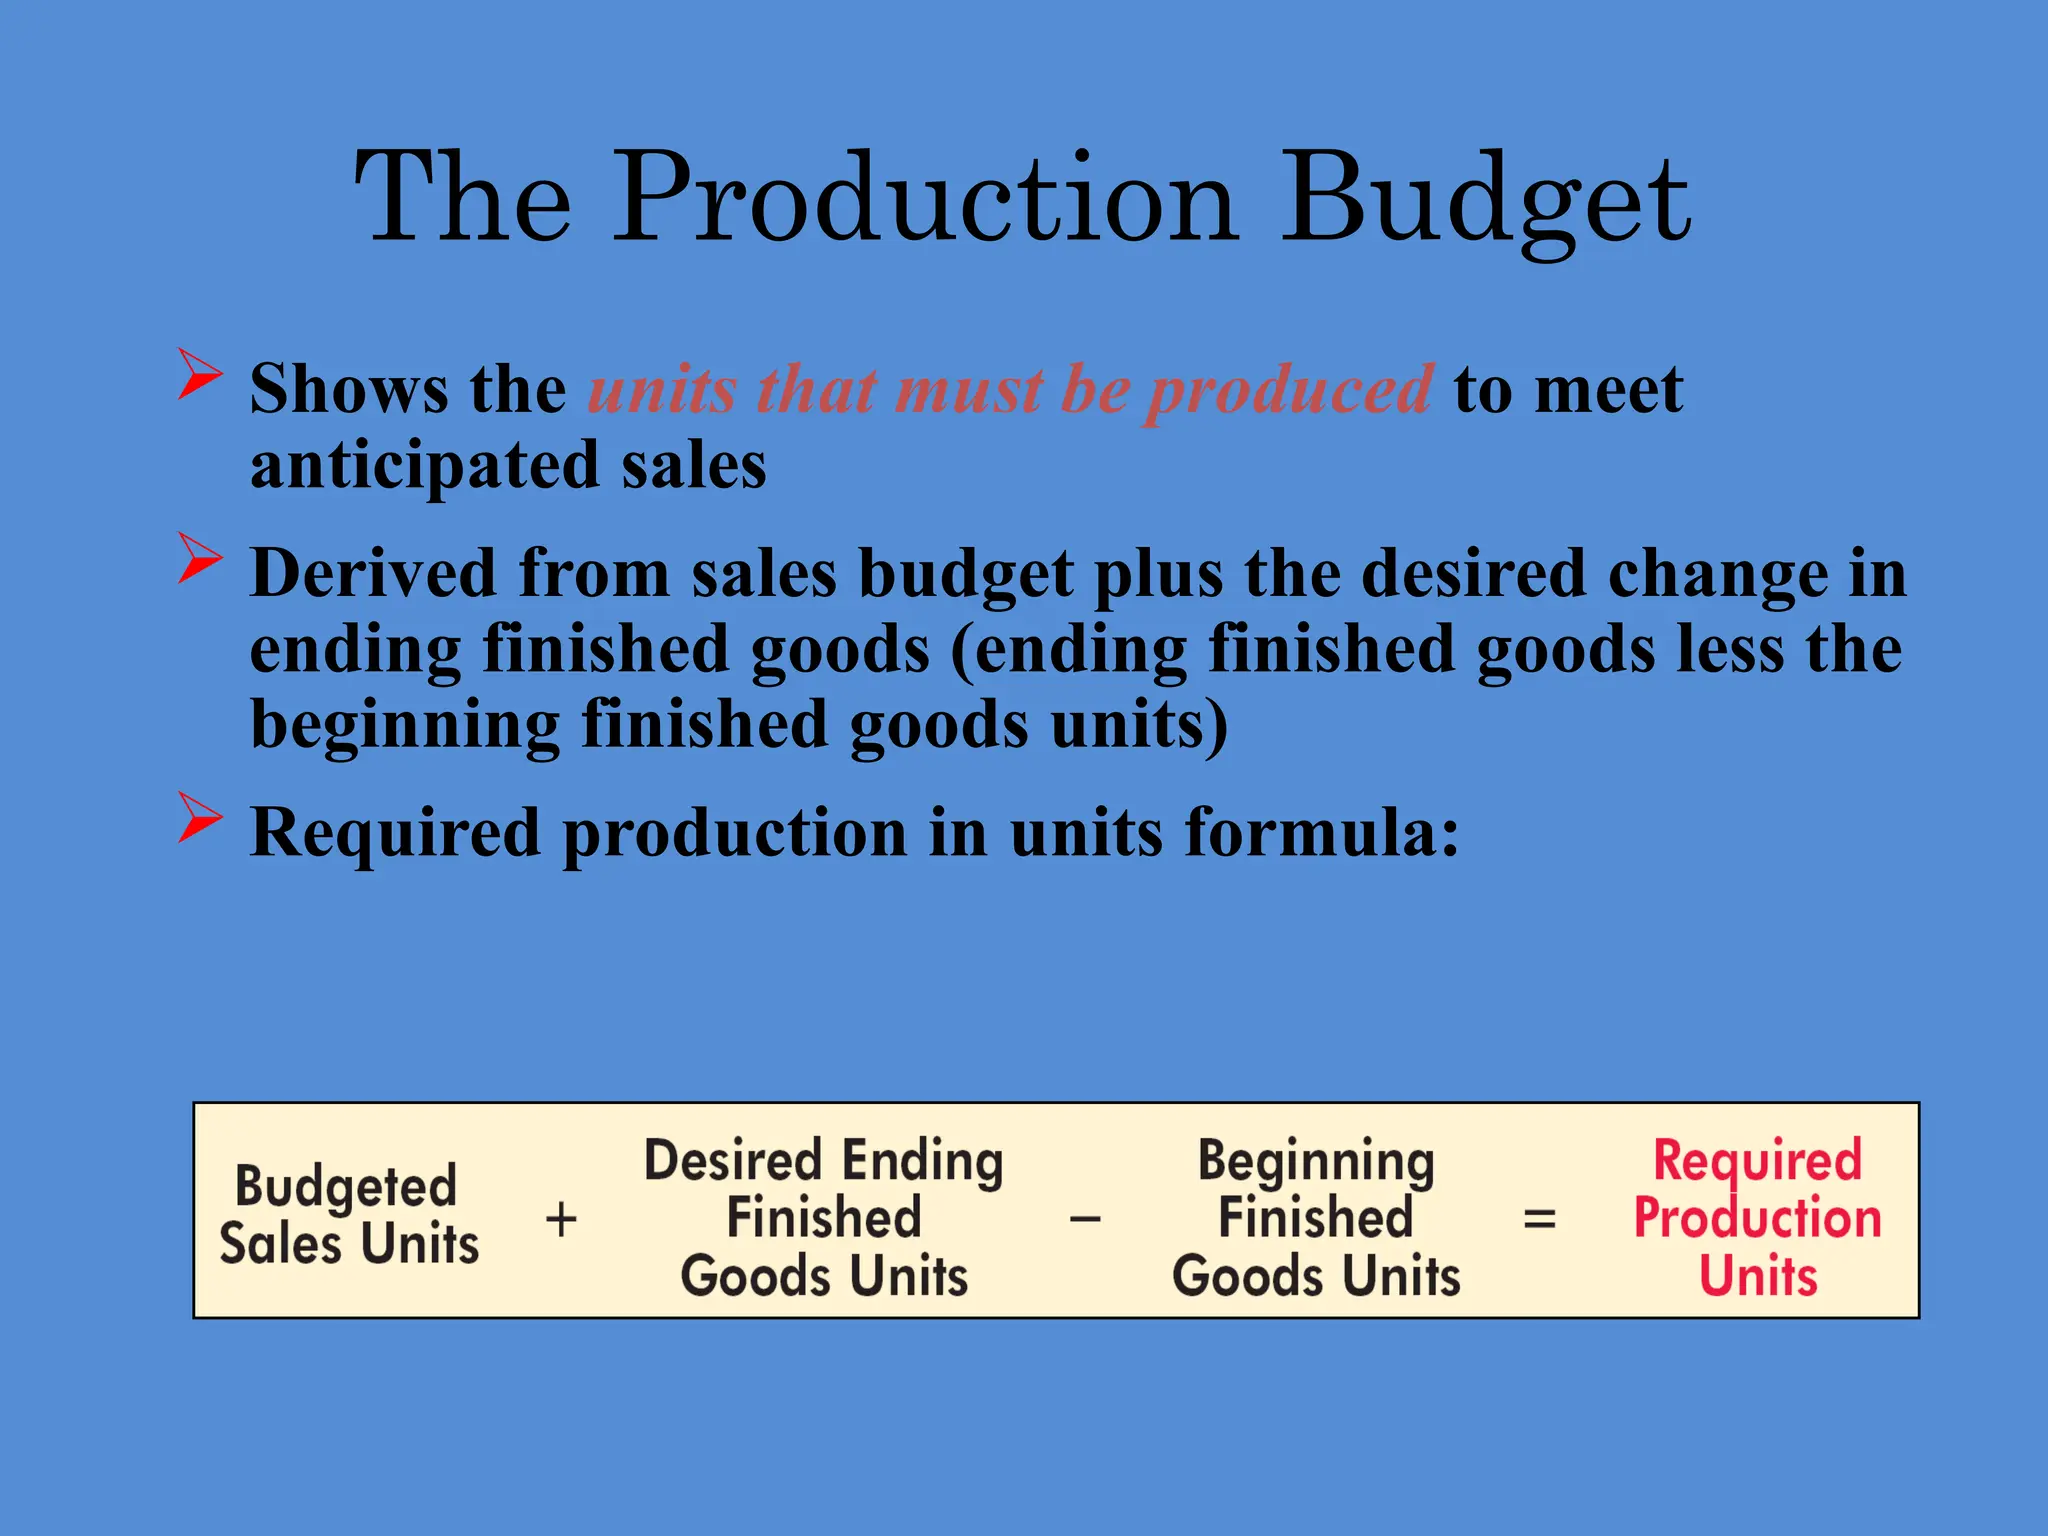
Shows theunits that must be produced to meet
anticipated sales
Derived from sales budget plus the desired change in
ending finished goods (ending finished goods less the
beginning finished goods units)
Required production in units formula:
The Production Budget
24.
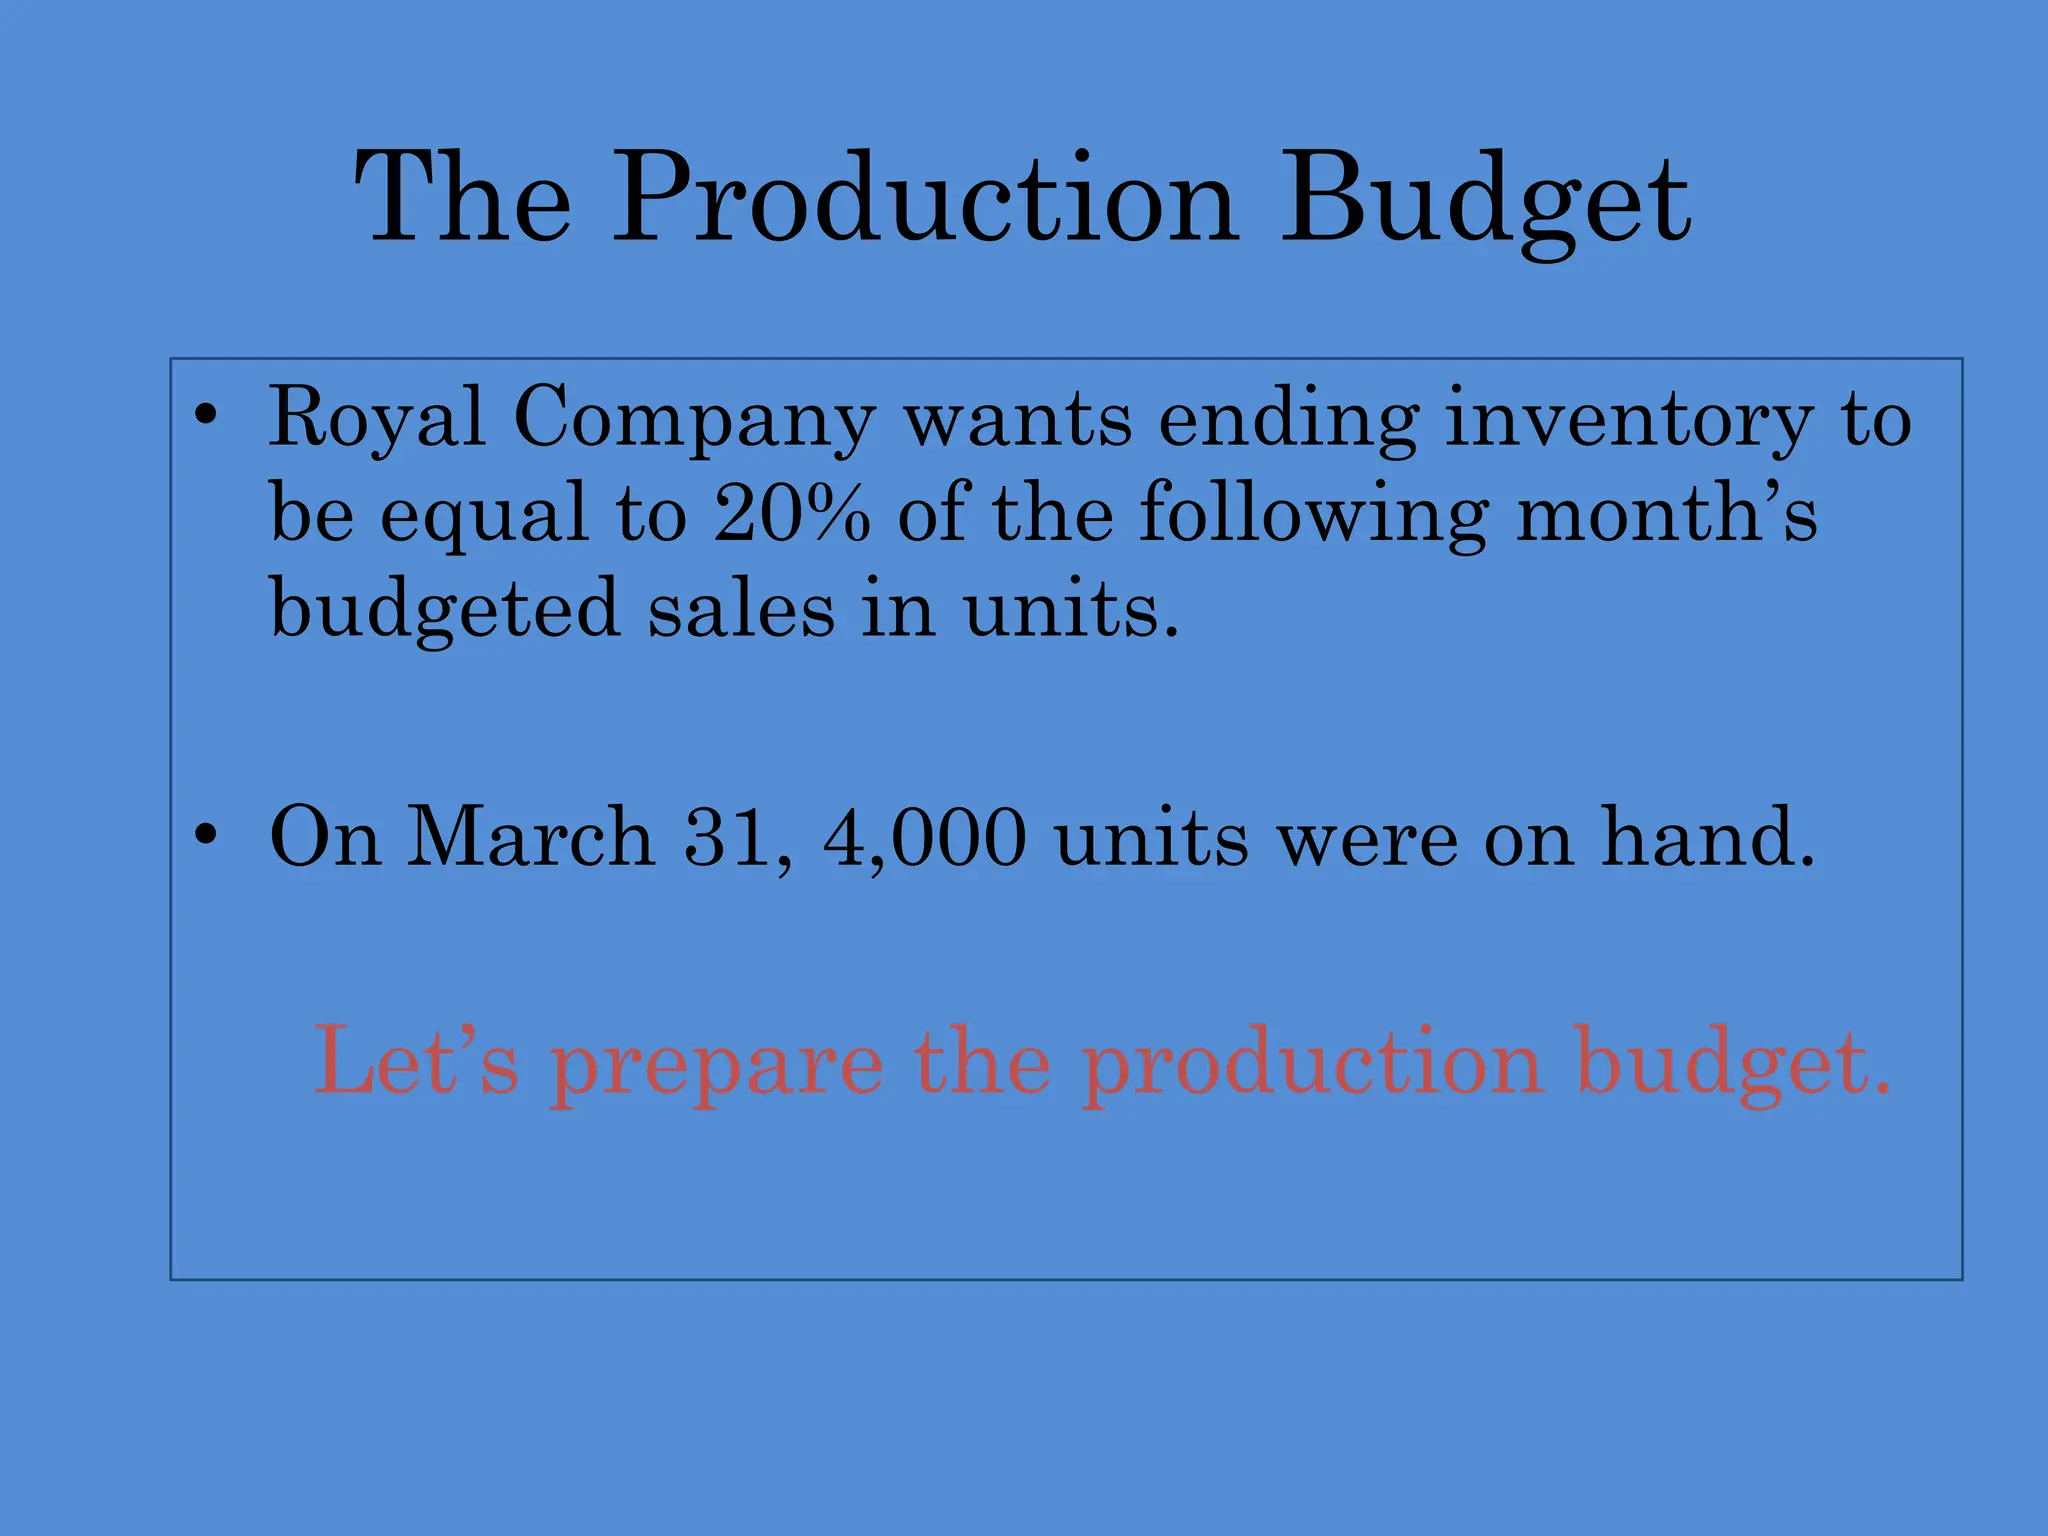
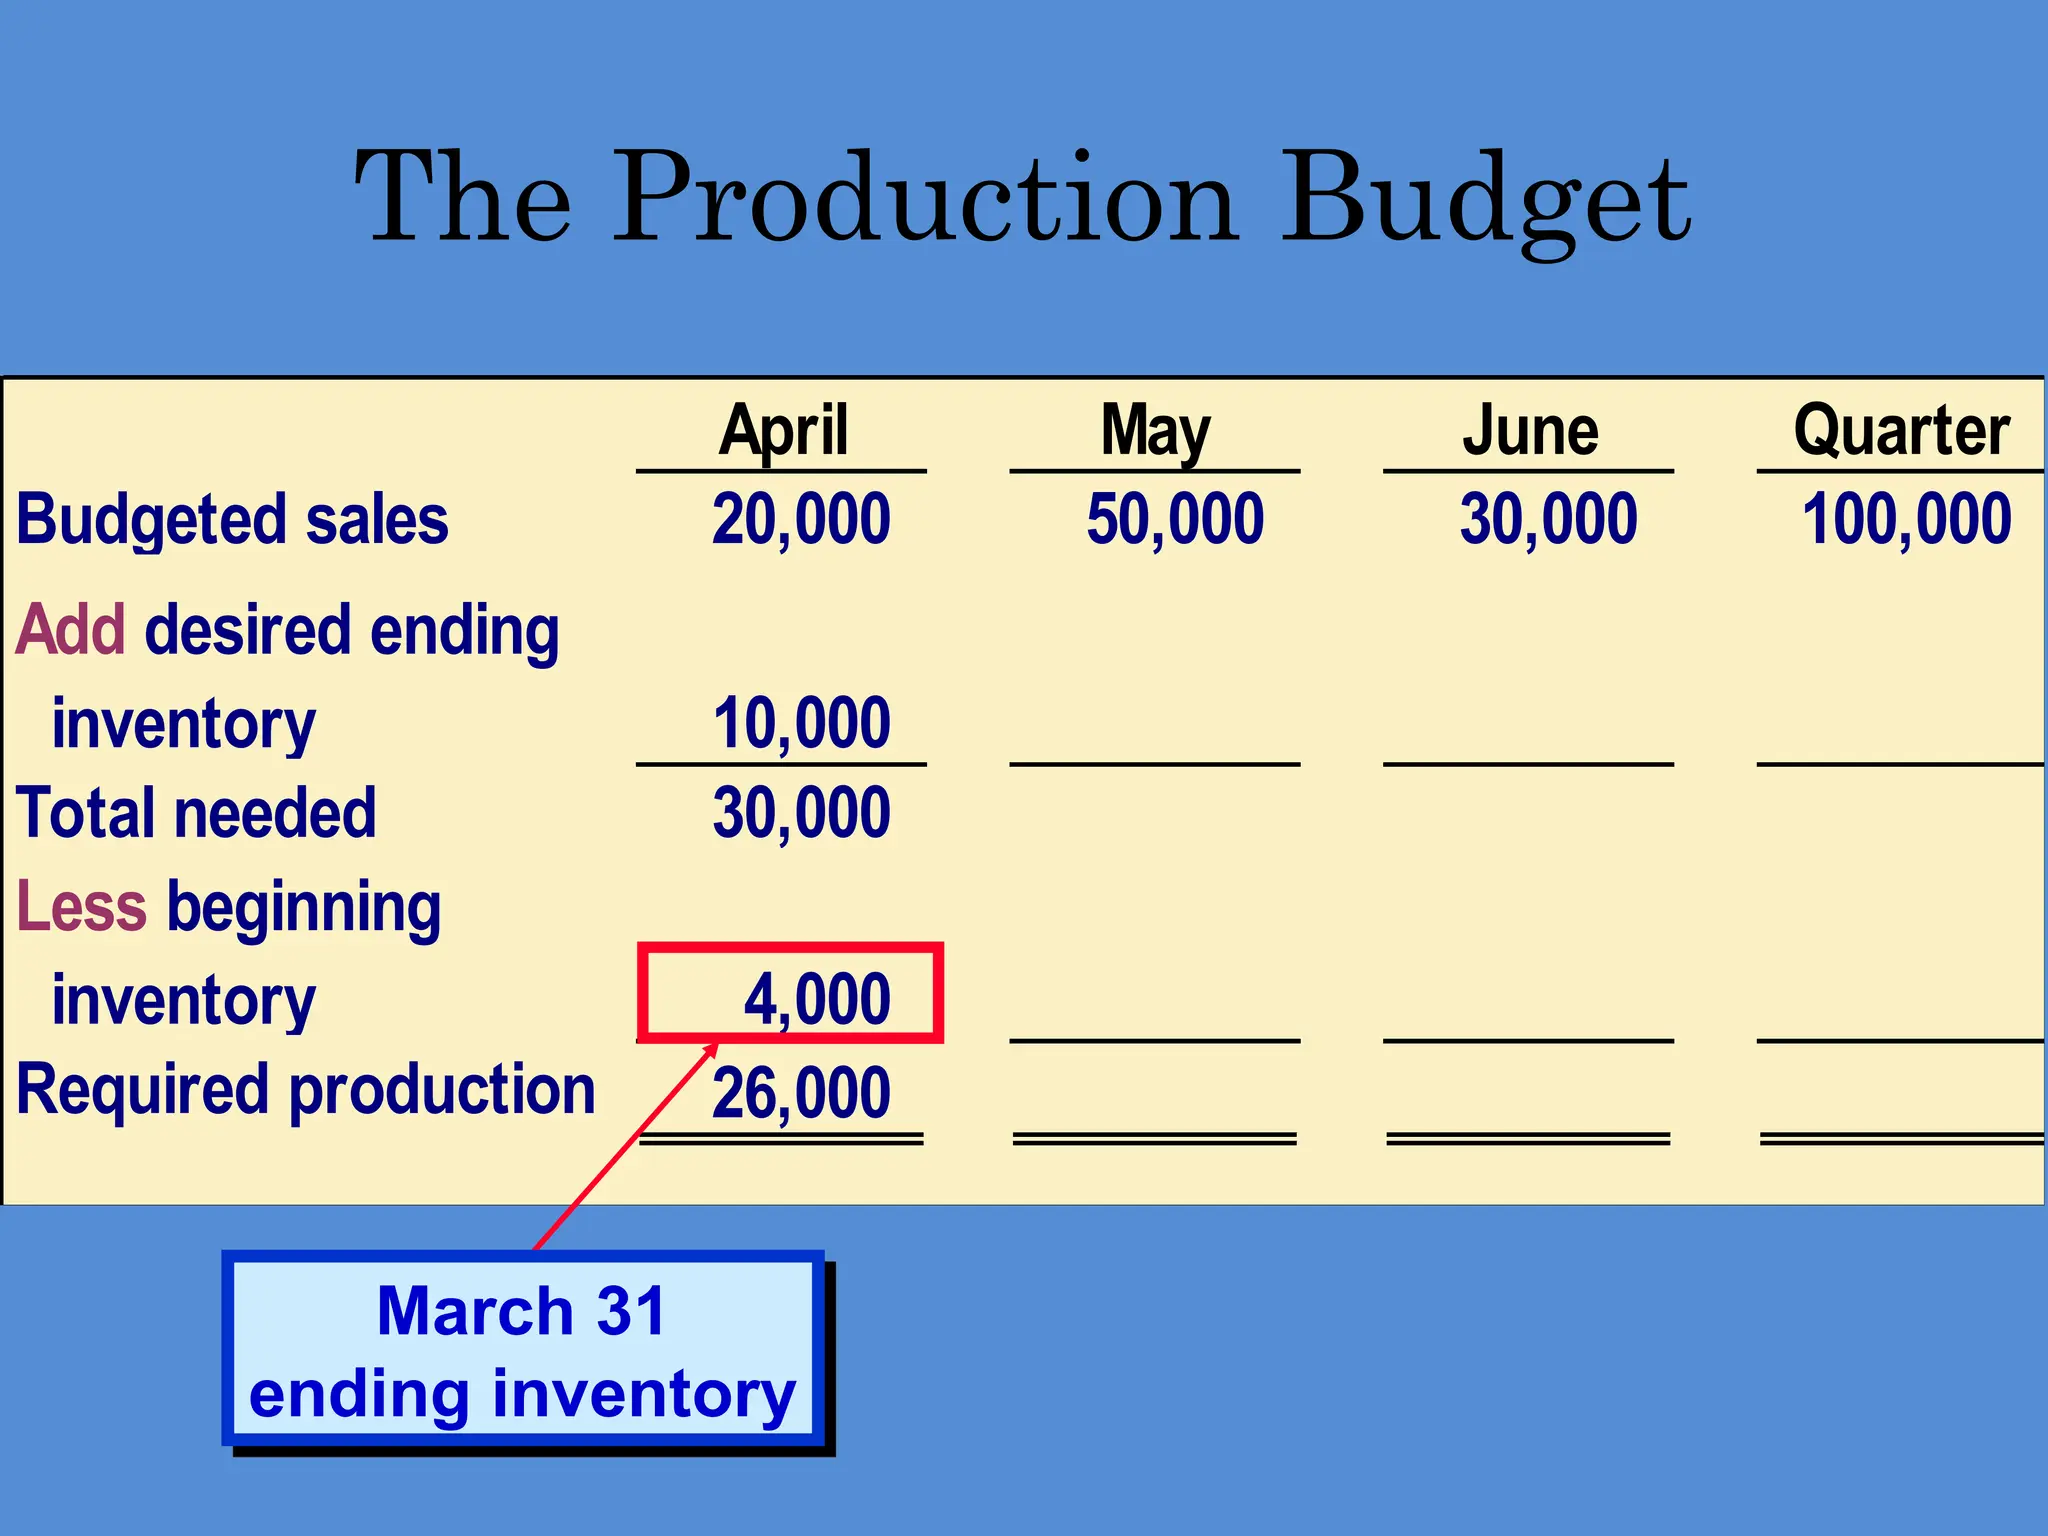
The Production Budget
•Royal Company wants ending inventory to
be equal to 20% of the following month’s
budgeted sales in units.
• On March 31, 4,000 units were on hand.
Let’s prepare the production budget.
25.
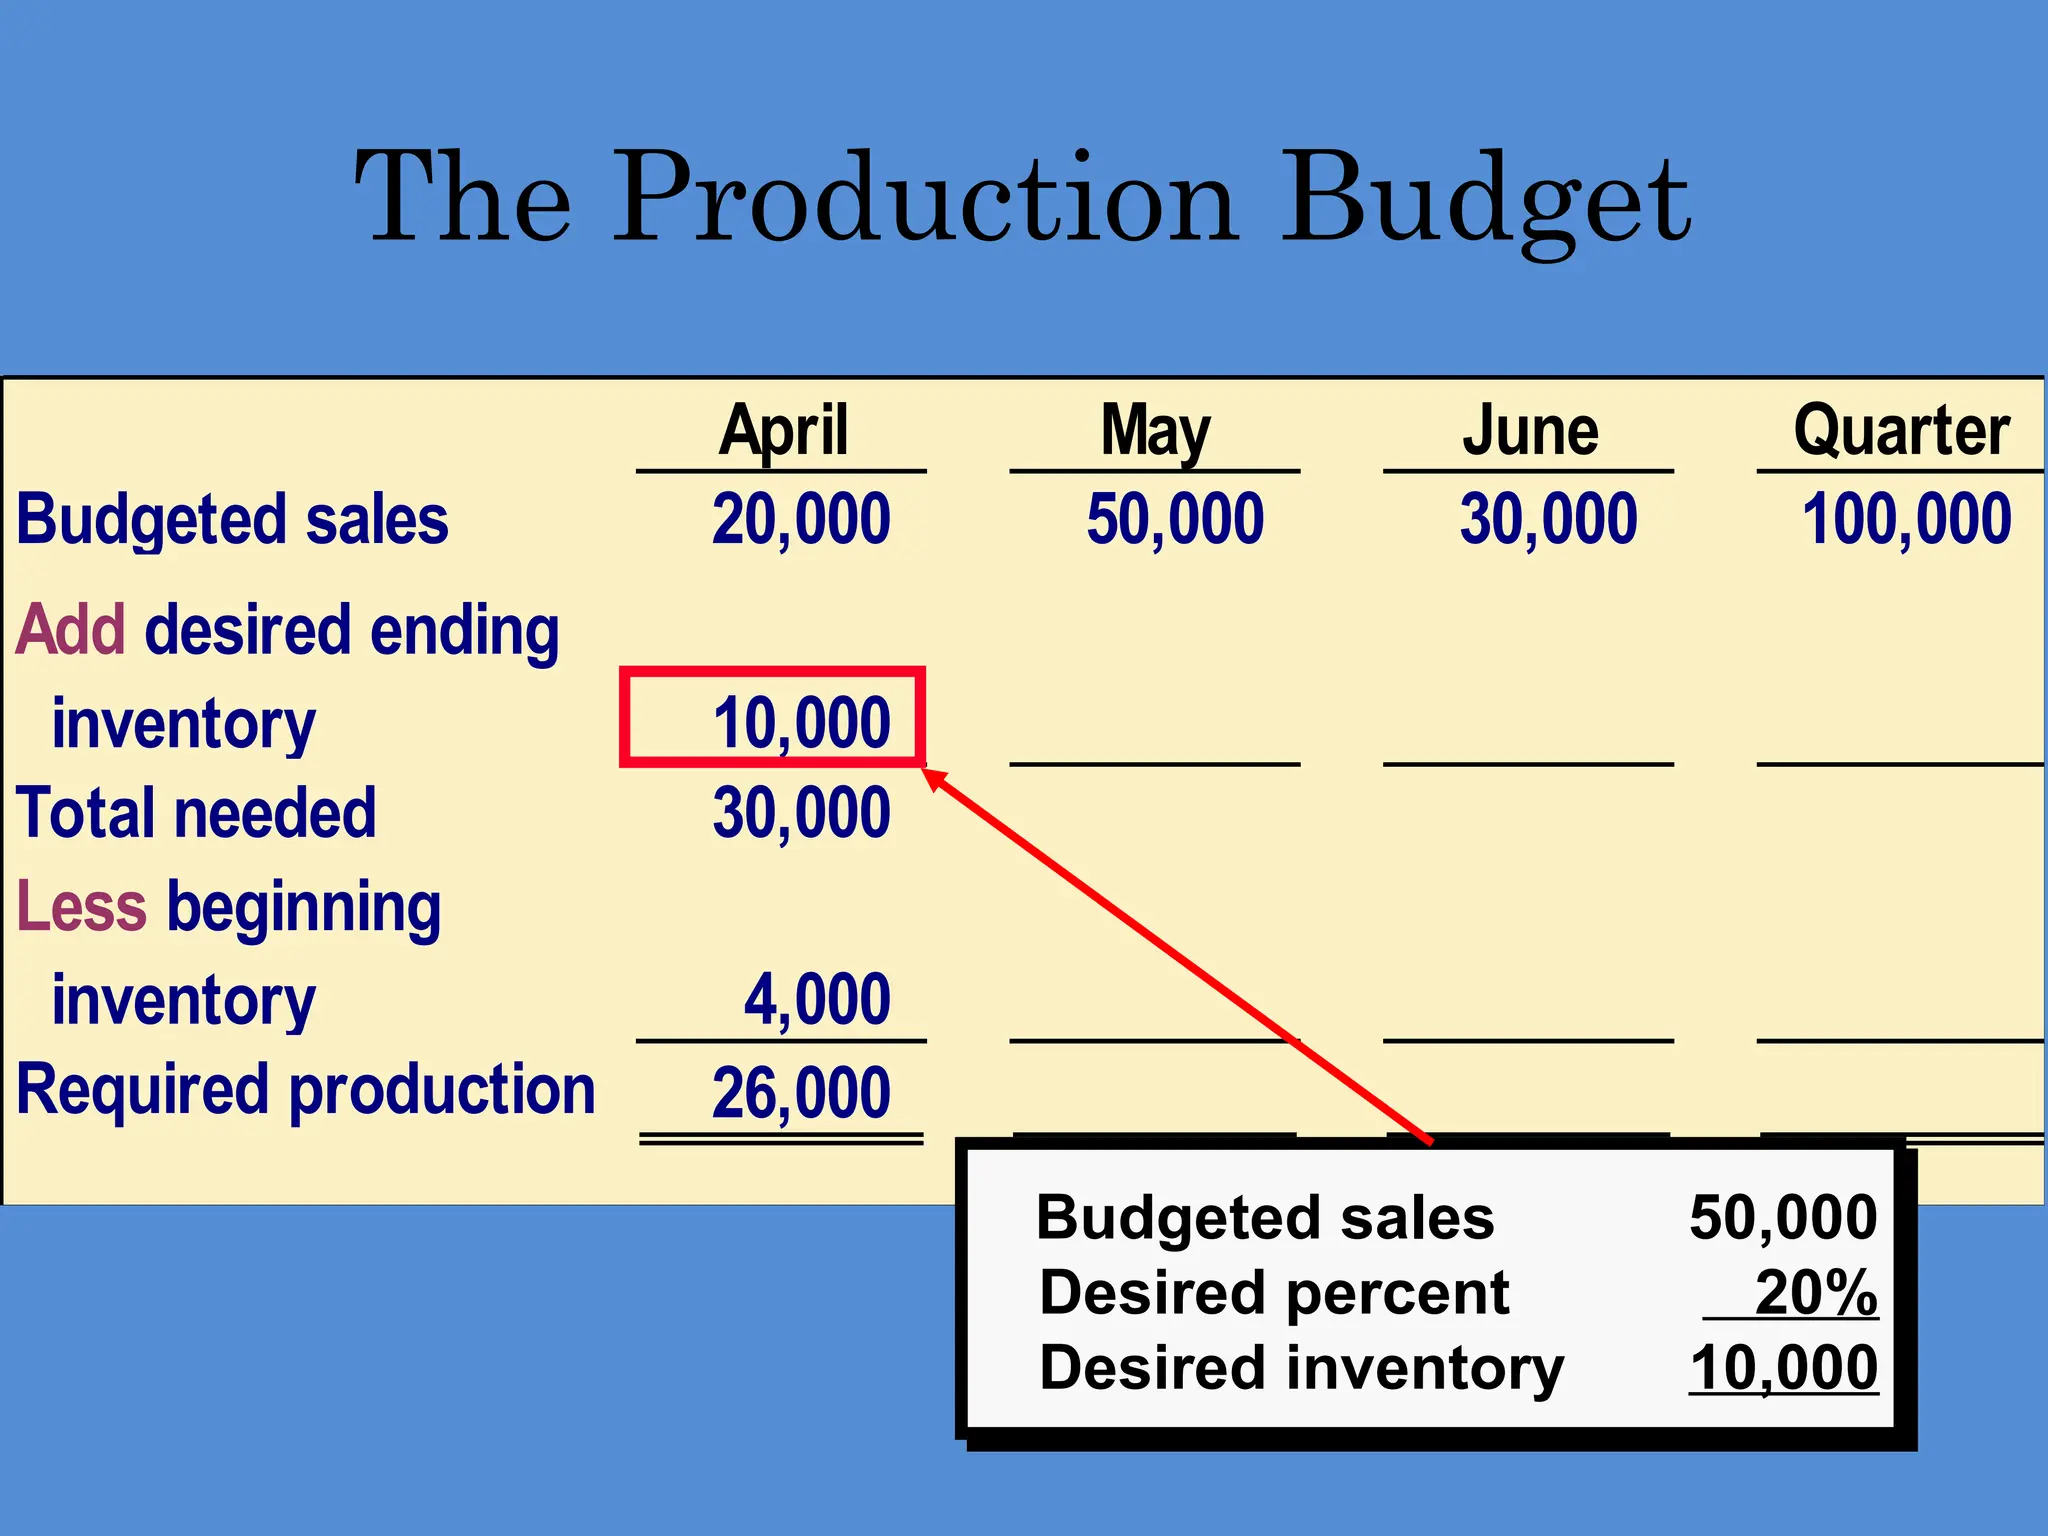
April May JuneQuarter
Budgeted sales 20,000 50,000 30,000 100,000
Add desired ending
inventory 10,000
Total needed 30,000
Less beginning
inventory 4,000
Required production 26,000
The Production Budget
Budgeted sales 50,000
Desired percent 20%
Desired inventory 10,000
26.
April May JuneQuarter
Budgeted sales 20,000 50,000 30,000 100,000
Add desired ending
inventory 10,000
Total needed 30,000
Less beginning
inventory 4,000
Required production 26,000
The Production Budget
March 31
ending inventory
27.
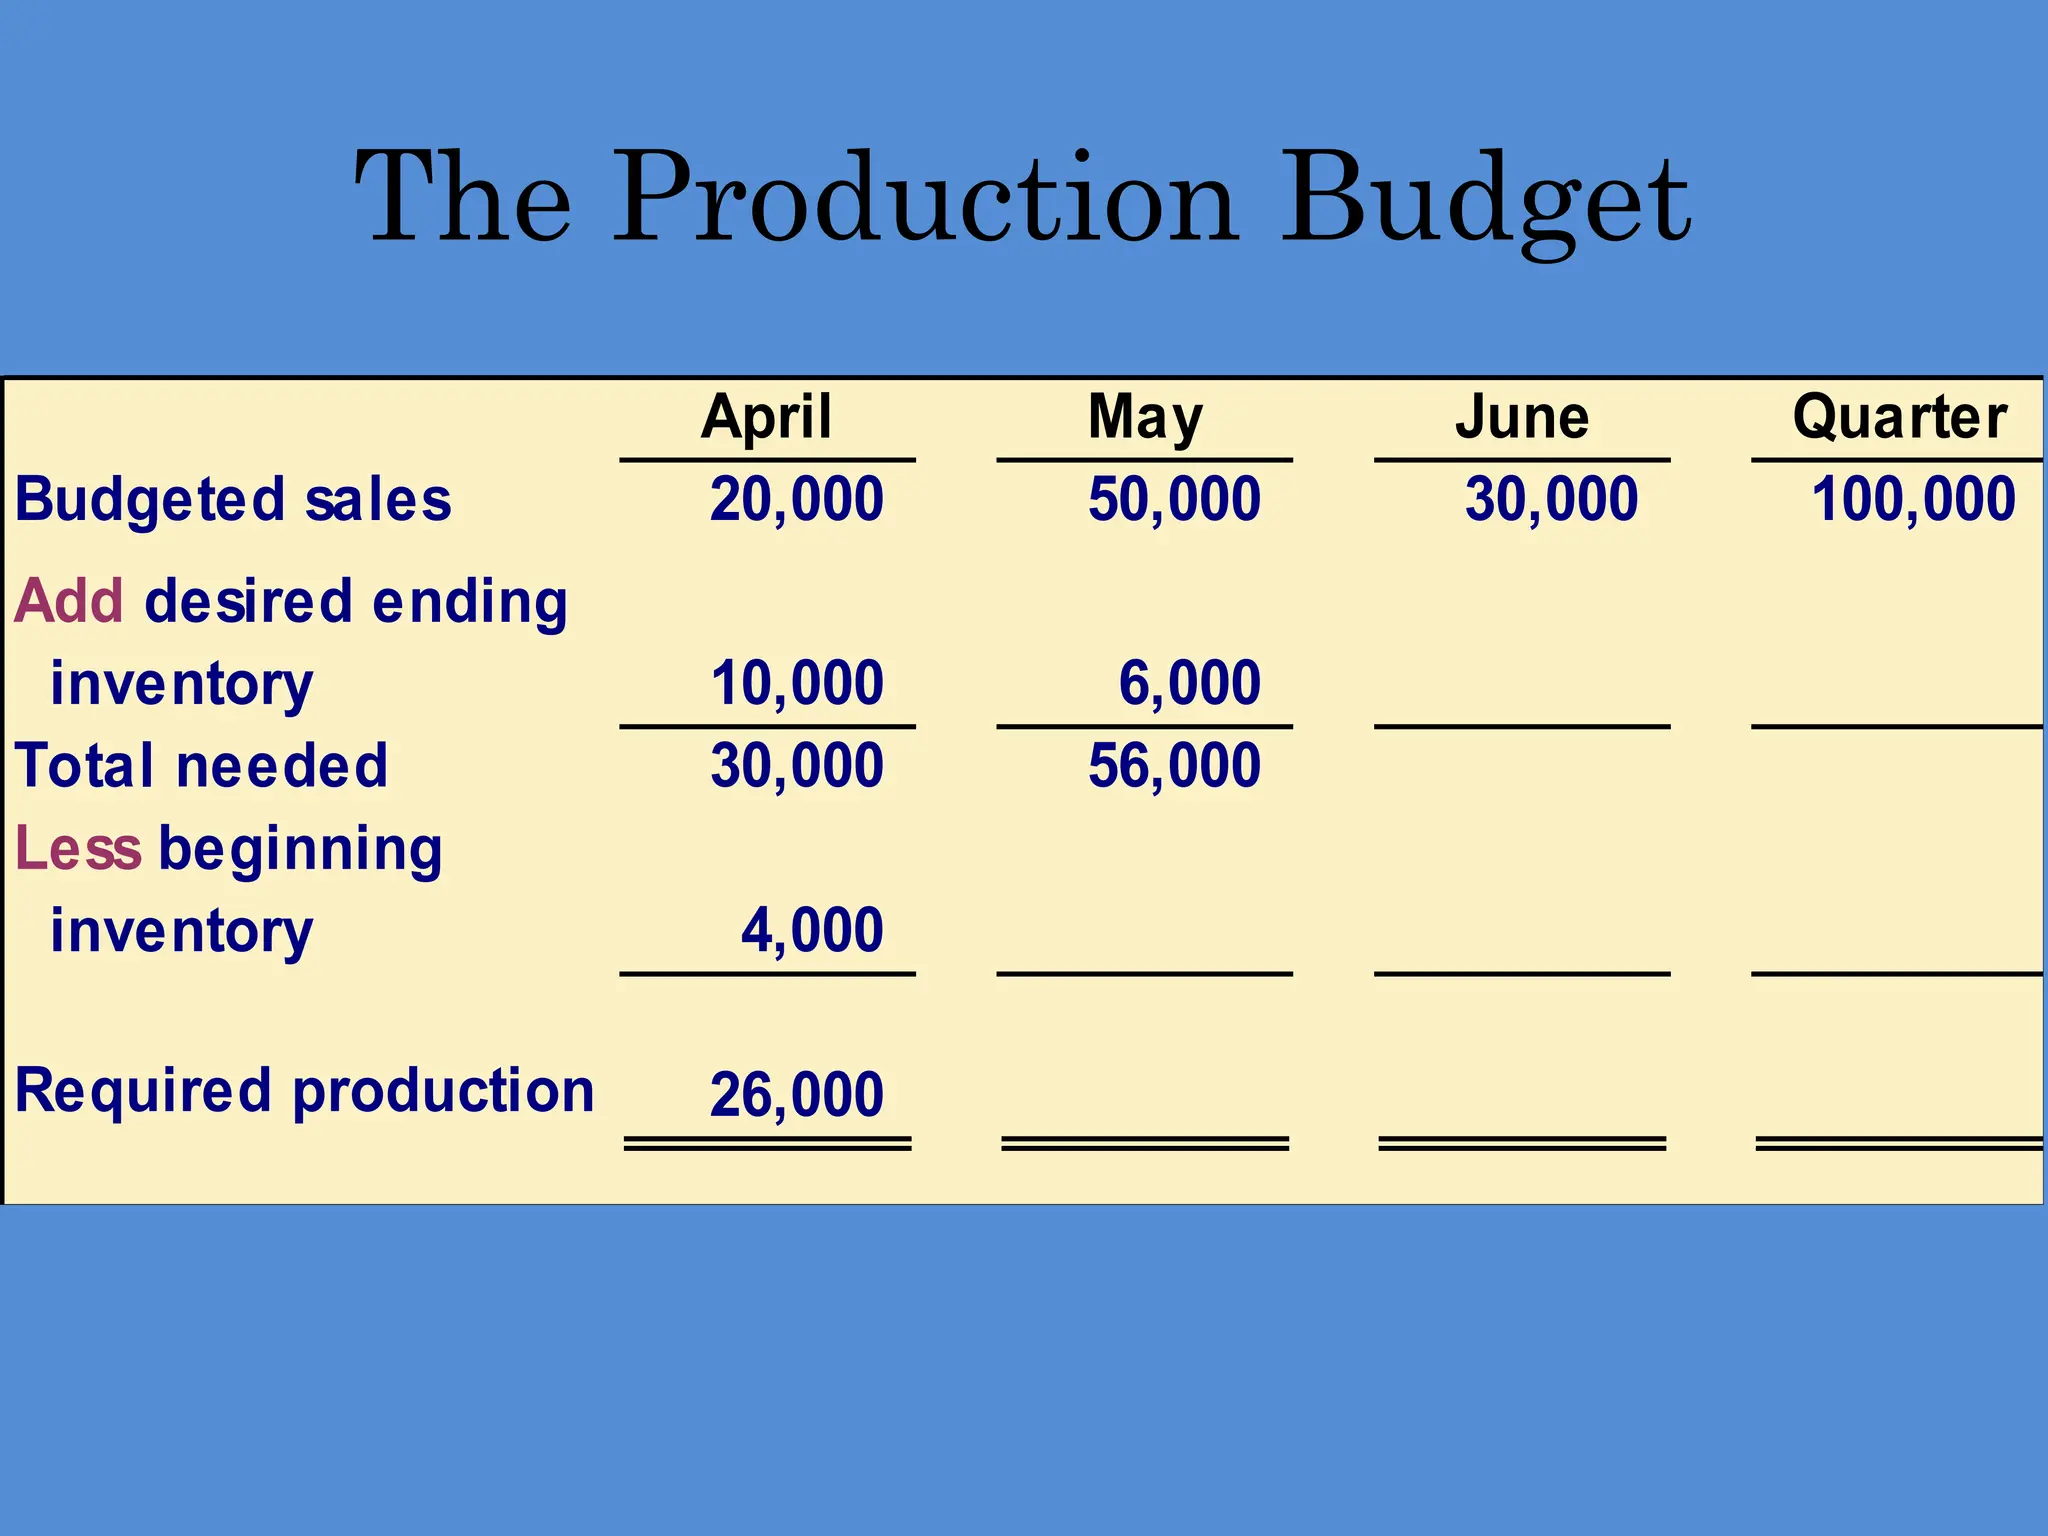
The Production Budget
AprilMay June Quarter
Budgeted sales 20,000 50,000 30,000 100,000
Add desired ending
inventory 10,000 6,000
Total needed 30,000 56,000
Less beginning
inventory 4,000
Required production 26,000
28.
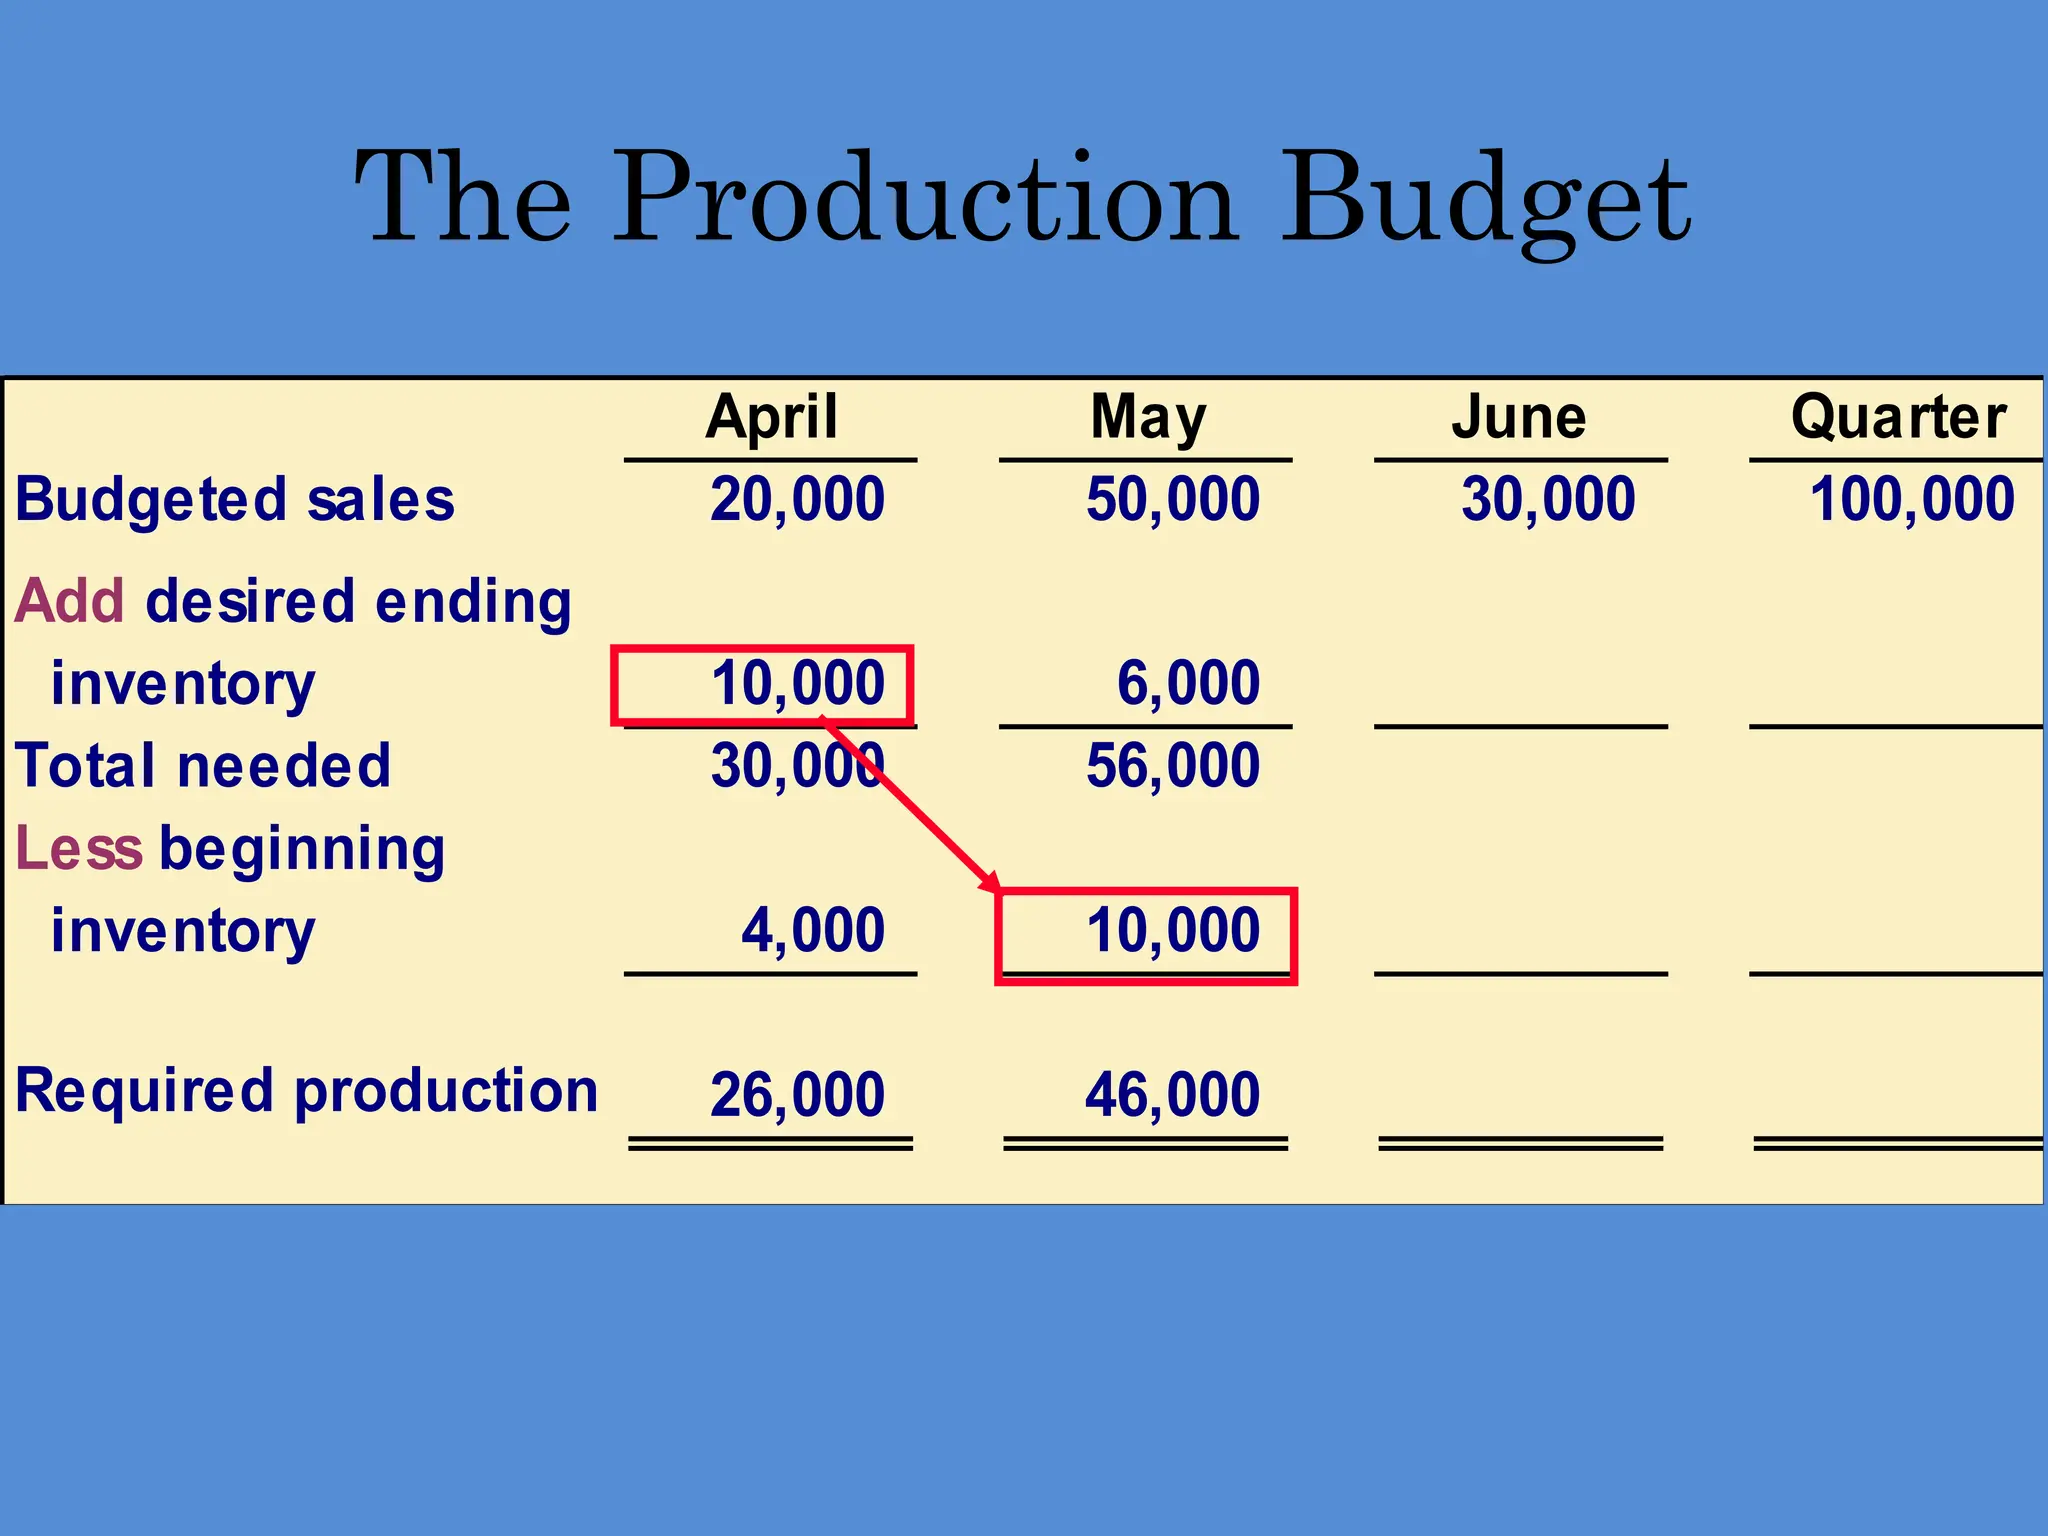
April May JuneQuarter
Budgeted sales 20,000 50,000 30,000 100,000
Add desired ending
inventory 10,000 6,000
Total needed 30,000 56,000
Less beginning
inventory 4,000 10,000
Required production 26,000 46,000
The Production Budget
29.
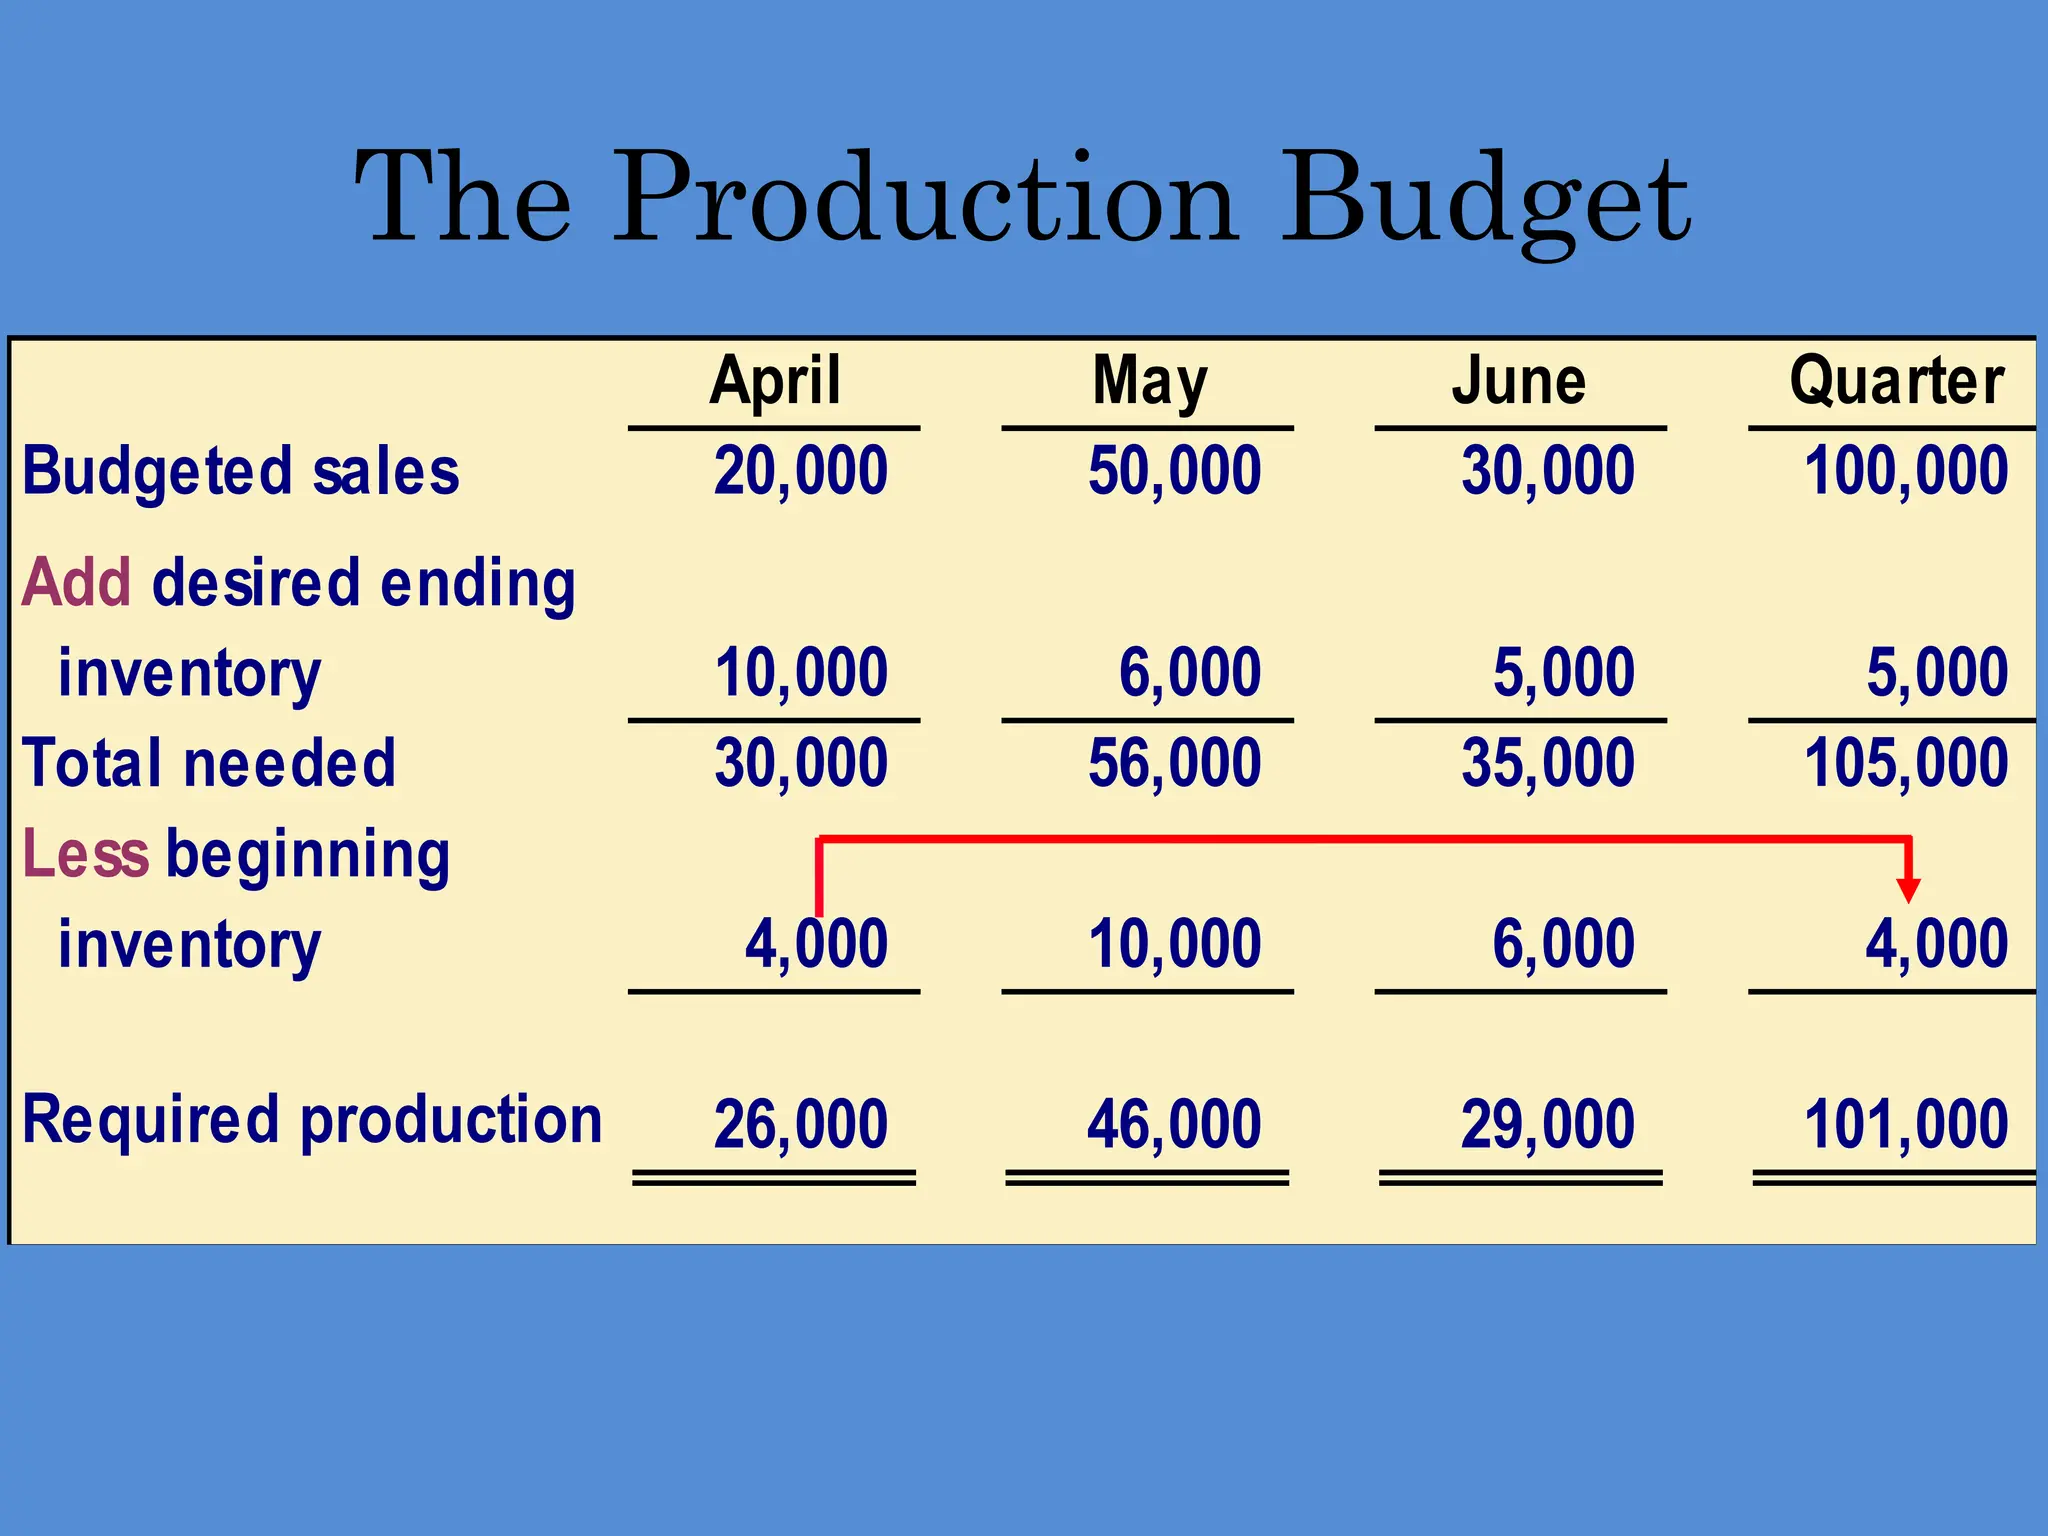
April May JuneQuarter
Budgeted sales 20,000 50,000 30,000 100,000
Add desired ending
inventory 10,000 6,000 5,000 5,000
Total needed 30,000 56,000 35,000 105,000
Less beginning
inventory 4,000 10,000 6,000 4,000
Required production 26,000 46,000 29,000 101,000
The Production Budget
30.
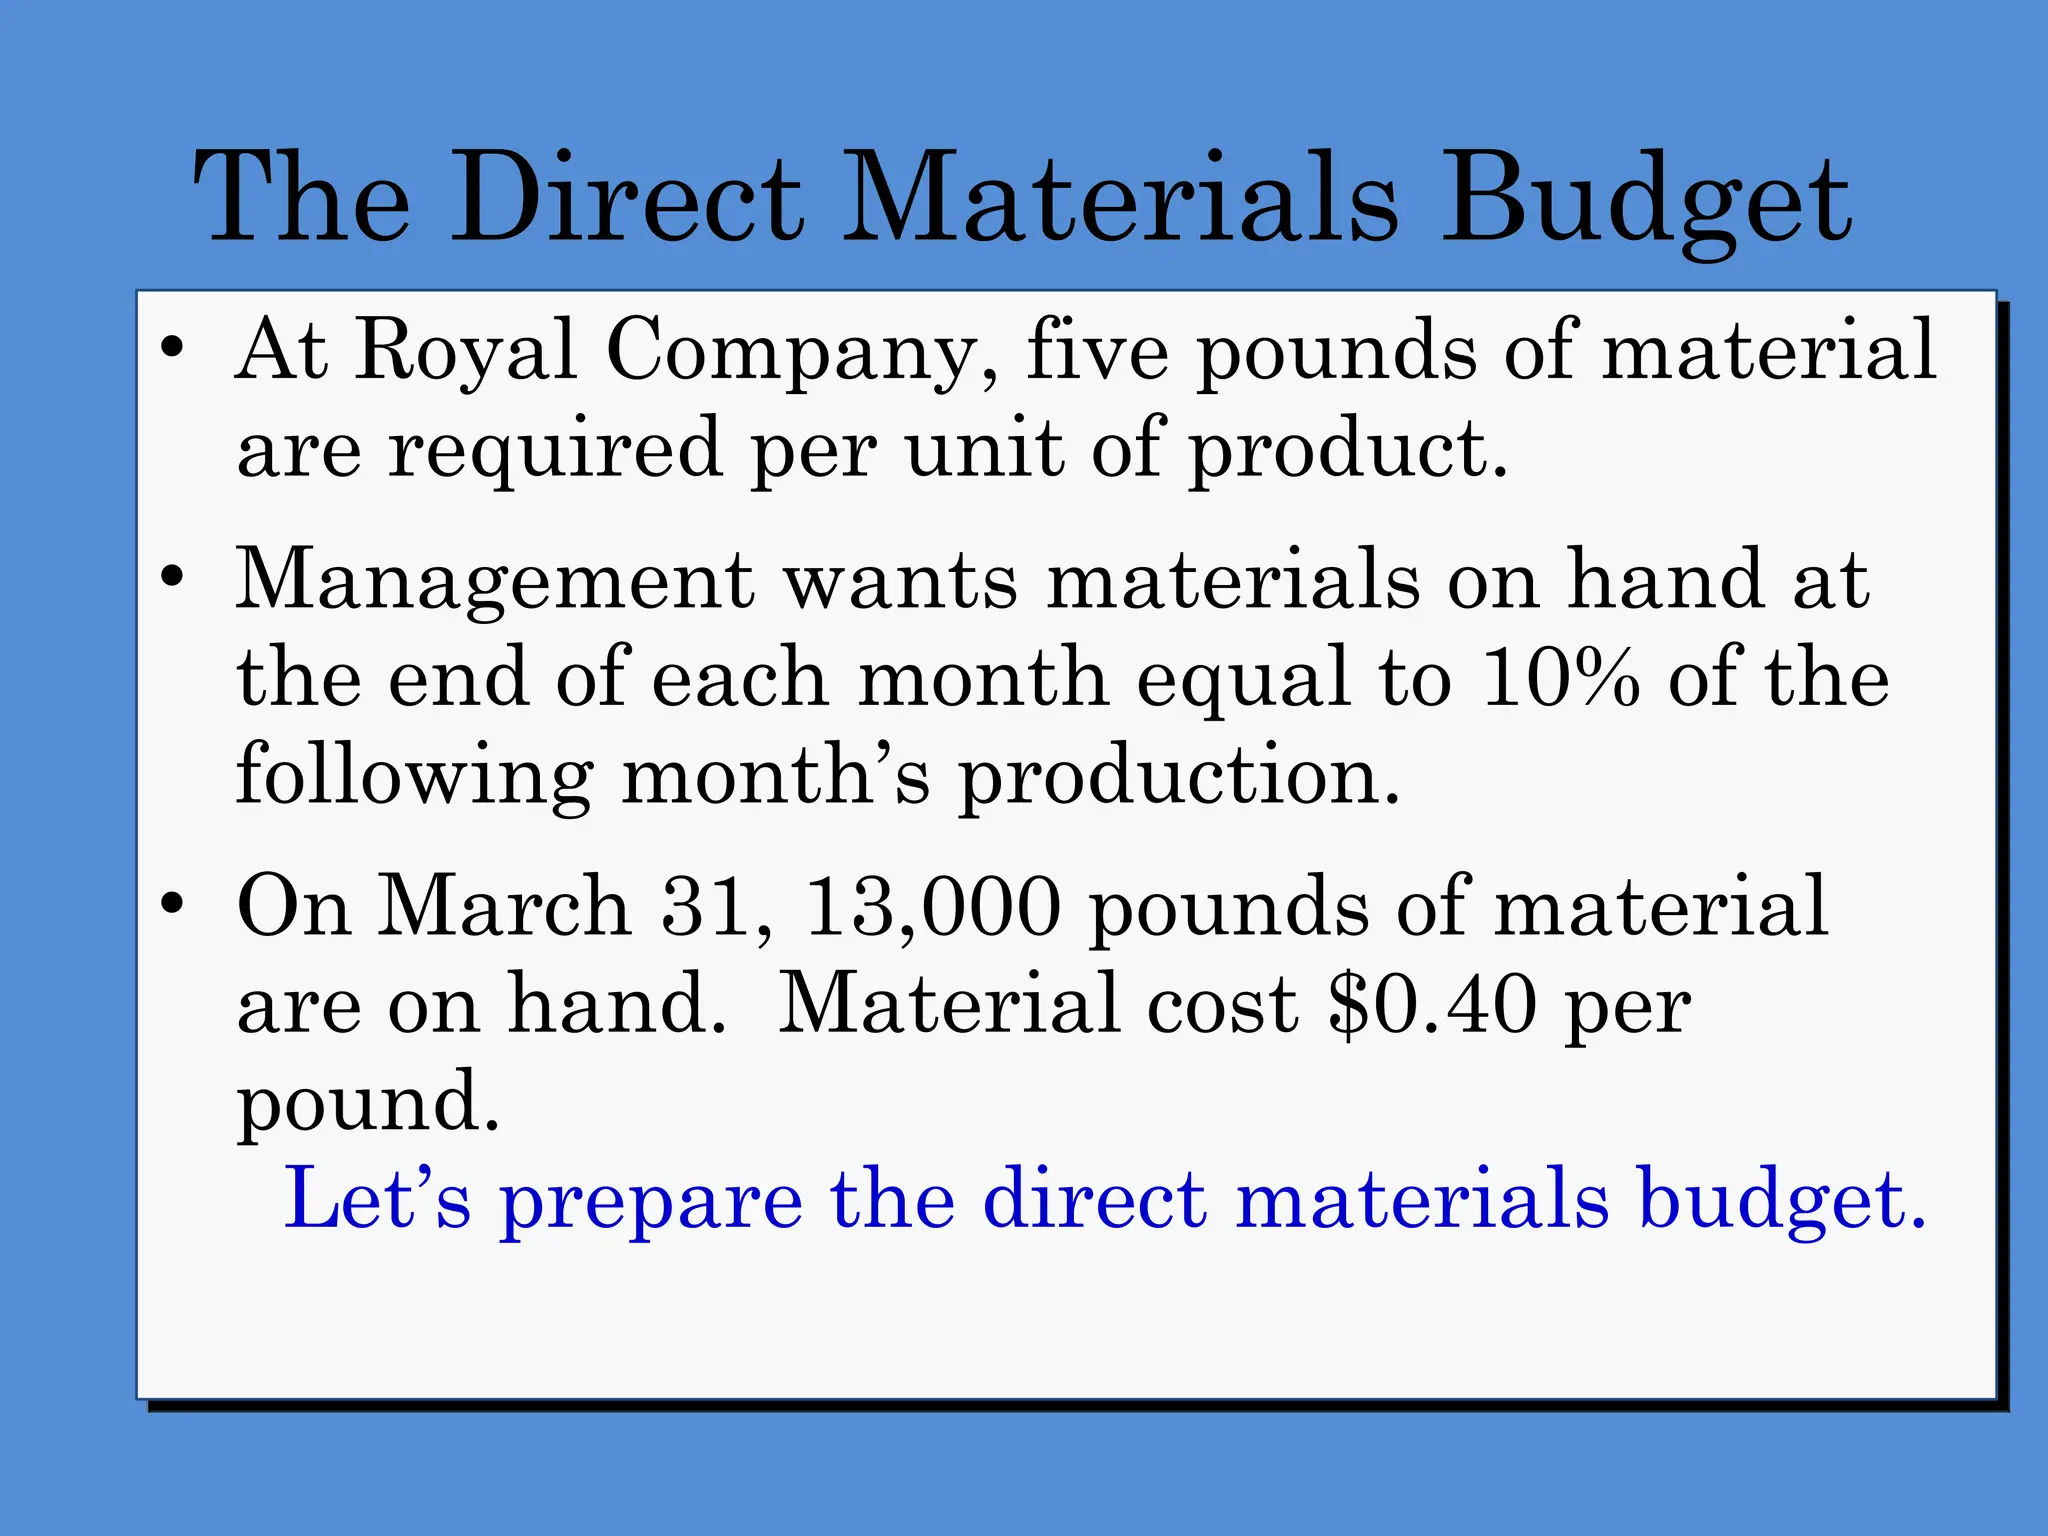
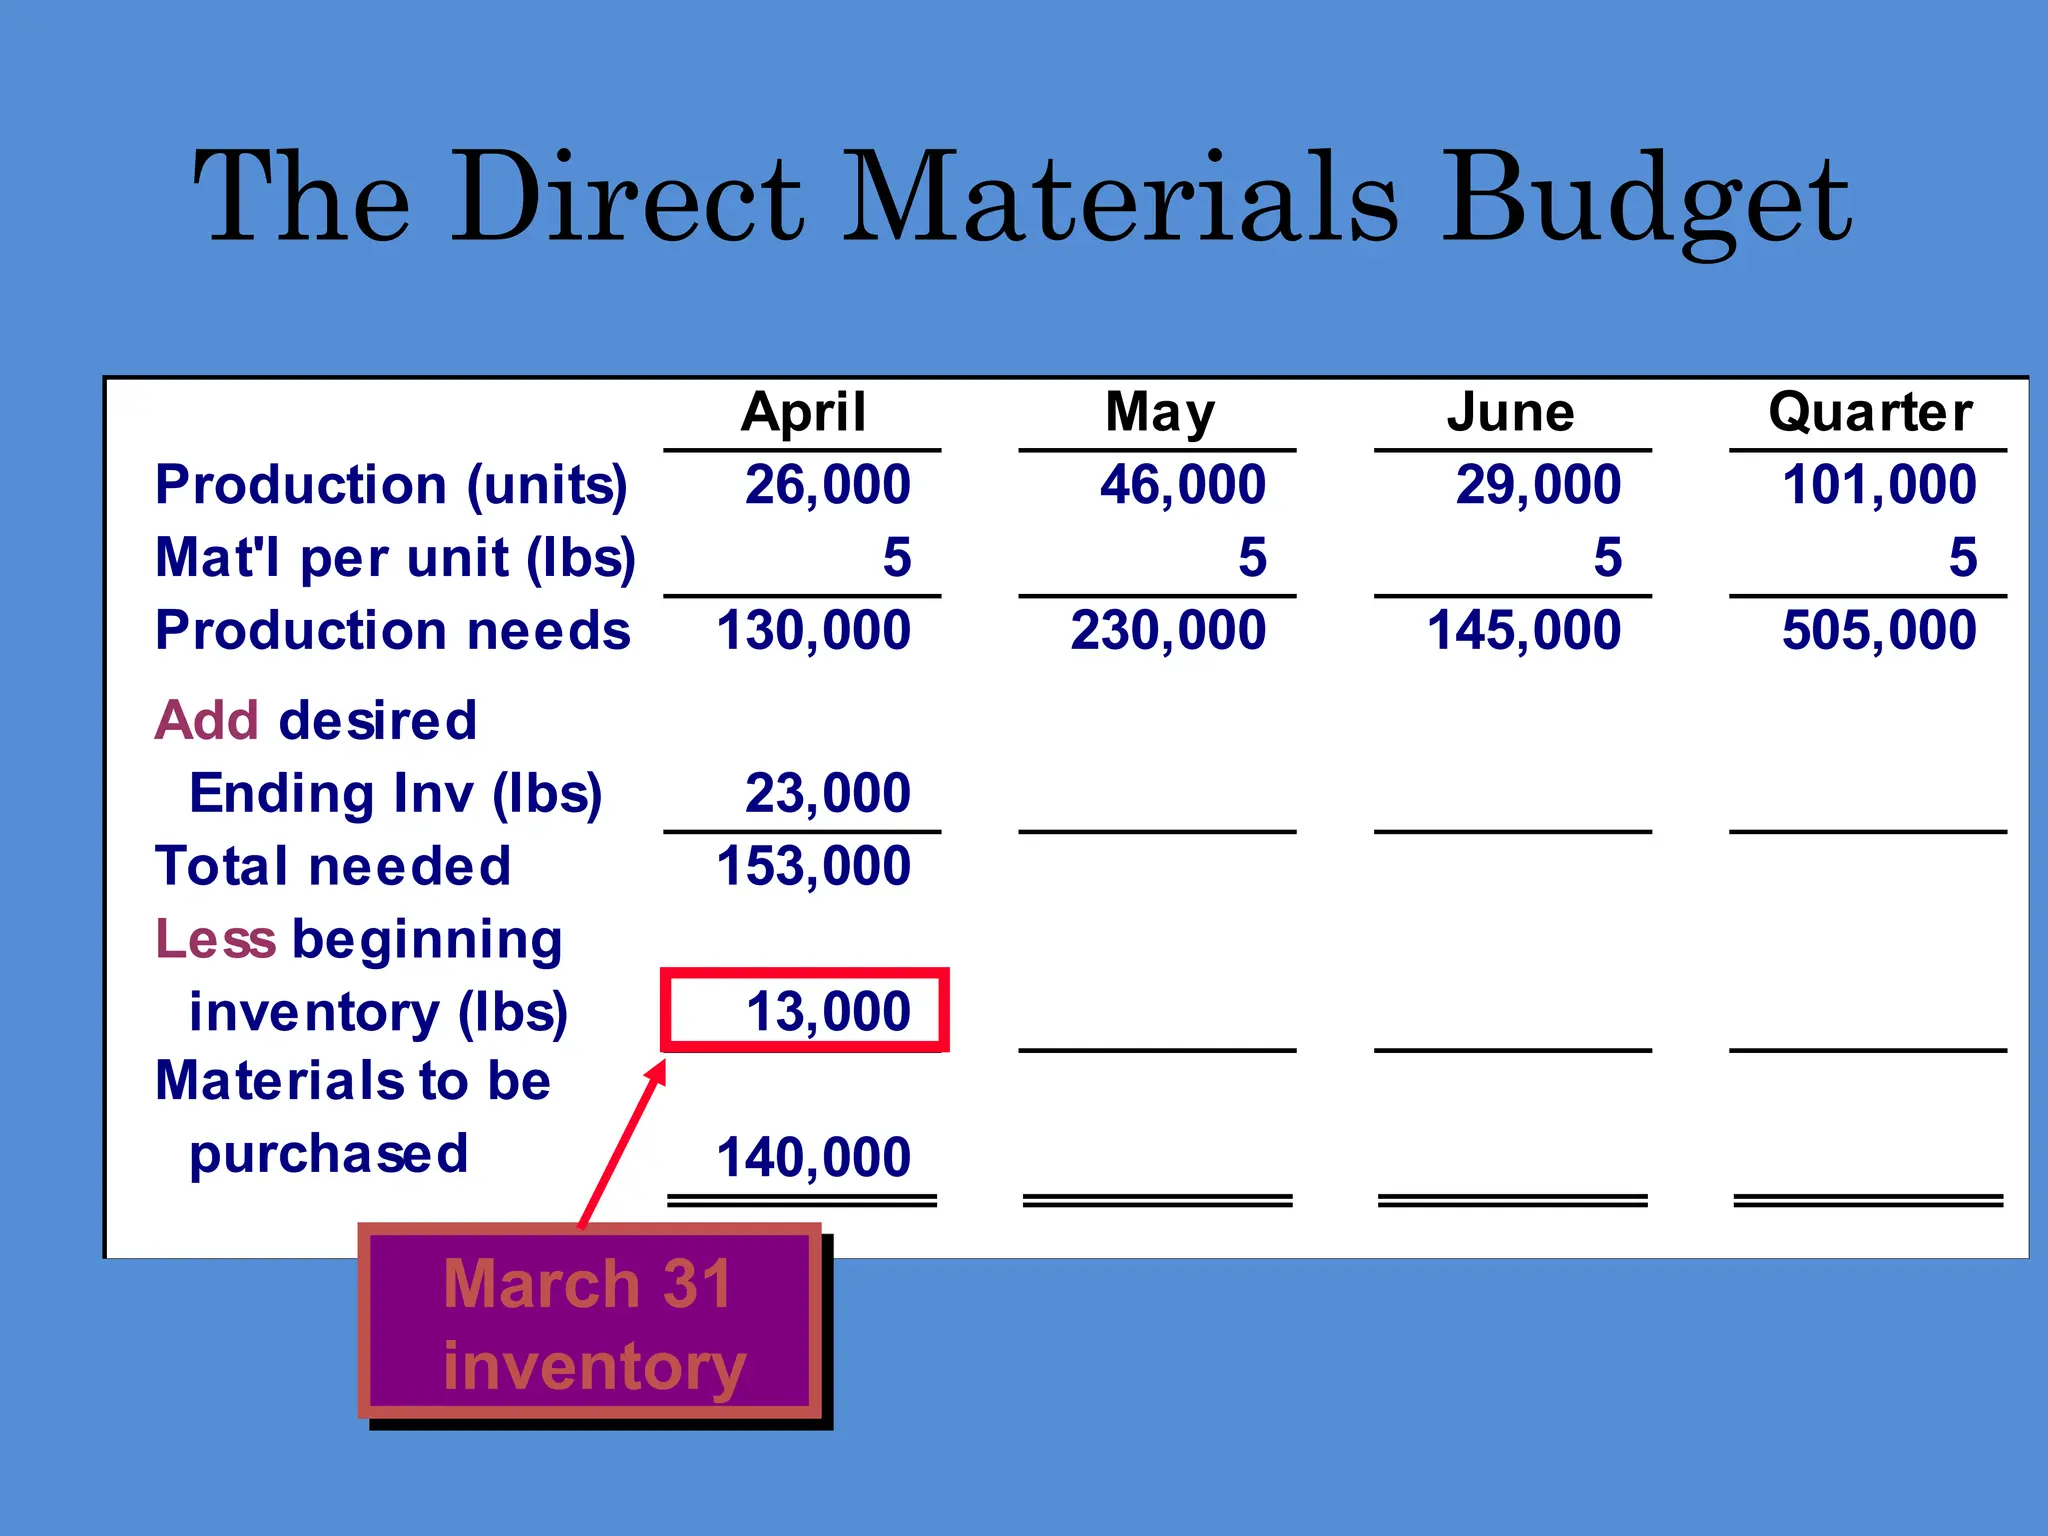
The Direct MaterialsBudget
• At Royal Company, five pounds of material
are required per unit of product.
• Management wants materials on hand at
the end of each month equal to 10% of the
following month’s production.
• On March 31, 13,000 pounds of material
are on hand. Material cost $0.40 per
pound.
Let’s prepare the direct materials budget.
31.
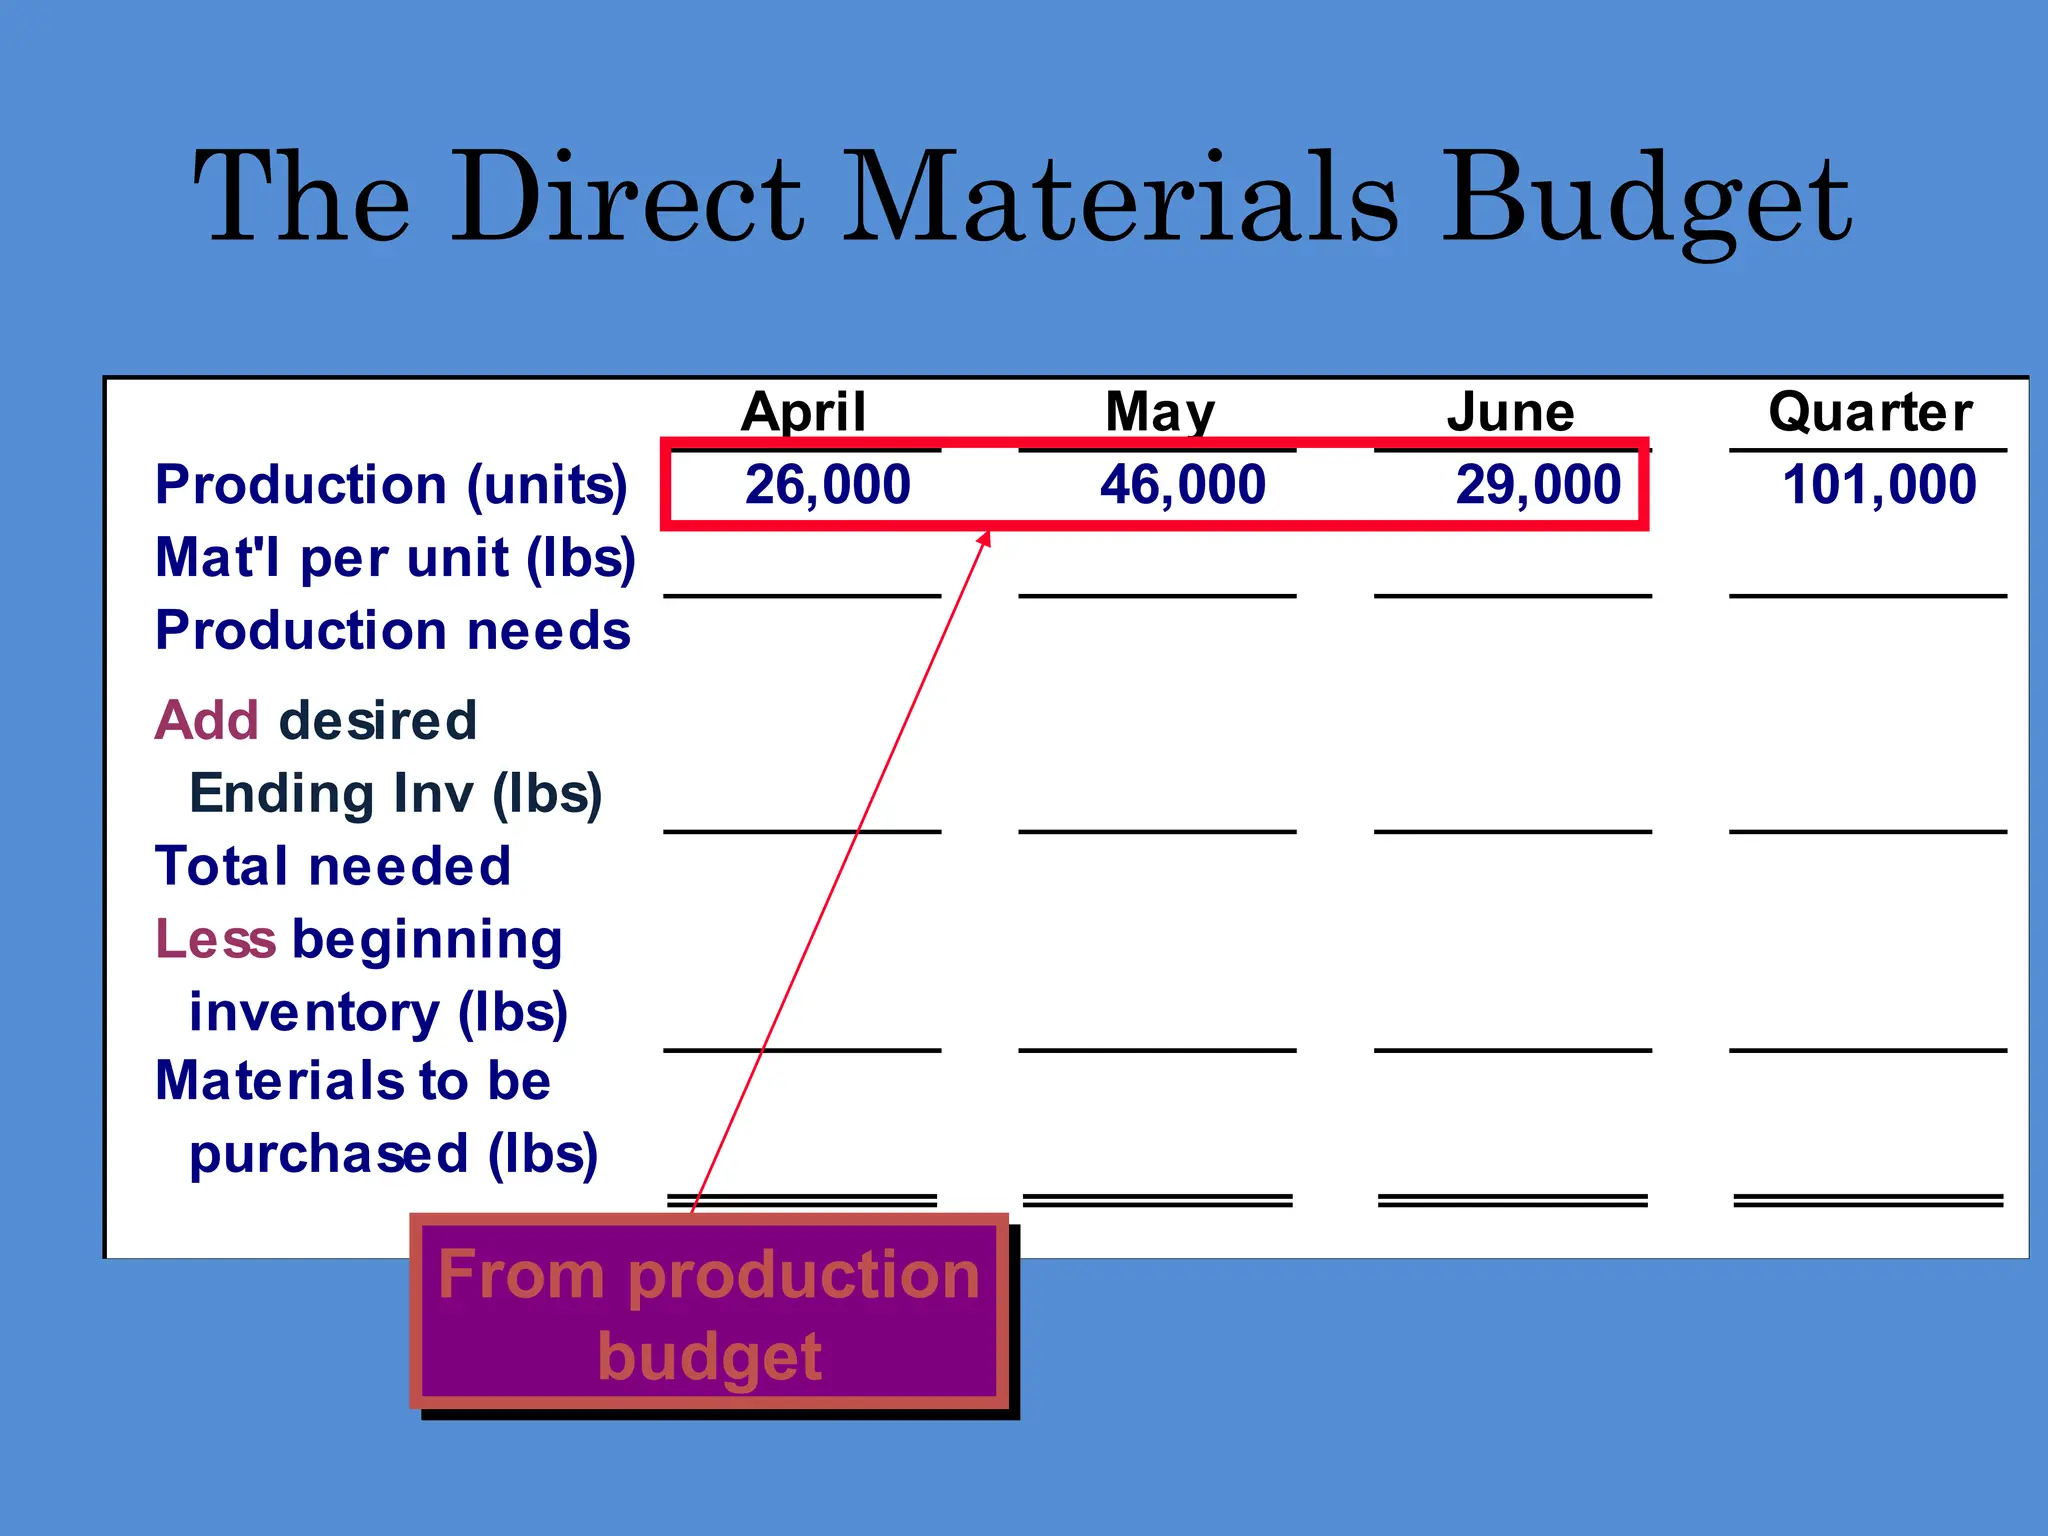
April May JuneQuarter
Production (units) 26,000 46,000 29,000 101,000
Mat'l per unit (lbs)
Production needs
Add desired
Ending Inv (lbs)
Total needed
Less beginning
inventory (lbs)
Materials to be
purchased (lbs)
The Direct Materials Budget
From production
budget
32.
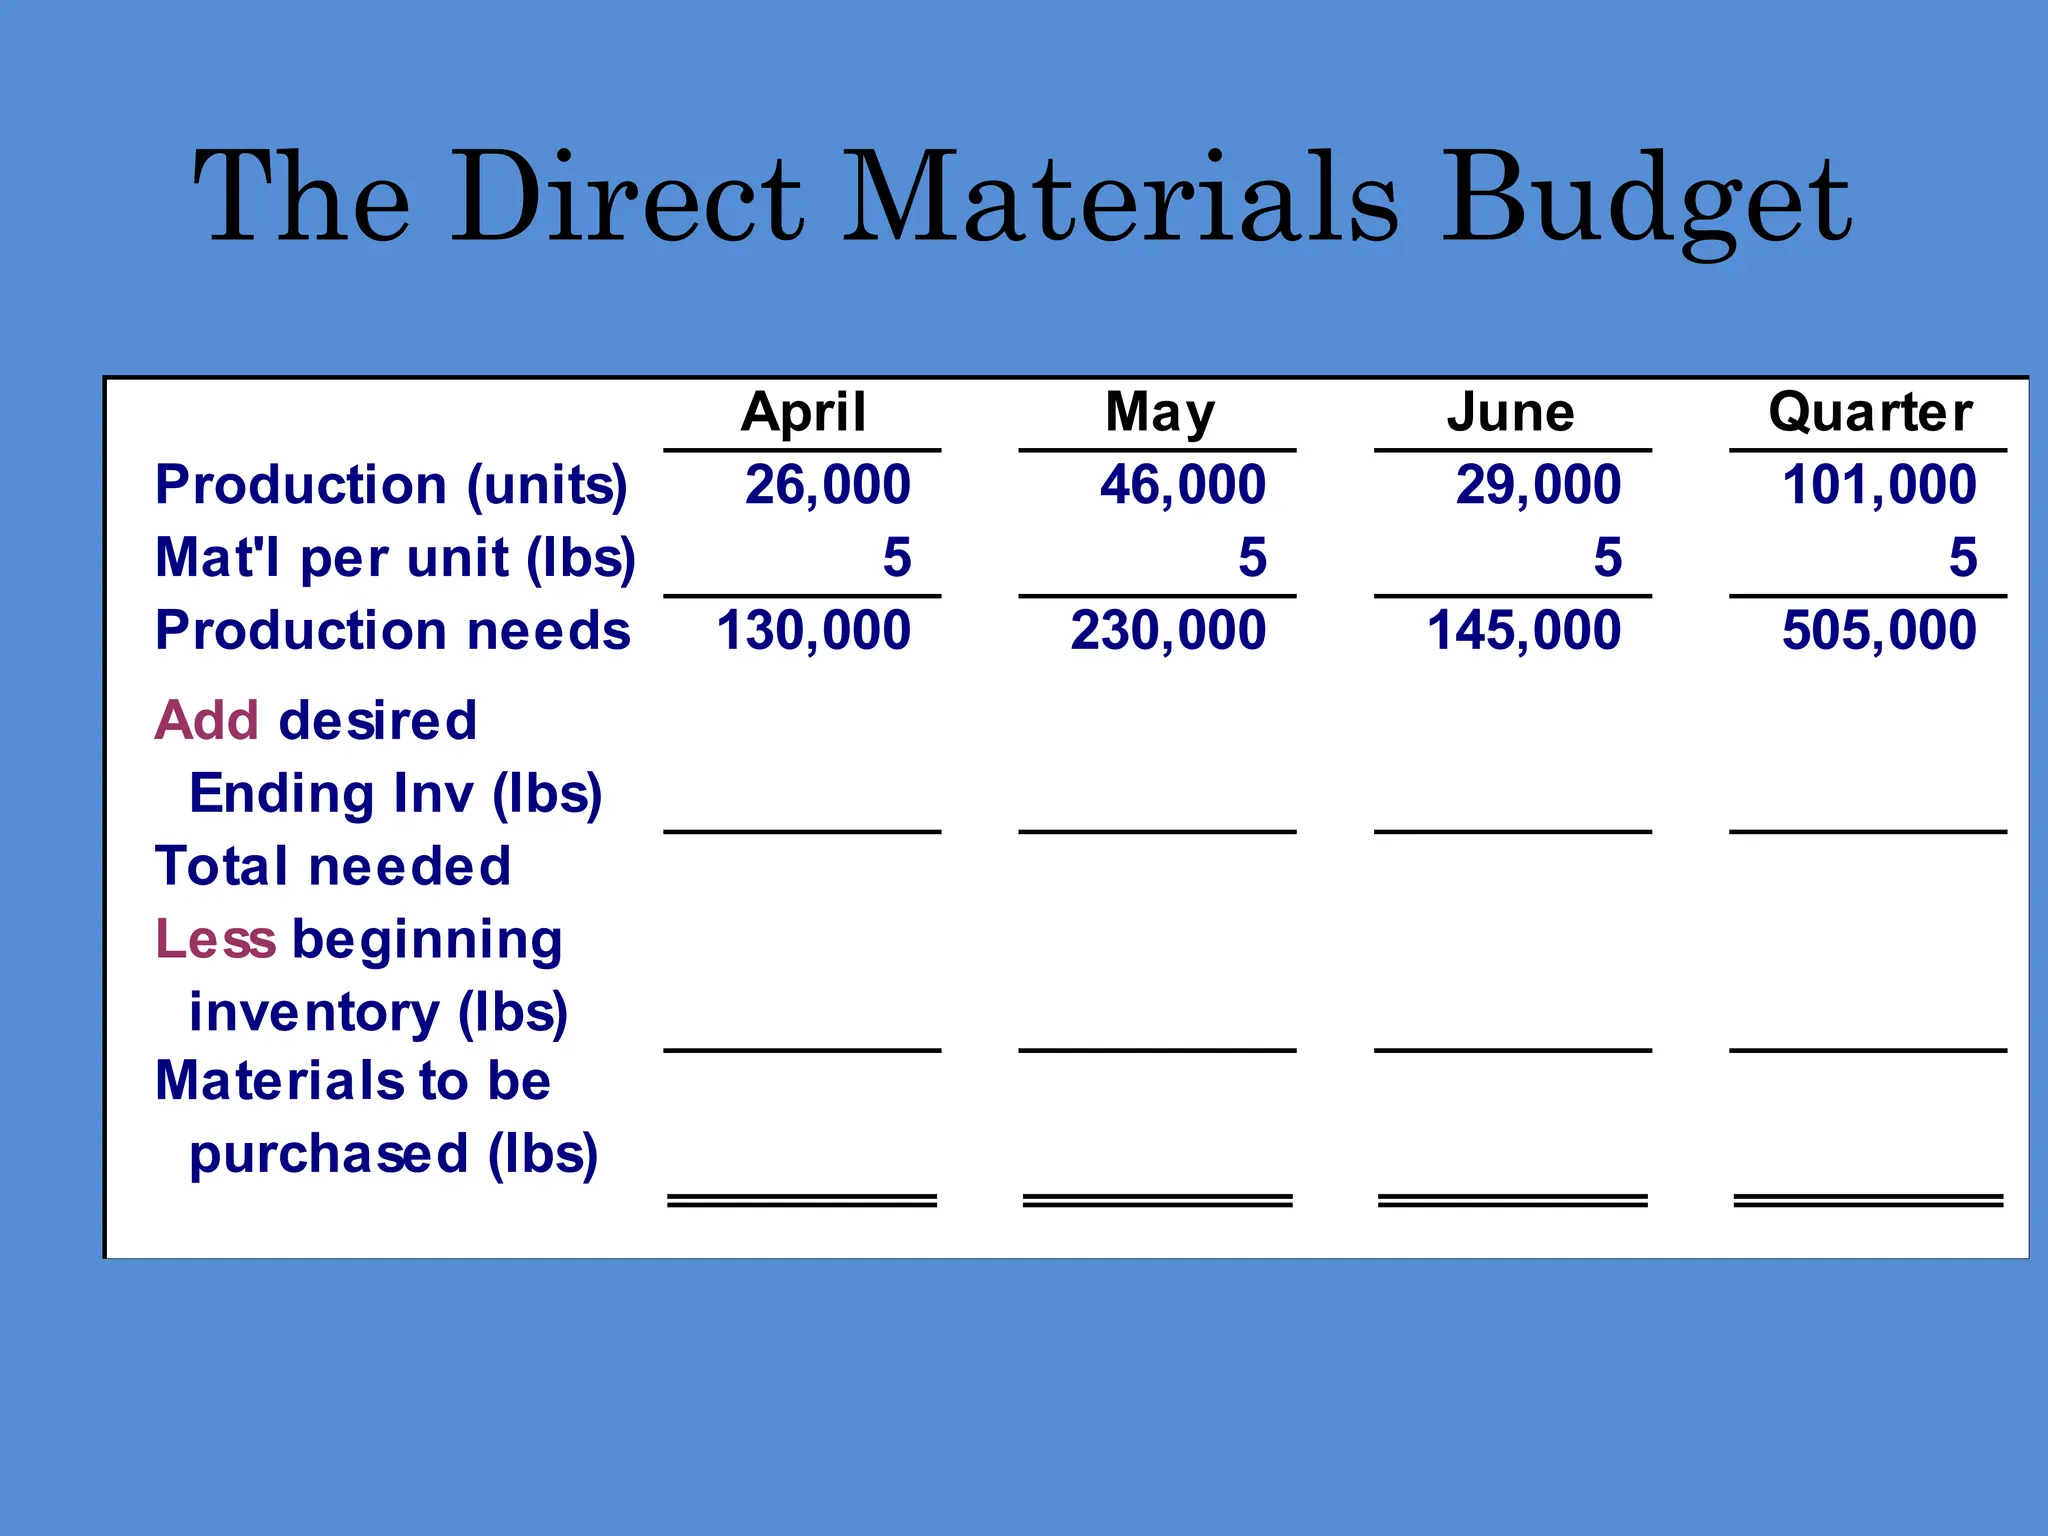
The Direct MaterialsBudget
April May June Quarter
Production (units) 26,000 46,000 29,000 101,000
Mat'l per unit (lbs) 5 5 5 5
Production needs 130,000 230,000 145,000 505,000
Add desired
Ending Inv (lbs)
Total needed
Less beginning
inventory (lbs)
Materials to be
purchased (lbs)
33.
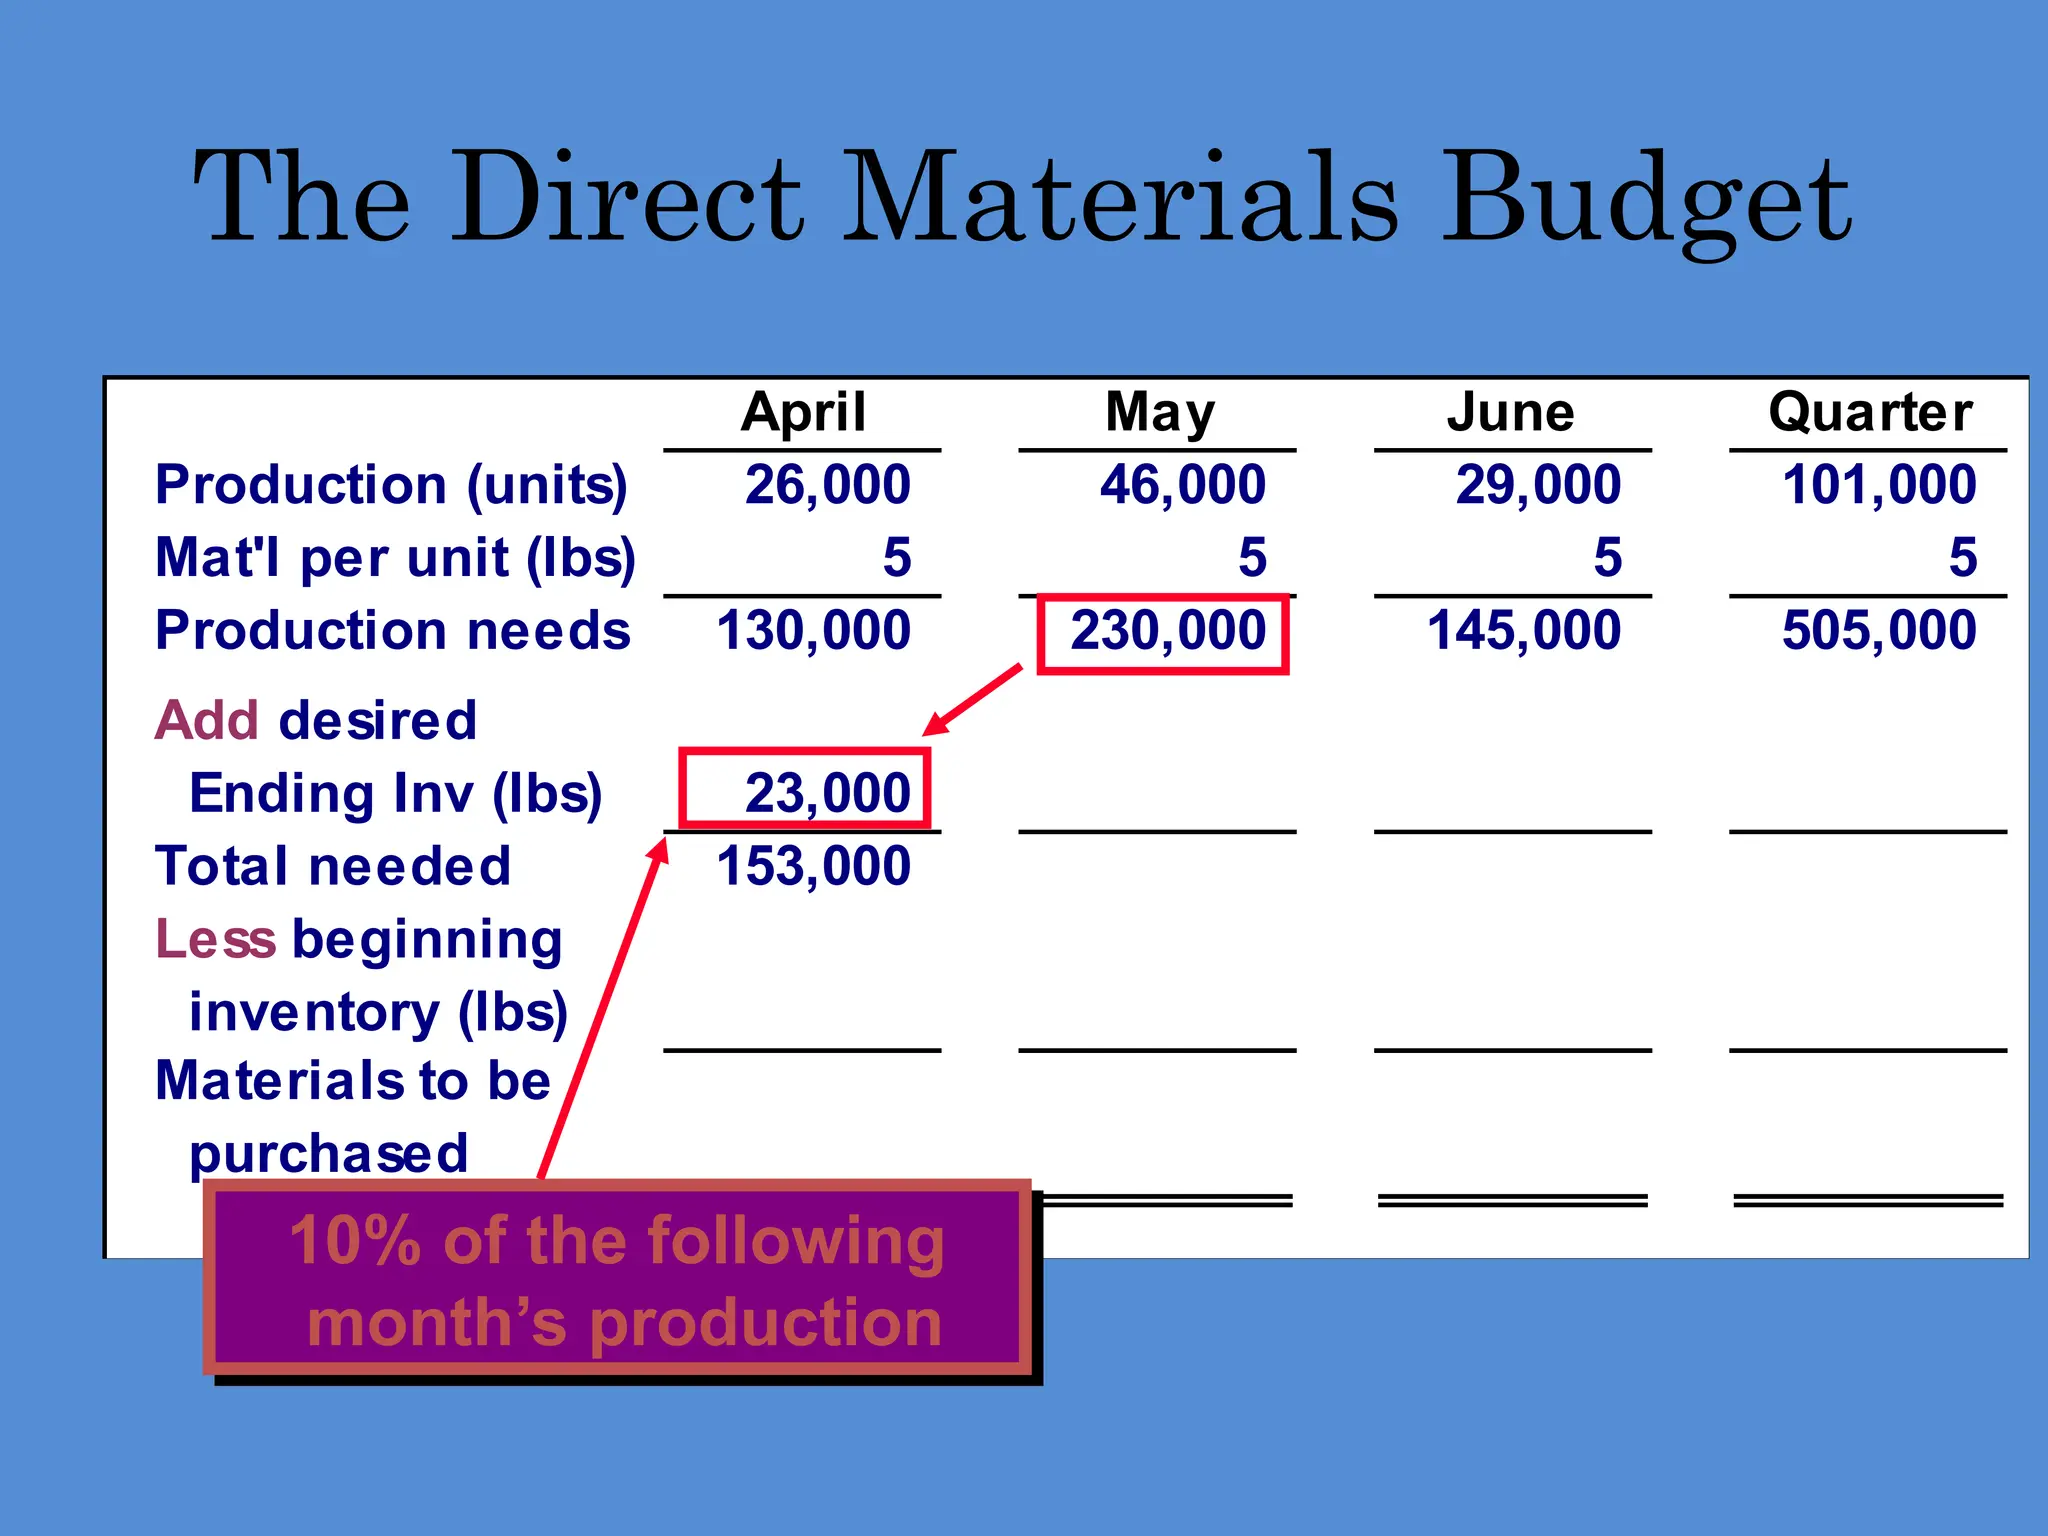
April May JuneQuarter
Production (units) 26,000 46,000 29,000 101,000
Mat'l per unit (lbs) 5 5 5 5
Production needs 130,000 230,000 145,000 505,000
Add desired
Ending Inv (lbs) 23,000
Total needed 153,000
Less beginning
inventory (lbs)
Materials to be
purchased
The Direct Materials Budget
10% of the following
month’s production
34.
April May JuneQuarter
Production (units) 26,000 46,000 29,000 101,000
Mat'l per unit (lbs) 5 5 5 5
Production needs 130,000 230,000 145,000 505,000
Add desired
Ending Inv (lbs) 23,000
Total needed 153,000
Less beginning
inventory (lbs) 13,000
Materials to be
purchased 140,000
The Direct Materials Budget
March 31
inventory
35.
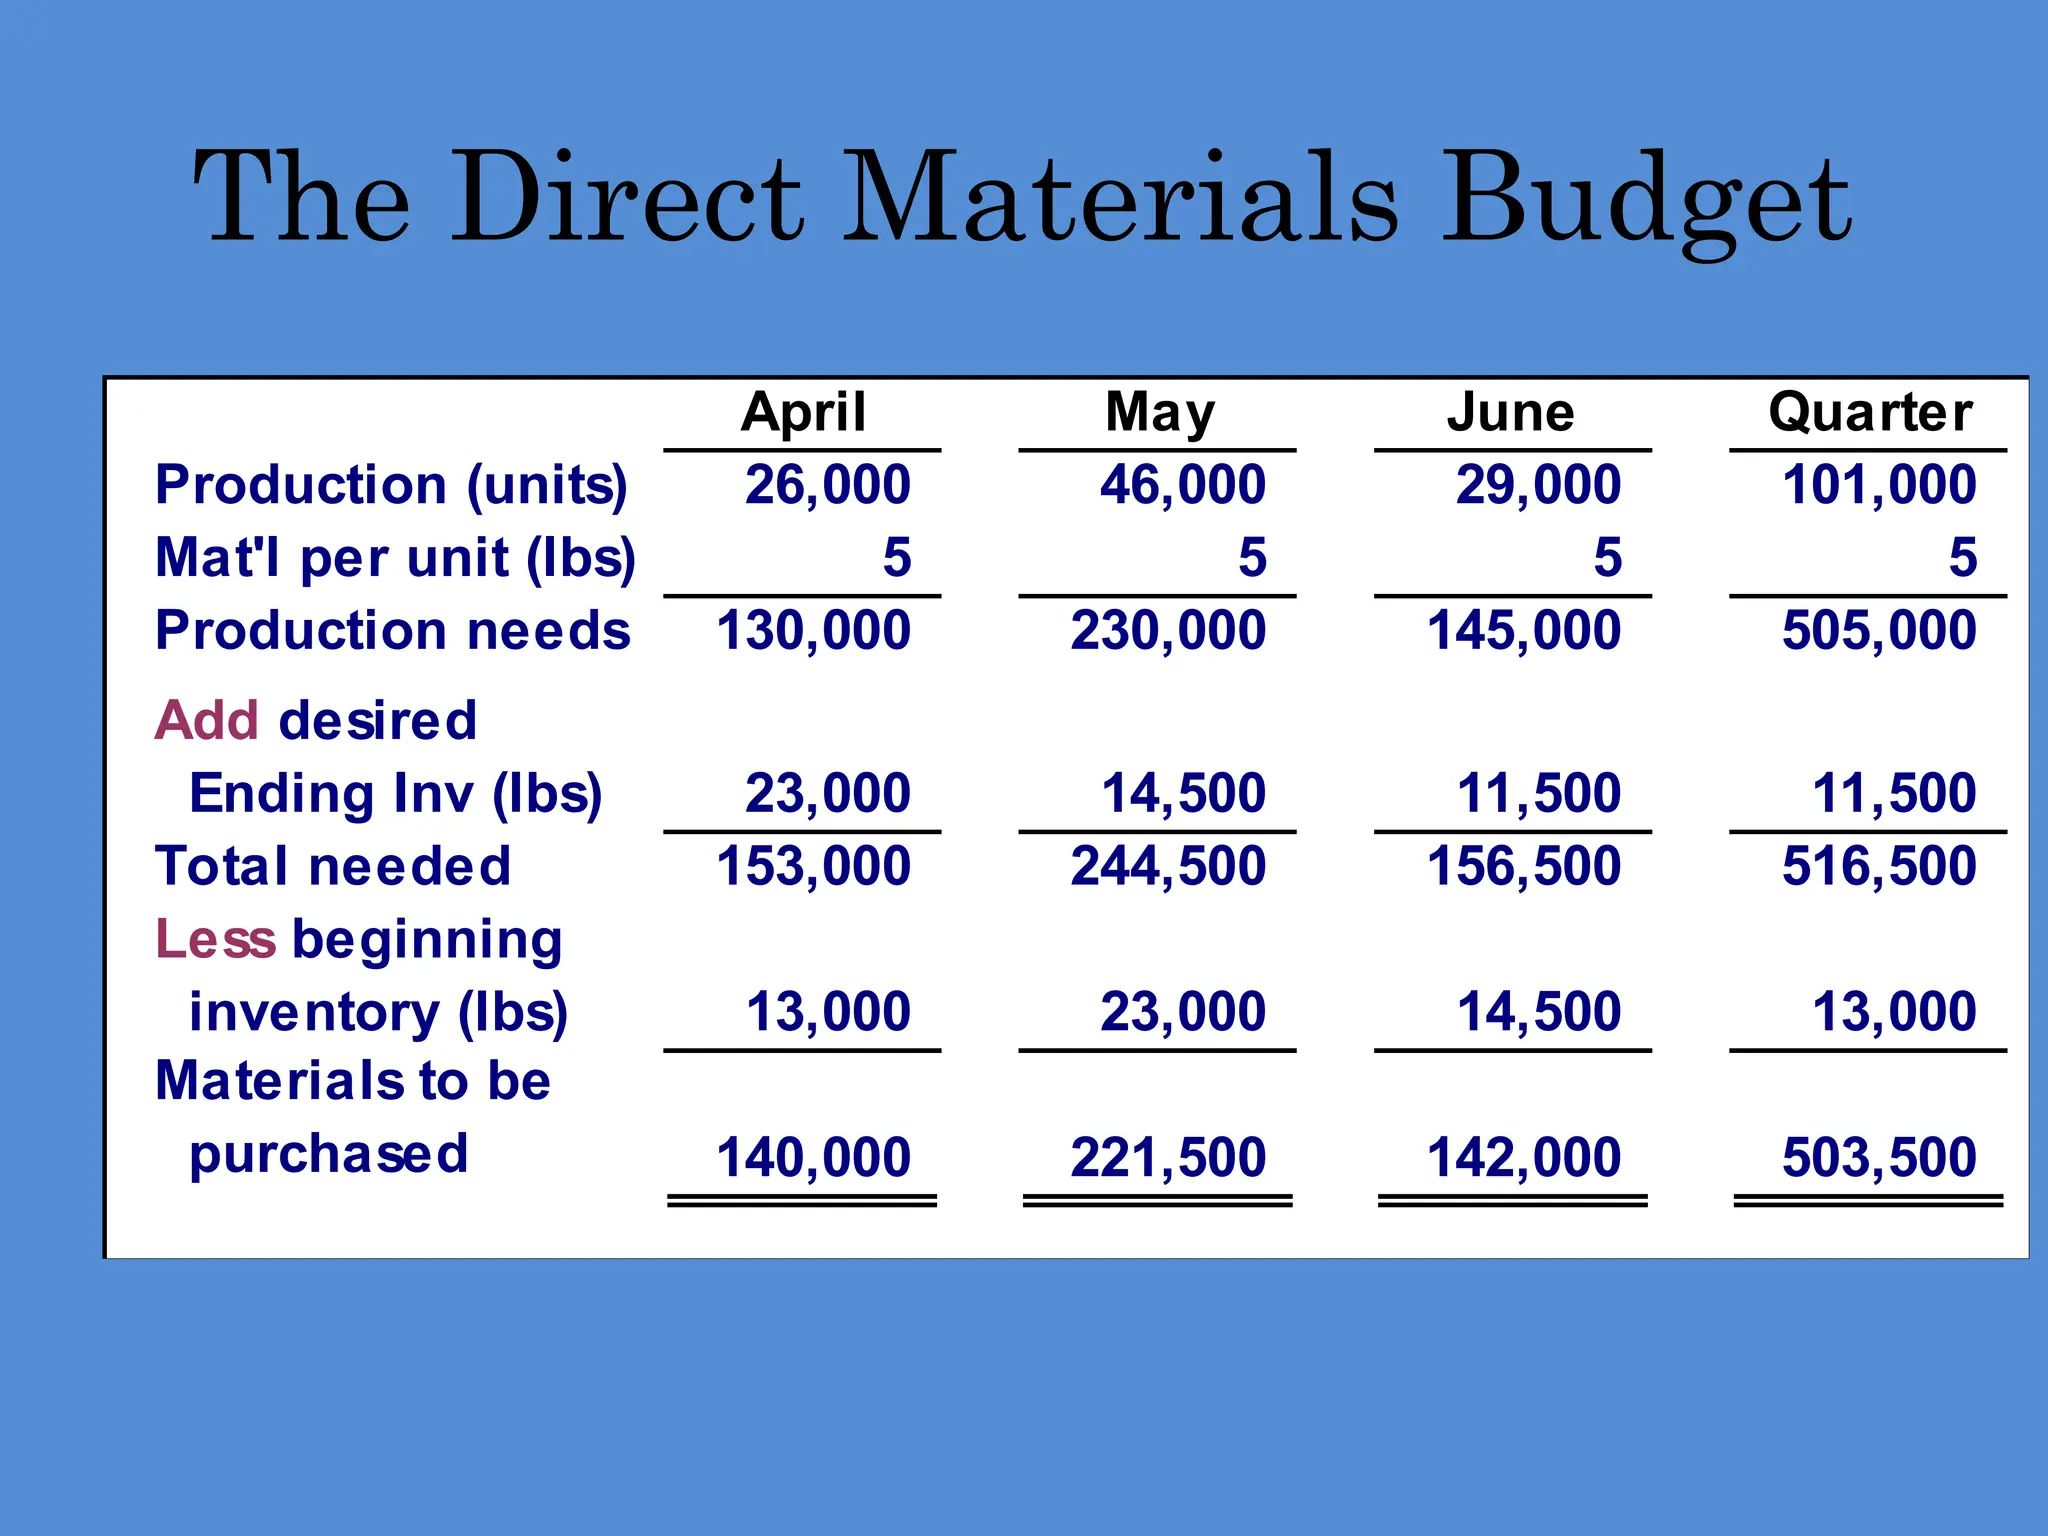
The Direct MaterialsBudget
April May June Quarter
Production (units) 26,000 46,000 29,000 101,000
Mat'l per unit (lbs) 5 5 5 5
Production needs 130,000 230,000 145,000 505,000
Add desired
Ending Inv (lbs) 23,000 14,500 11,500 11,500
Total needed 153,000 244,500 156,500 516,500
Less beginning
inventory (lbs) 13,000 23,000 14,500 13,000
Materials to be
purchased 140,000 221,500 142,000 503,500
36.
April May JuneQuarter
Production (units) 26,000 46,000 29,000 101,000
Mat'l per unit (lbs) 5 5 5 5
Production needs 130,000 230,000 145,000 505,000
Add desired
Ending Inv (lbs) 23,000 14,500 11,500 11,500
Total needed 153,000 244,500 156,500 516,500
Less beginning
inventory (lbs) 13,000 23,000 14,500 13,000
Materials to be
purchased 140,000 221,500 142,000 503,500
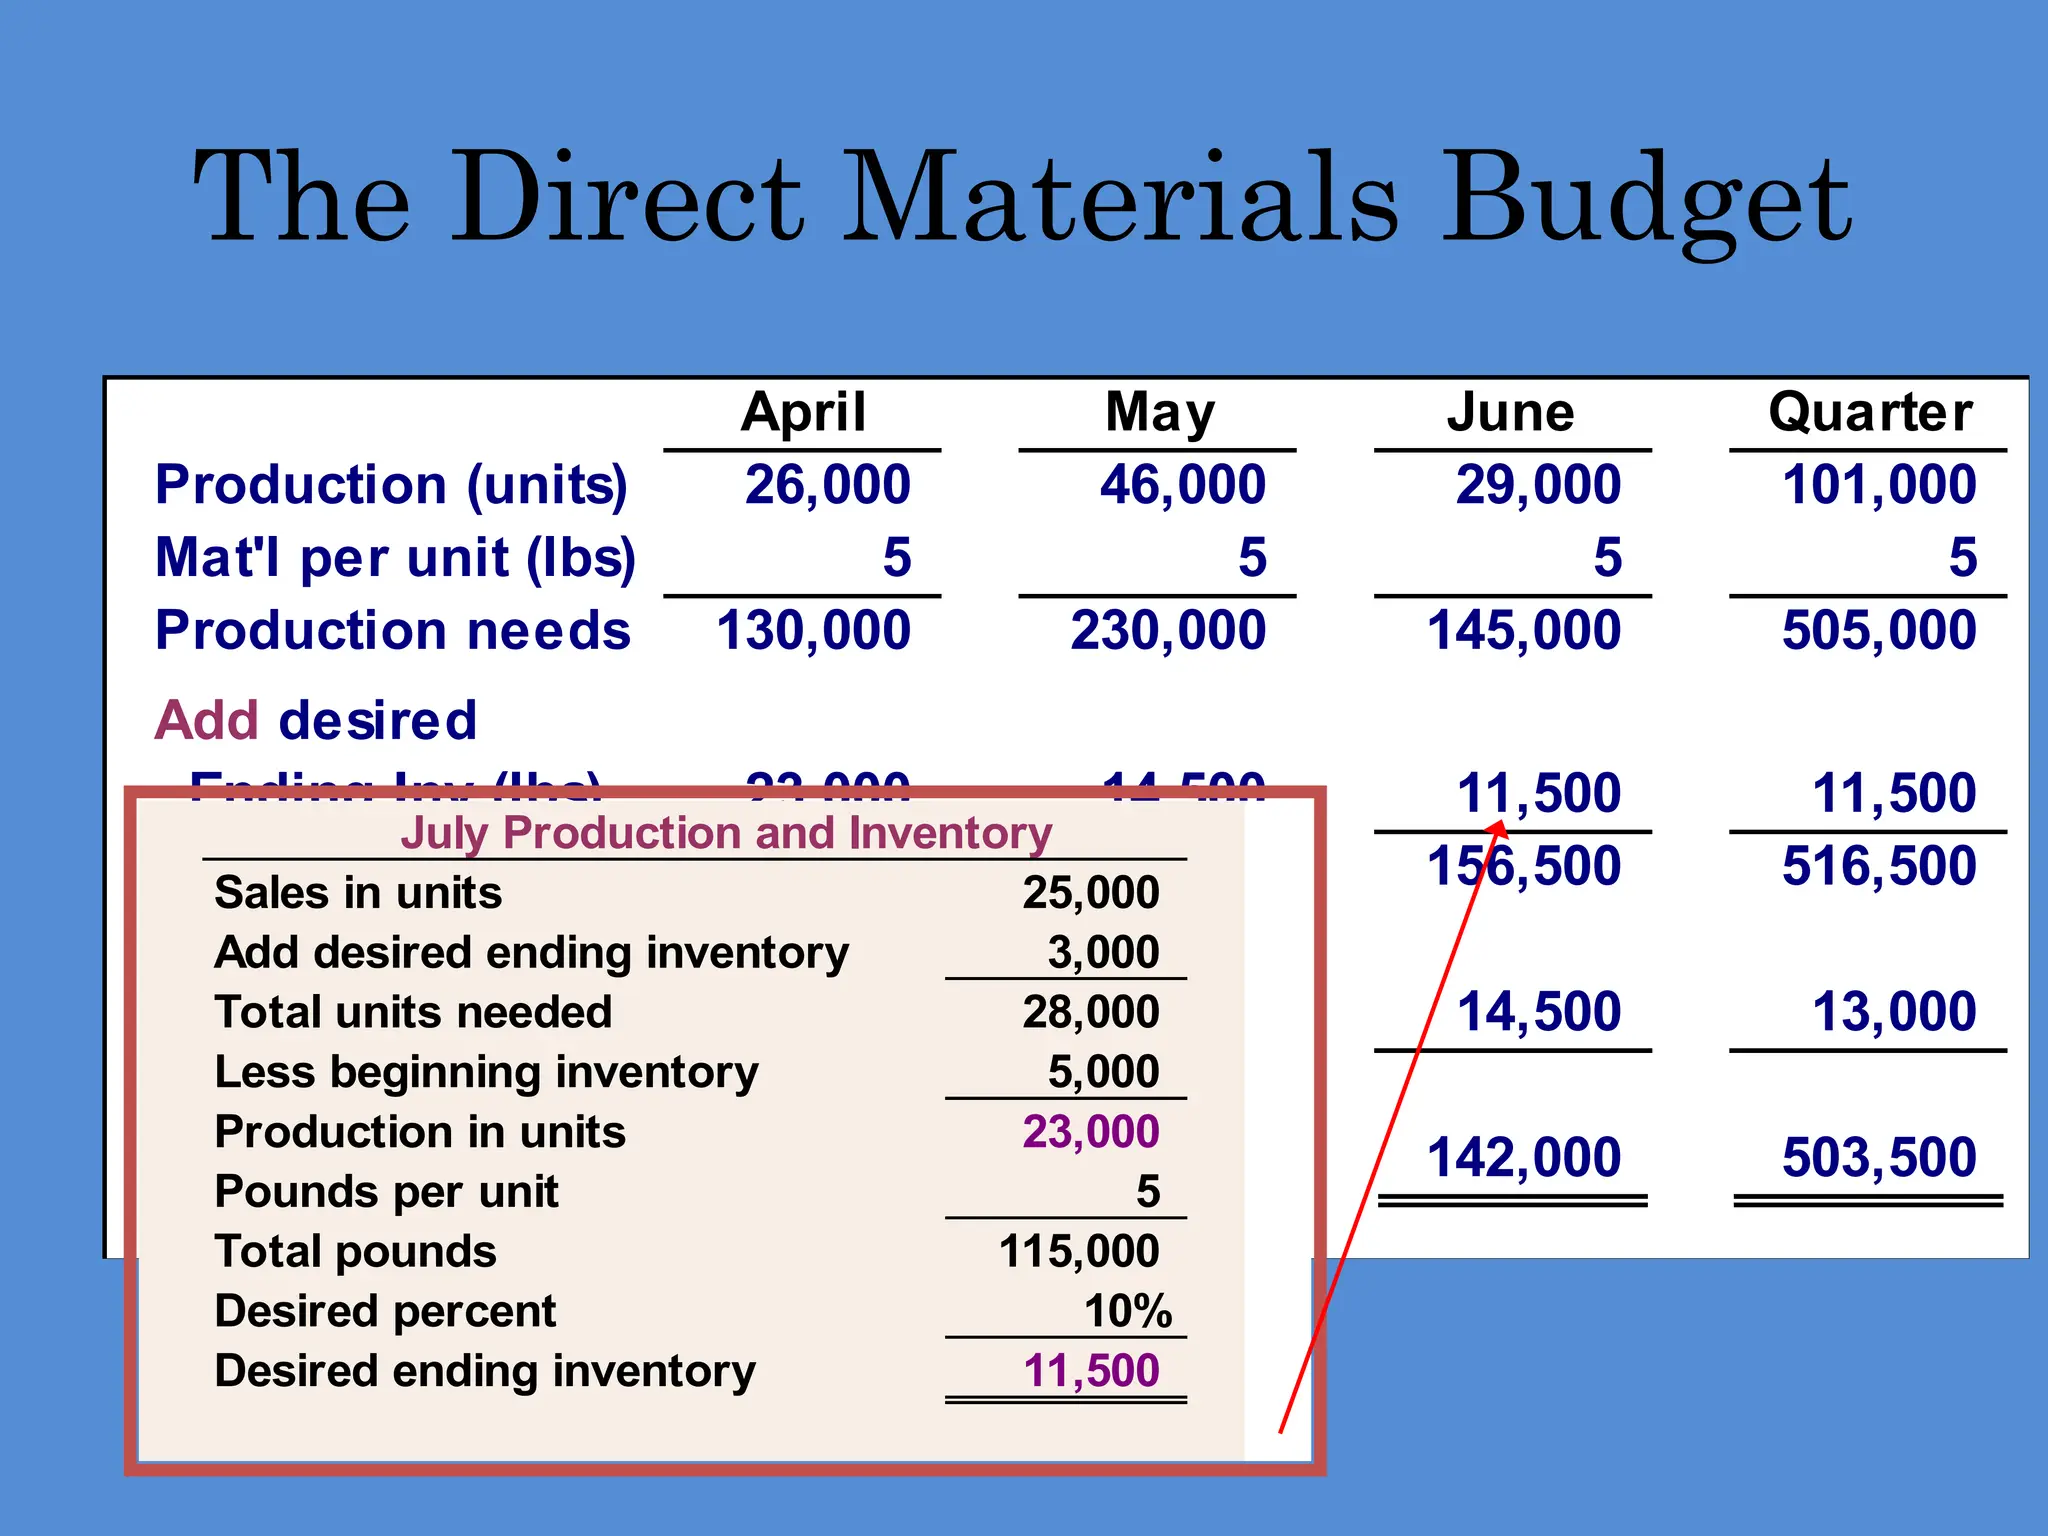
The Direct Materials Budget
July Production and Inventory
Sales in units 25,000
Add desired ending inventory 3,000
Total units needed 28,000
Less beginning inventory 5,000
Production in units 23,000
Pounds per unit 5
Total pounds 115,000
Desired percent 10%
Desired ending inventory 11,500
37.
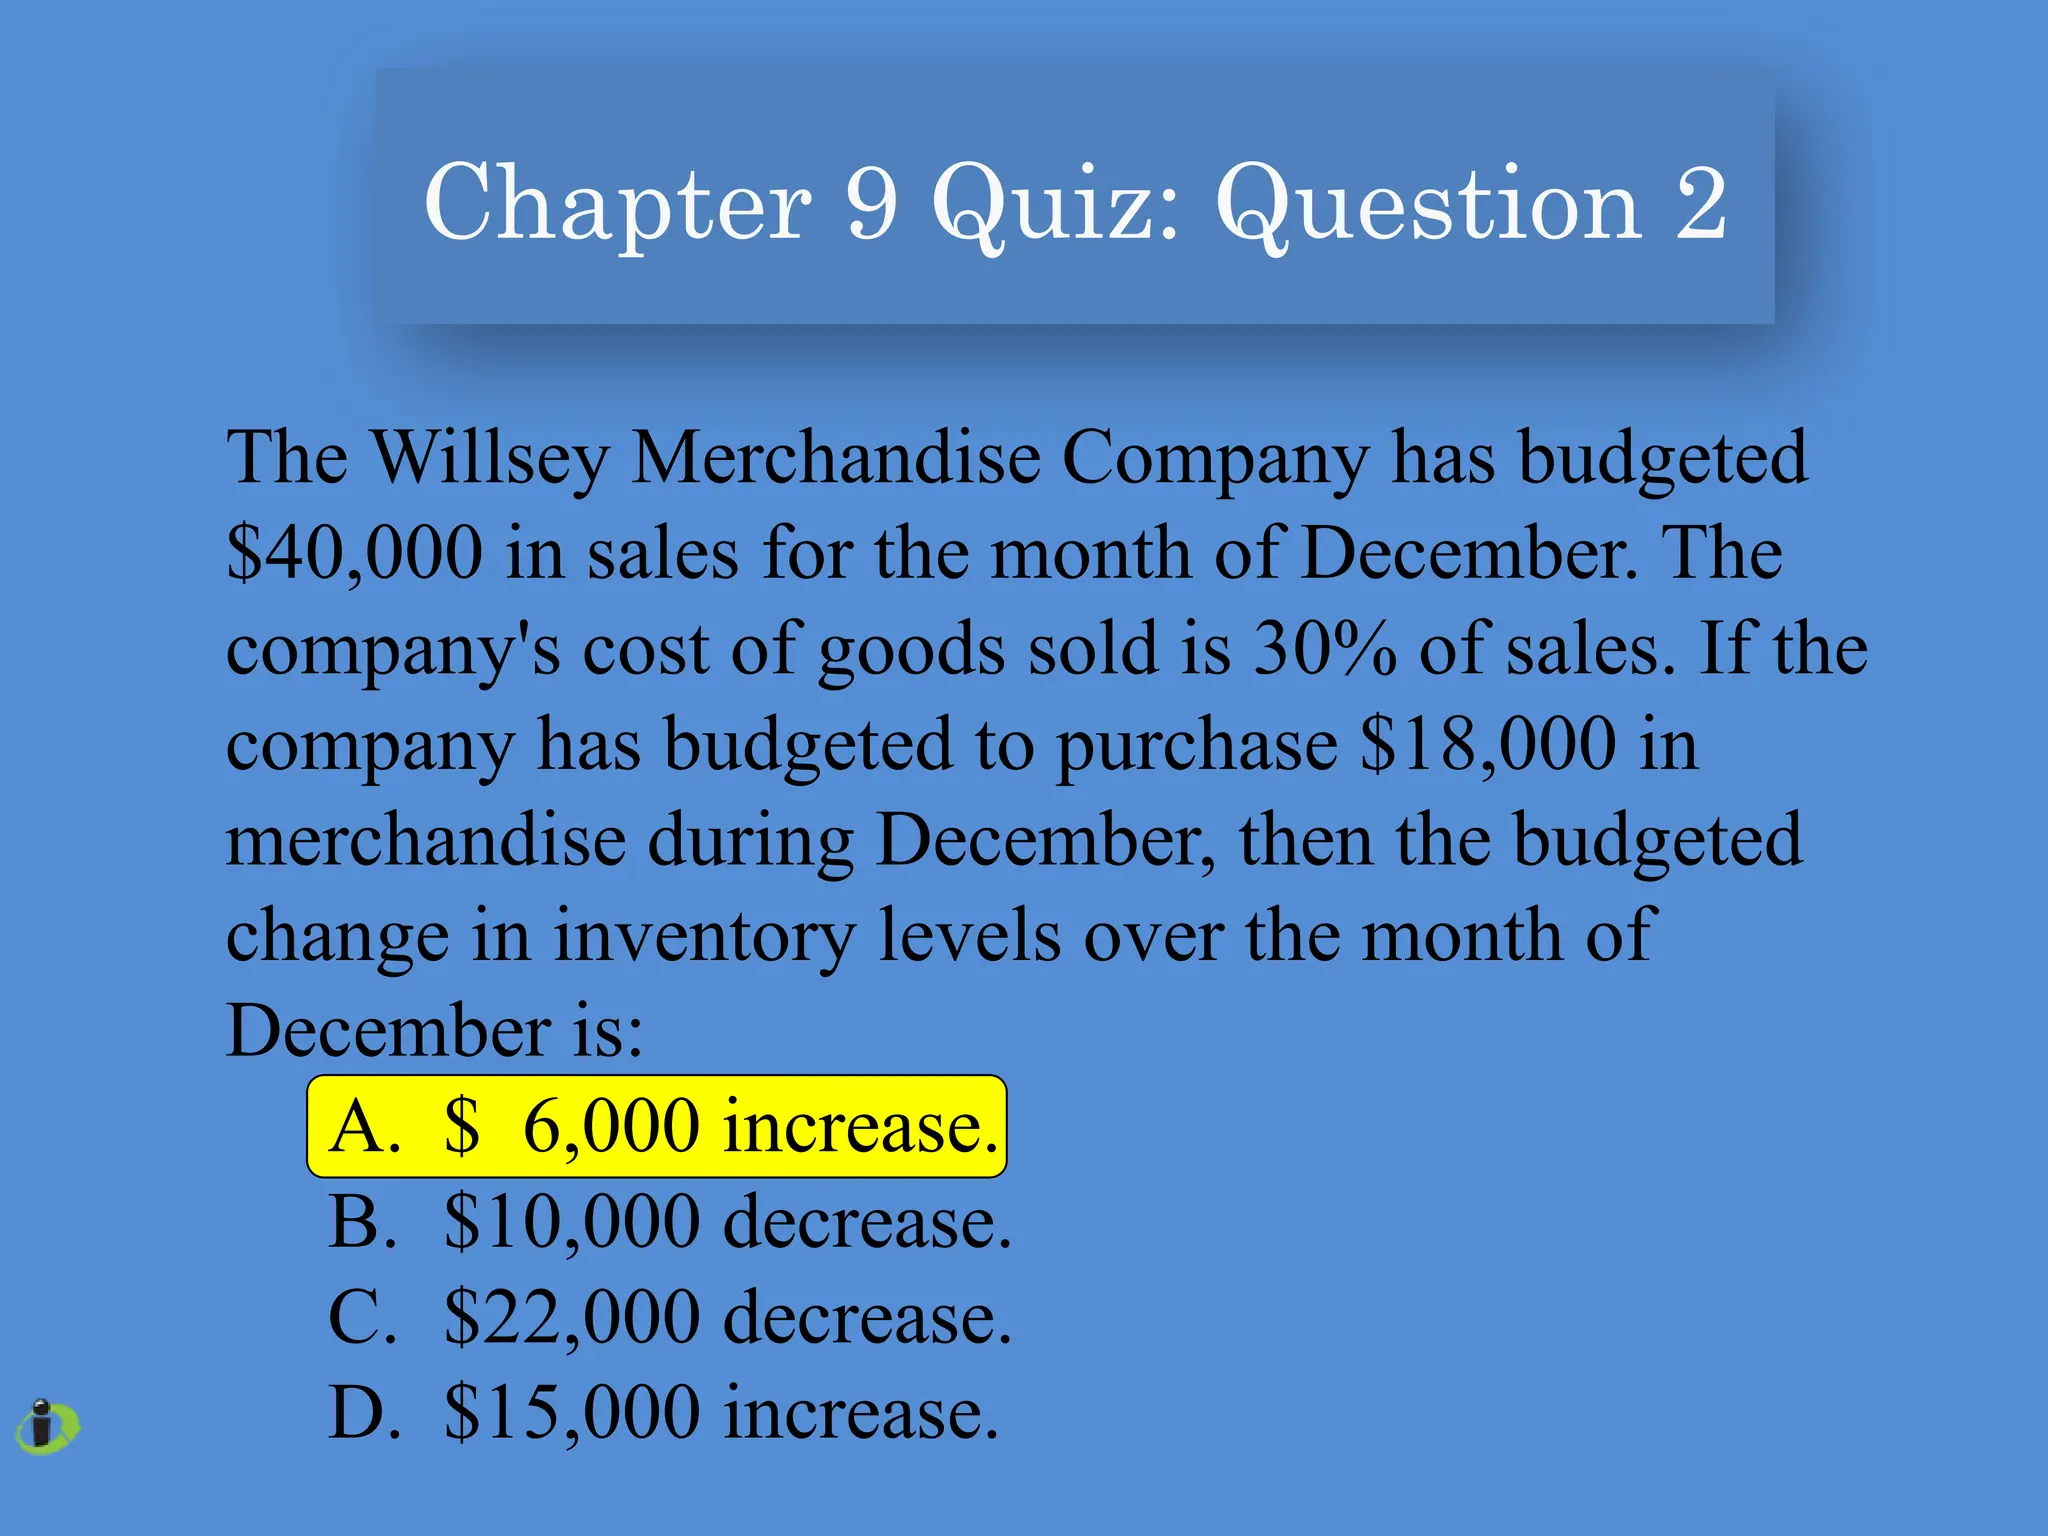
Chapter 9 Quiz:Question 2
The Willsey Merchandise Company has budgeted
$40,000 in sales for the month of December. The
company's cost of goods sold is 30% of sales. If the
company has budgeted to purchase $18,000 in
merchandise during December, then the budgeted
change in inventory levels over the month of
December is:
A. $ 6,000 increase.
B. $10,000 decrease.
C. $22,000 decrease.
D. $15,000 increase.
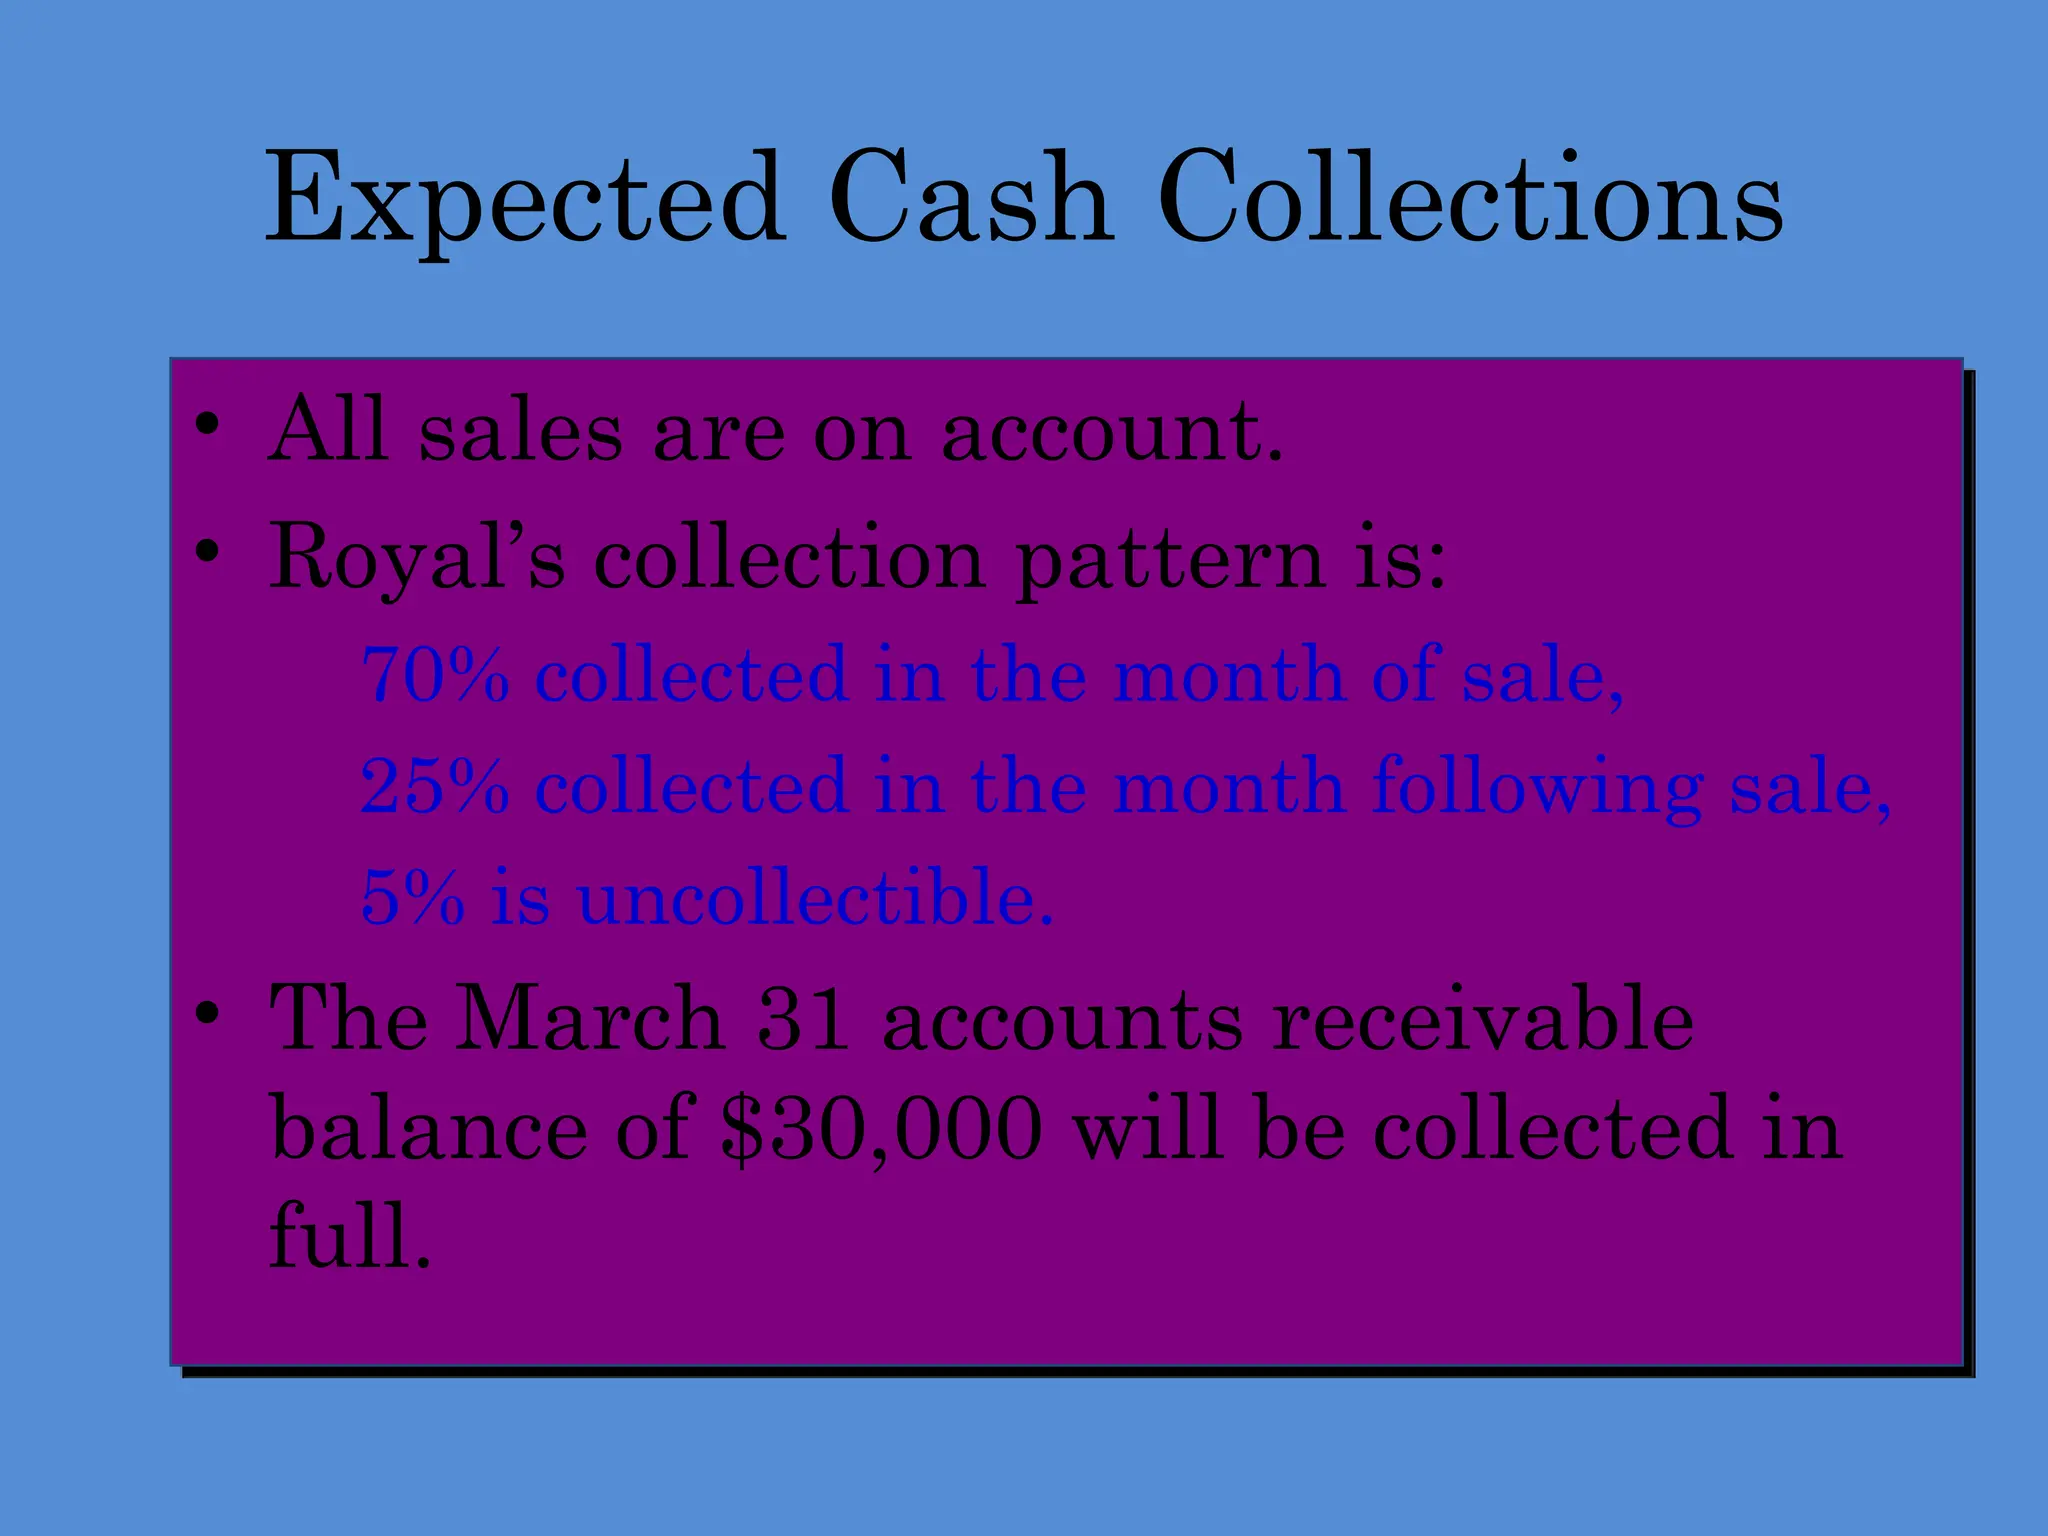
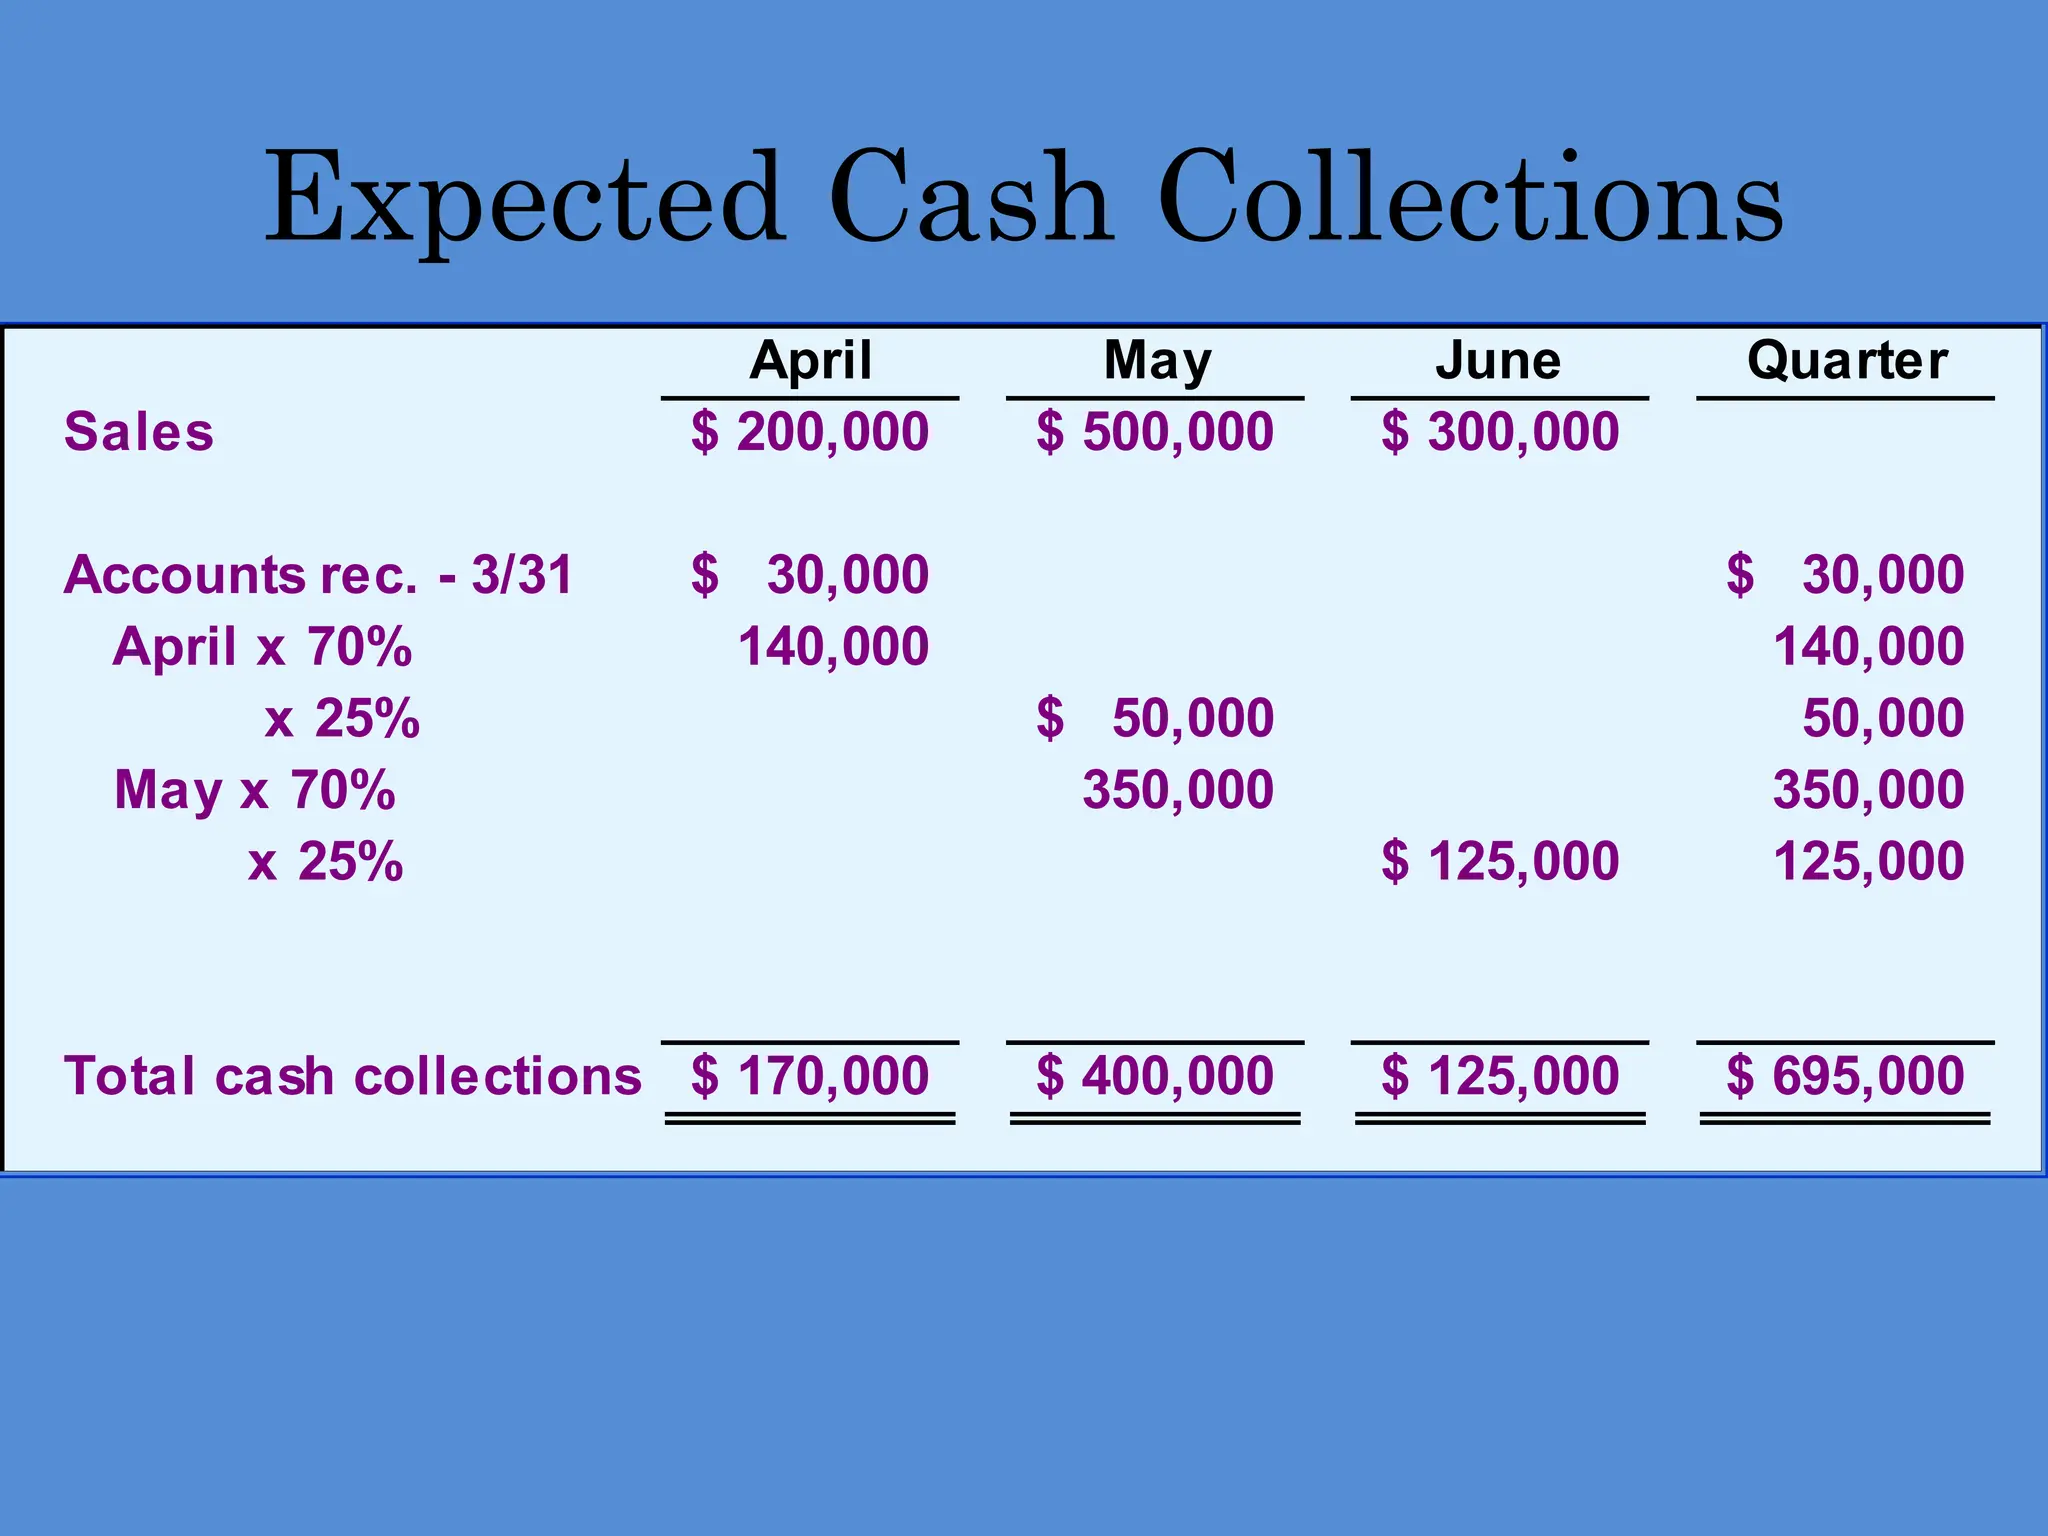
Expected Cash Collections
•All sales are on account.
• Royal’s collection pattern is:
70% collected in the month of sale,
25% collected in the month following sale,
5% is uncollectible.
• The March 31 accounts receivable
balance of $30,000 will be collected in
full.
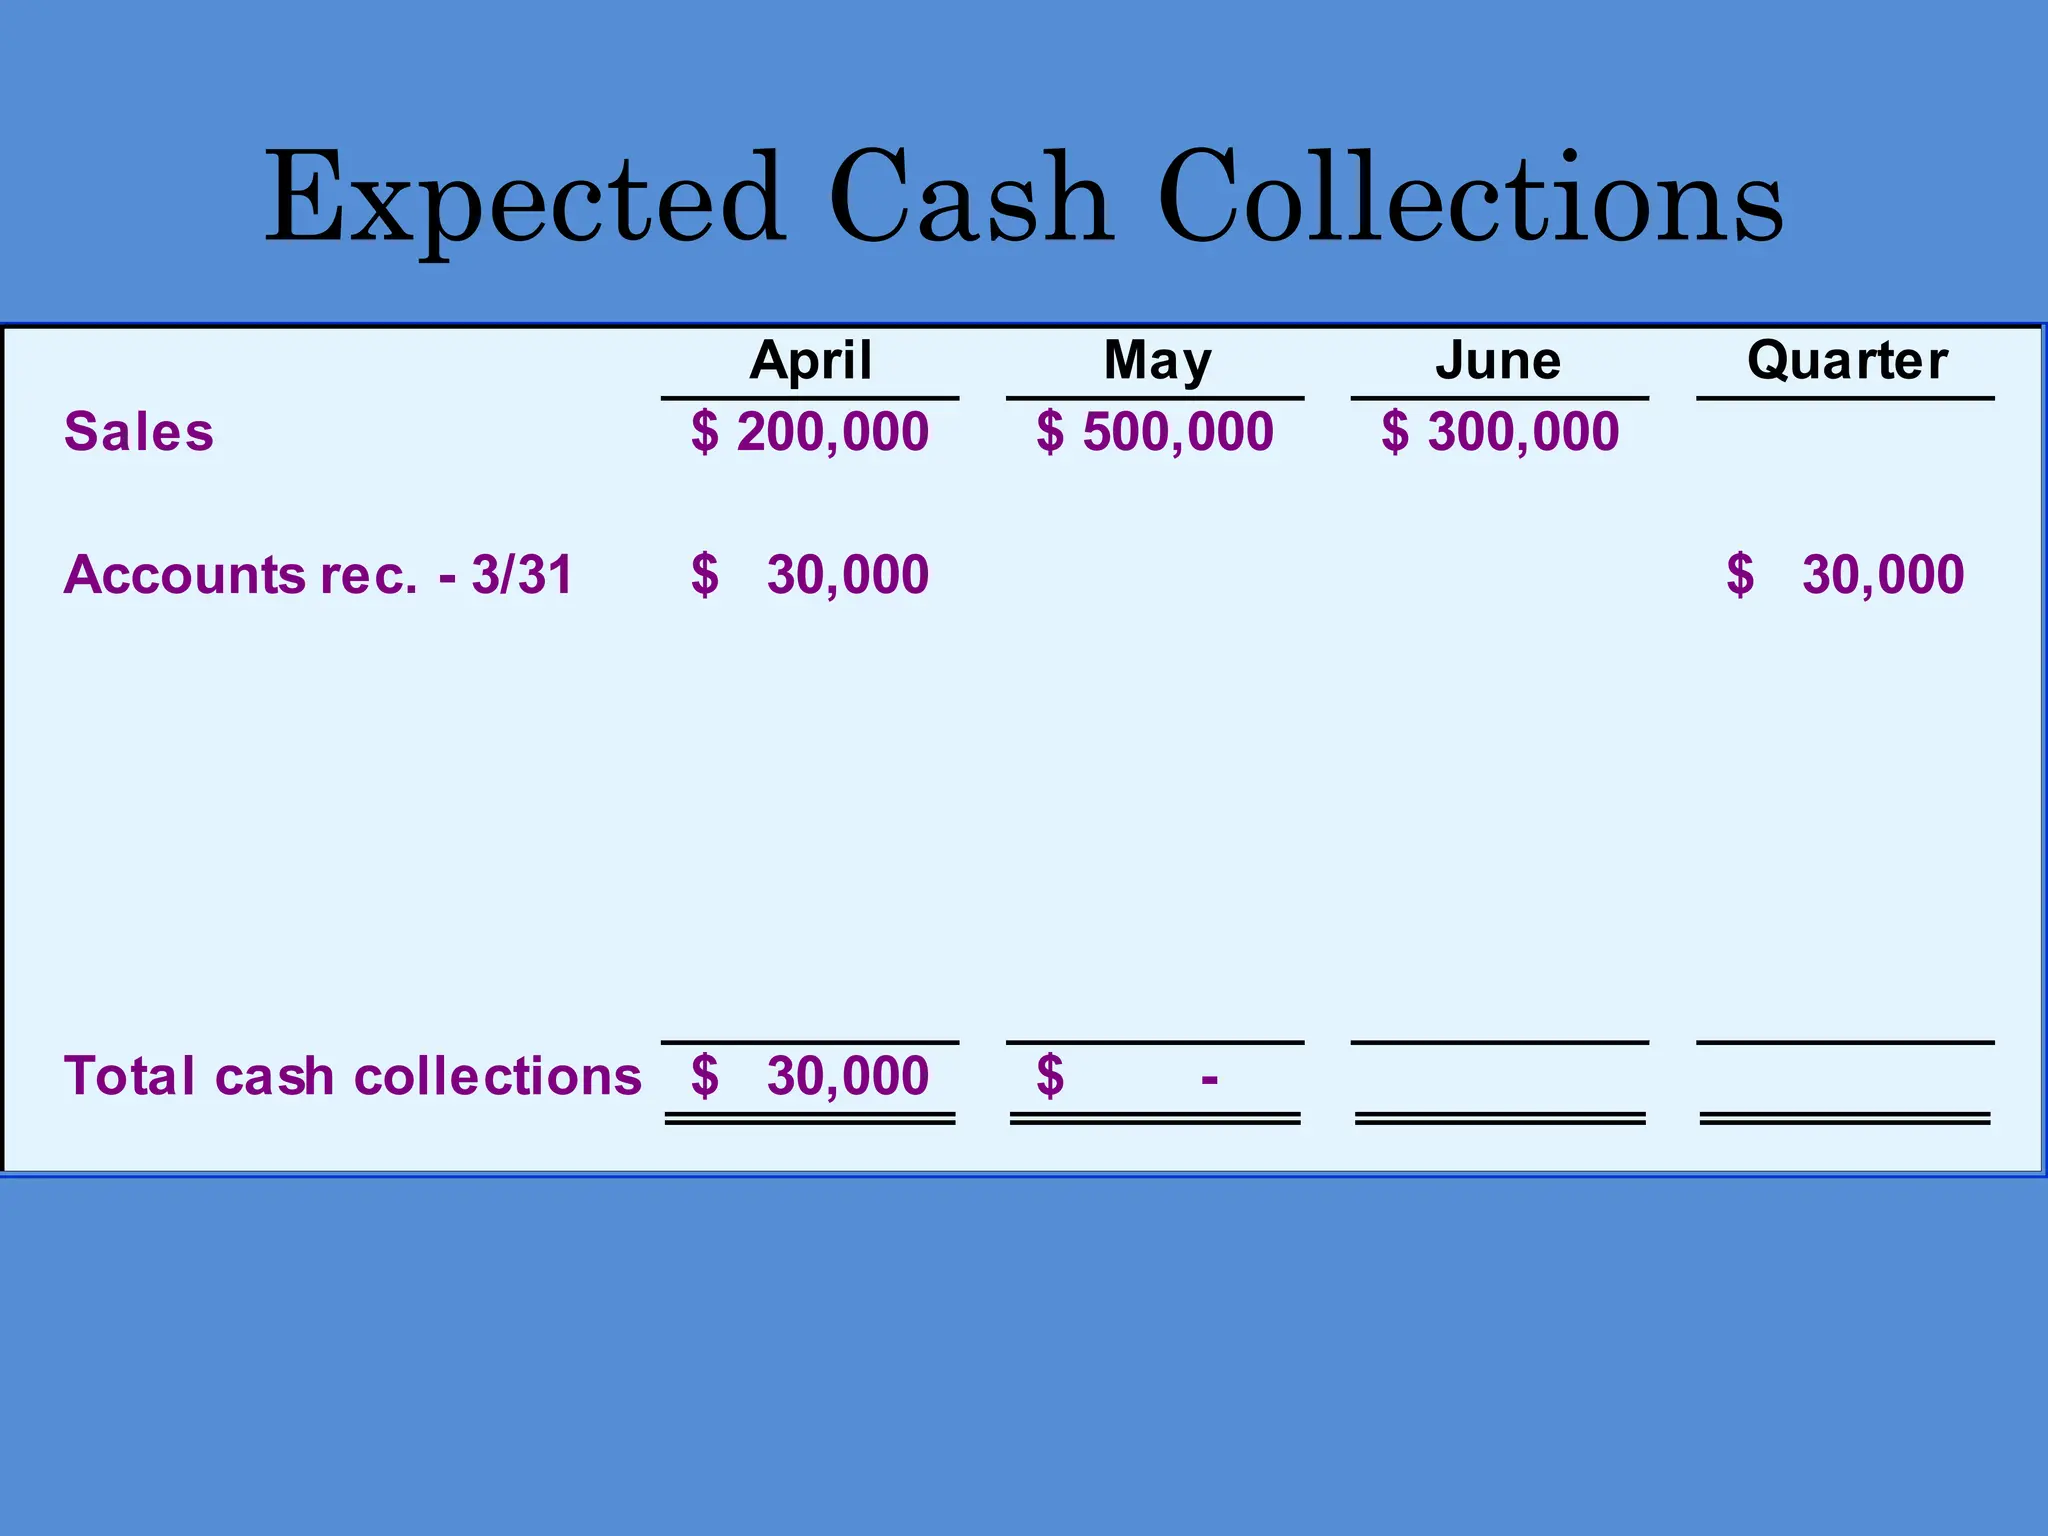
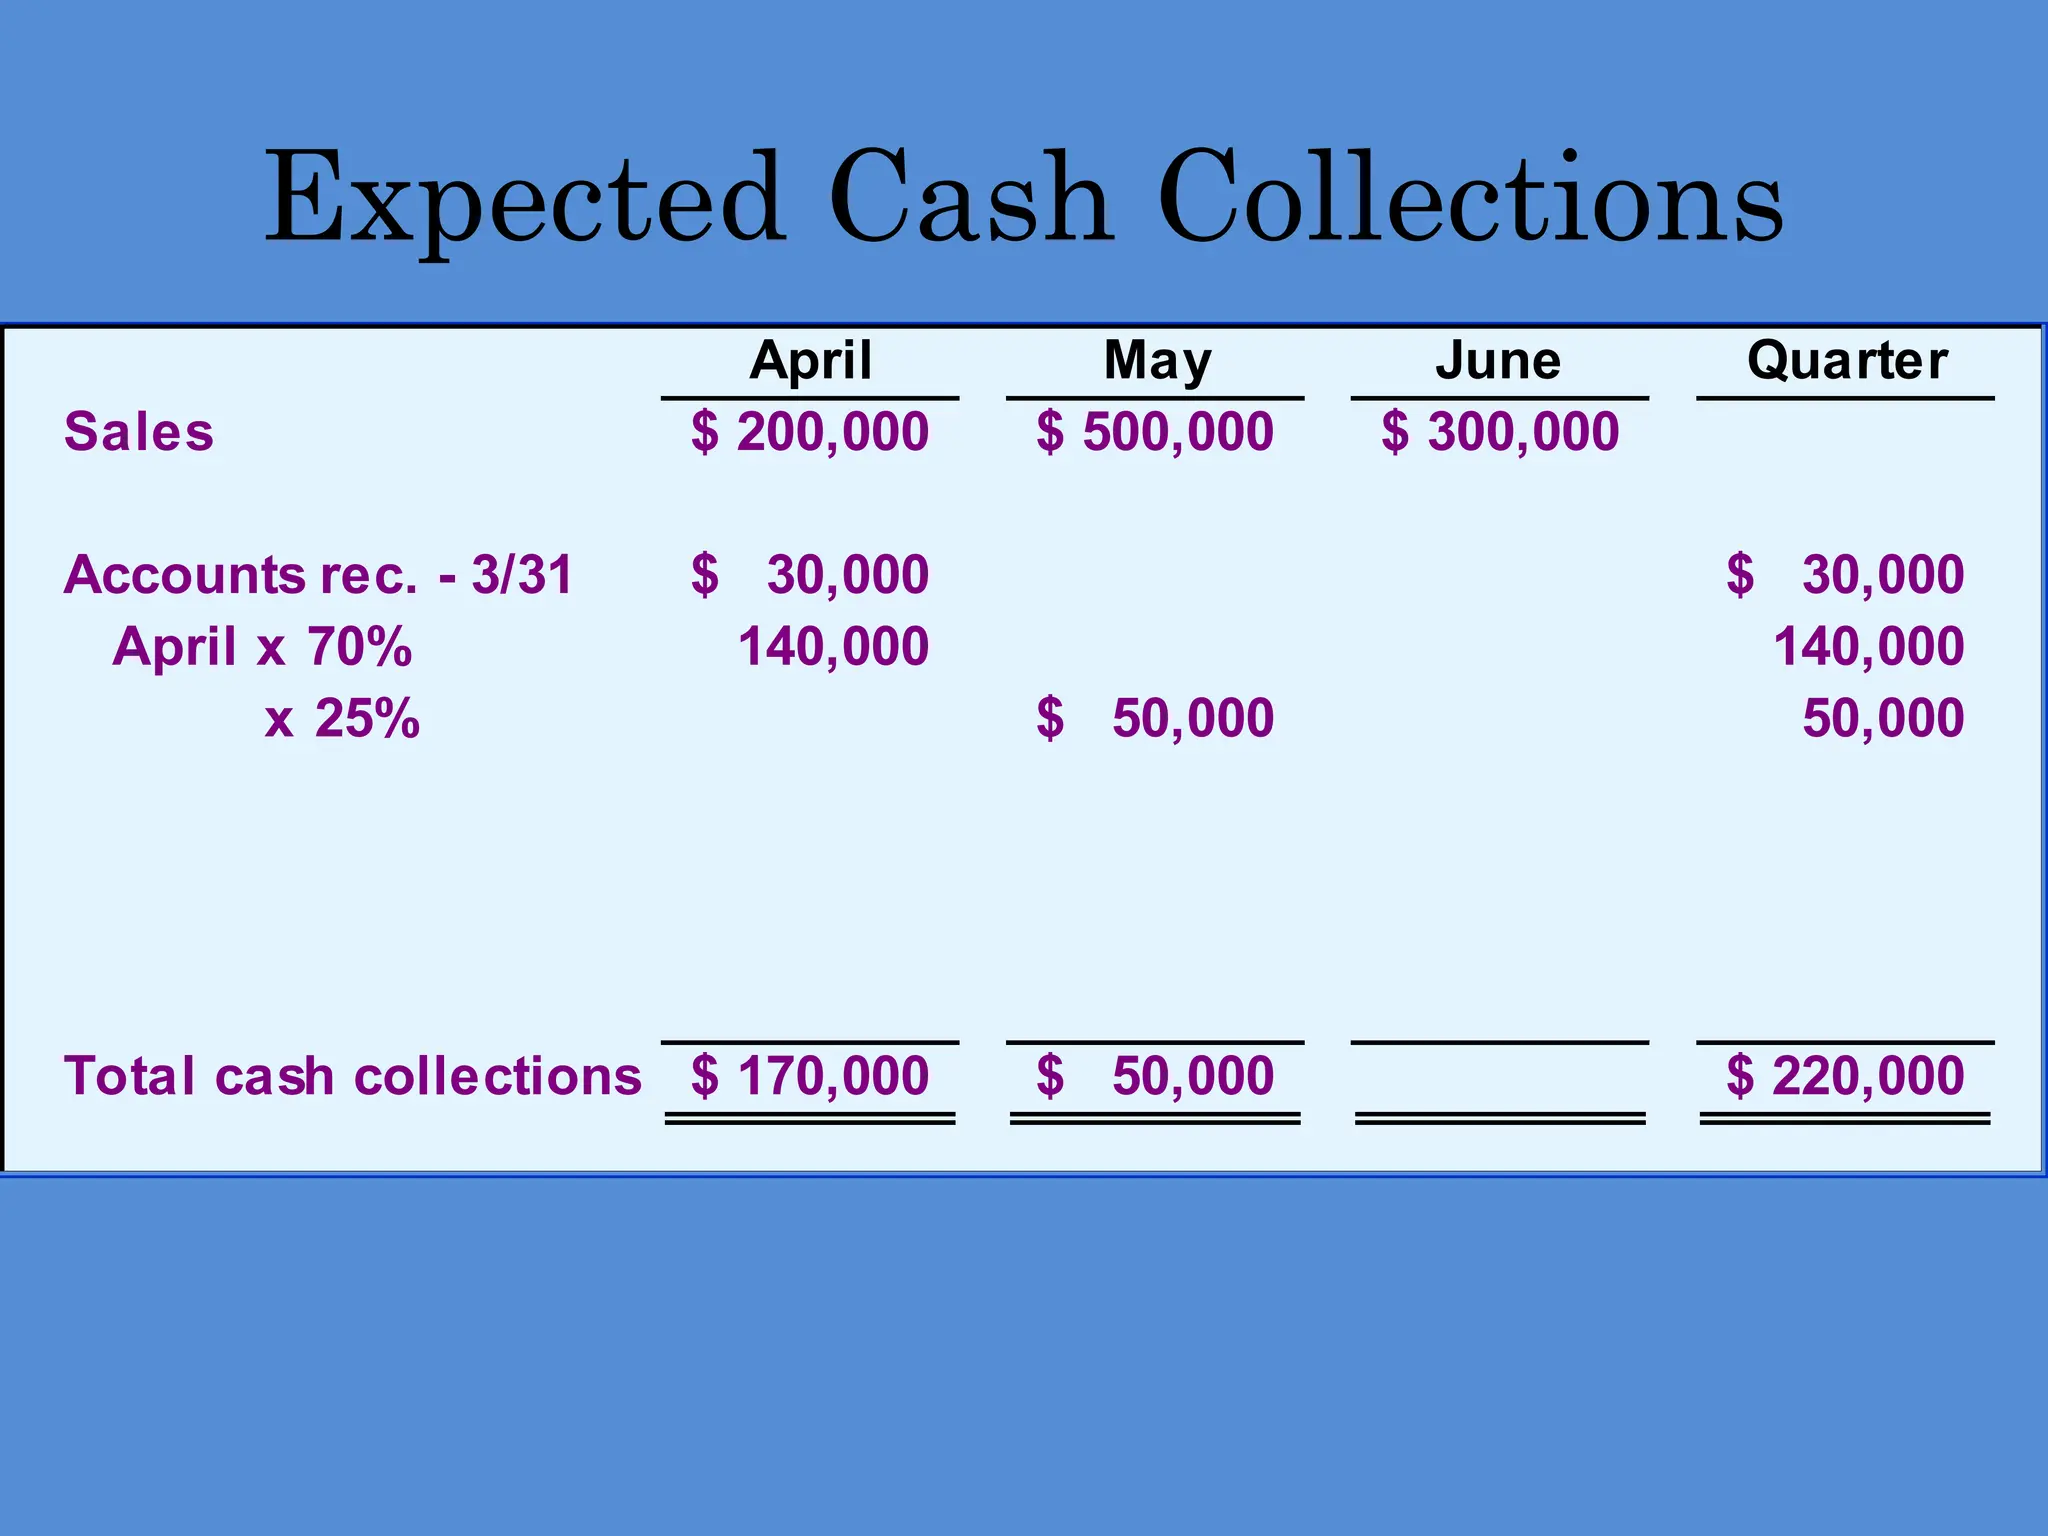
Expected Cash Collections
AprilMay June Quarter
Sales 200,000
$ 500,000
$ 300,000
$
Accounts rec. - 3/31 30,000
$ 30,000
$
April x 70% 140,000 140,000
x 25% 50,000
$ 50,000
Total cash collections 170,000
$ 50,000
$ 220,000
$
42.
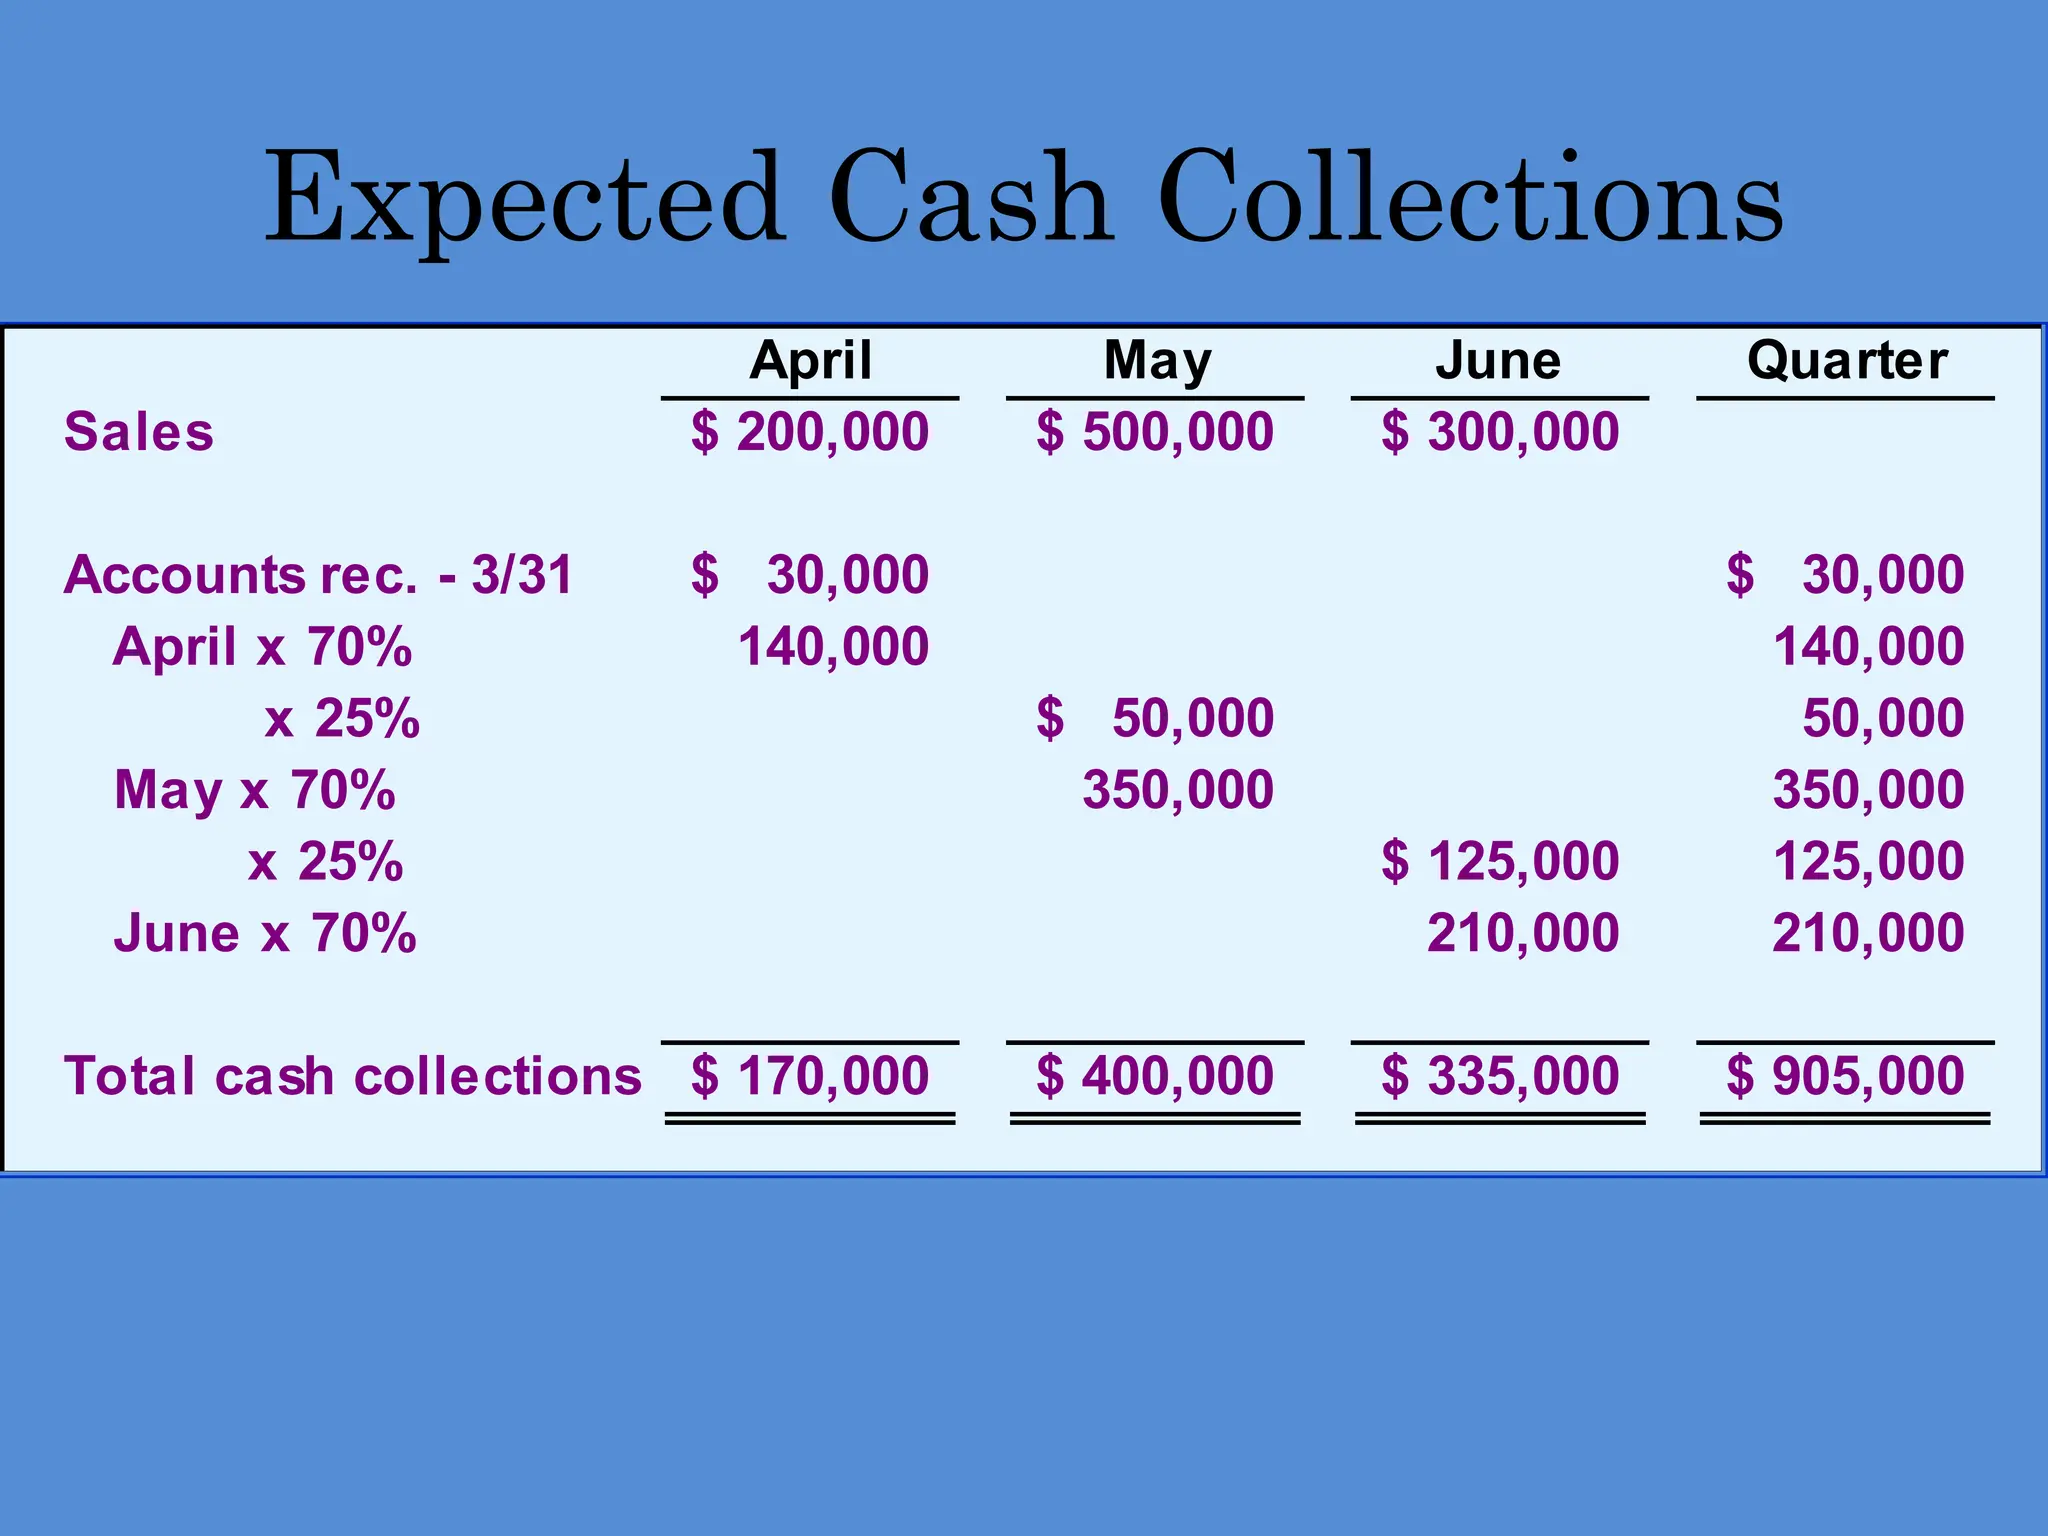
Expected Cash Collections
AprilMay June Quarter
Sales 200,000
$ 500,000
$ 300,000
$
Accounts rec. - 3/31 30,000
$ 30,000
$
April x 70% 140,000 140,000
x 25% 50,000
$ 50,000
May x 70% 350,000 350,000
x 25% 125,000
$ 125,000
Total cash collections 170,000
$ 400,000
$ 125,000
$ 695,000
$
43.
Expected Cash Collections
AprilMay June Quarter
Sales 200,000
$ 500,000
$ 300,000
$
Accounts rec. - 3/31 30,000
$ 30,000
$
April x 70% 140,000 140,000
x 25% 50,000
$ 50,000
May x 70% 350,000 350,000
x 25% 125,000
$ 125,000
June x 70% 210,000 210,000
Total cash collections 170,000
$ 400,000
$ 335,000
$ 905,000
$
44.
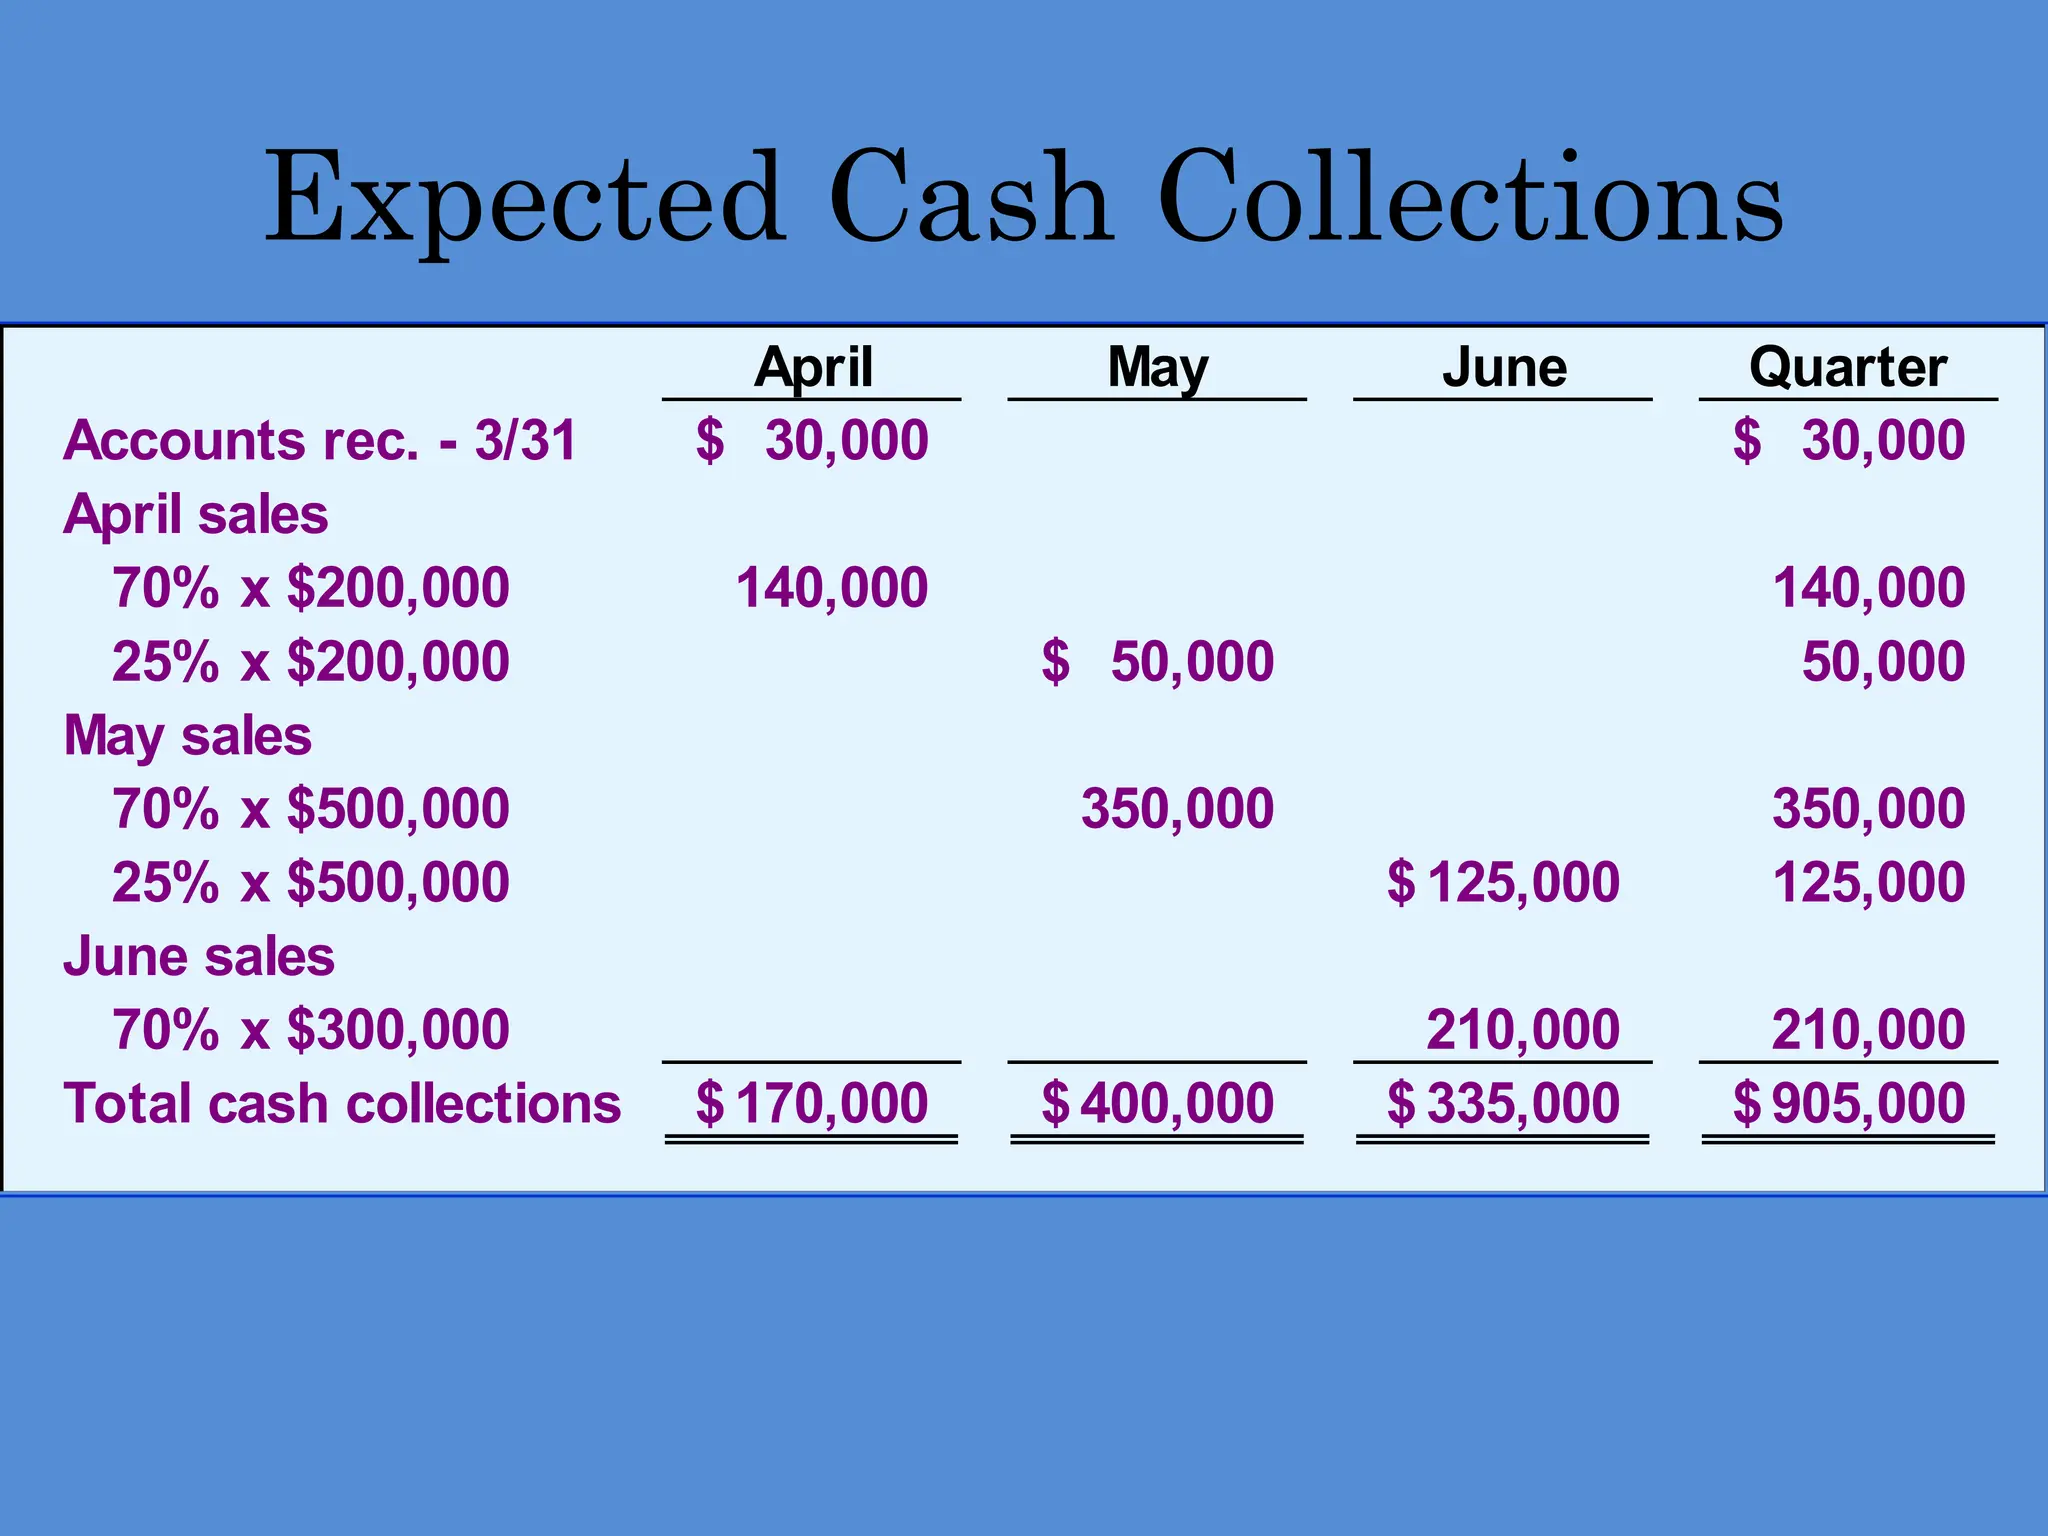
Expected Cash Collections
AprilMay June Quarter
Accounts rec. - 3/31 30,000
$ 30,000
$
April sales
70% x $200,000 140,000 140,000
25% x $200,000 50,000
$ 50,000
May sales
70% x $500,000 350,000 350,000
25% x $500,000 125,000
$ 125,000
June sales
70% x $300,000 210,000 210,000
Total cash collections 170,000
$ 400,000
$ 335,000
$ 905,000
$
45.
Chapter 9 Quiz:Question 3
Avril Company collects it’s A/R as follows:
30% in the month of sale
60% in the month following sale
8% in the 2nd
month following sale
The following sales are expected:
Jan....$100,000 Feb....$120,000 Mar....$110,000
Cash collections in March should be budgeted at:
A. $110,000. C. $105,000.
B. $110,800. D. $113,000.
46.
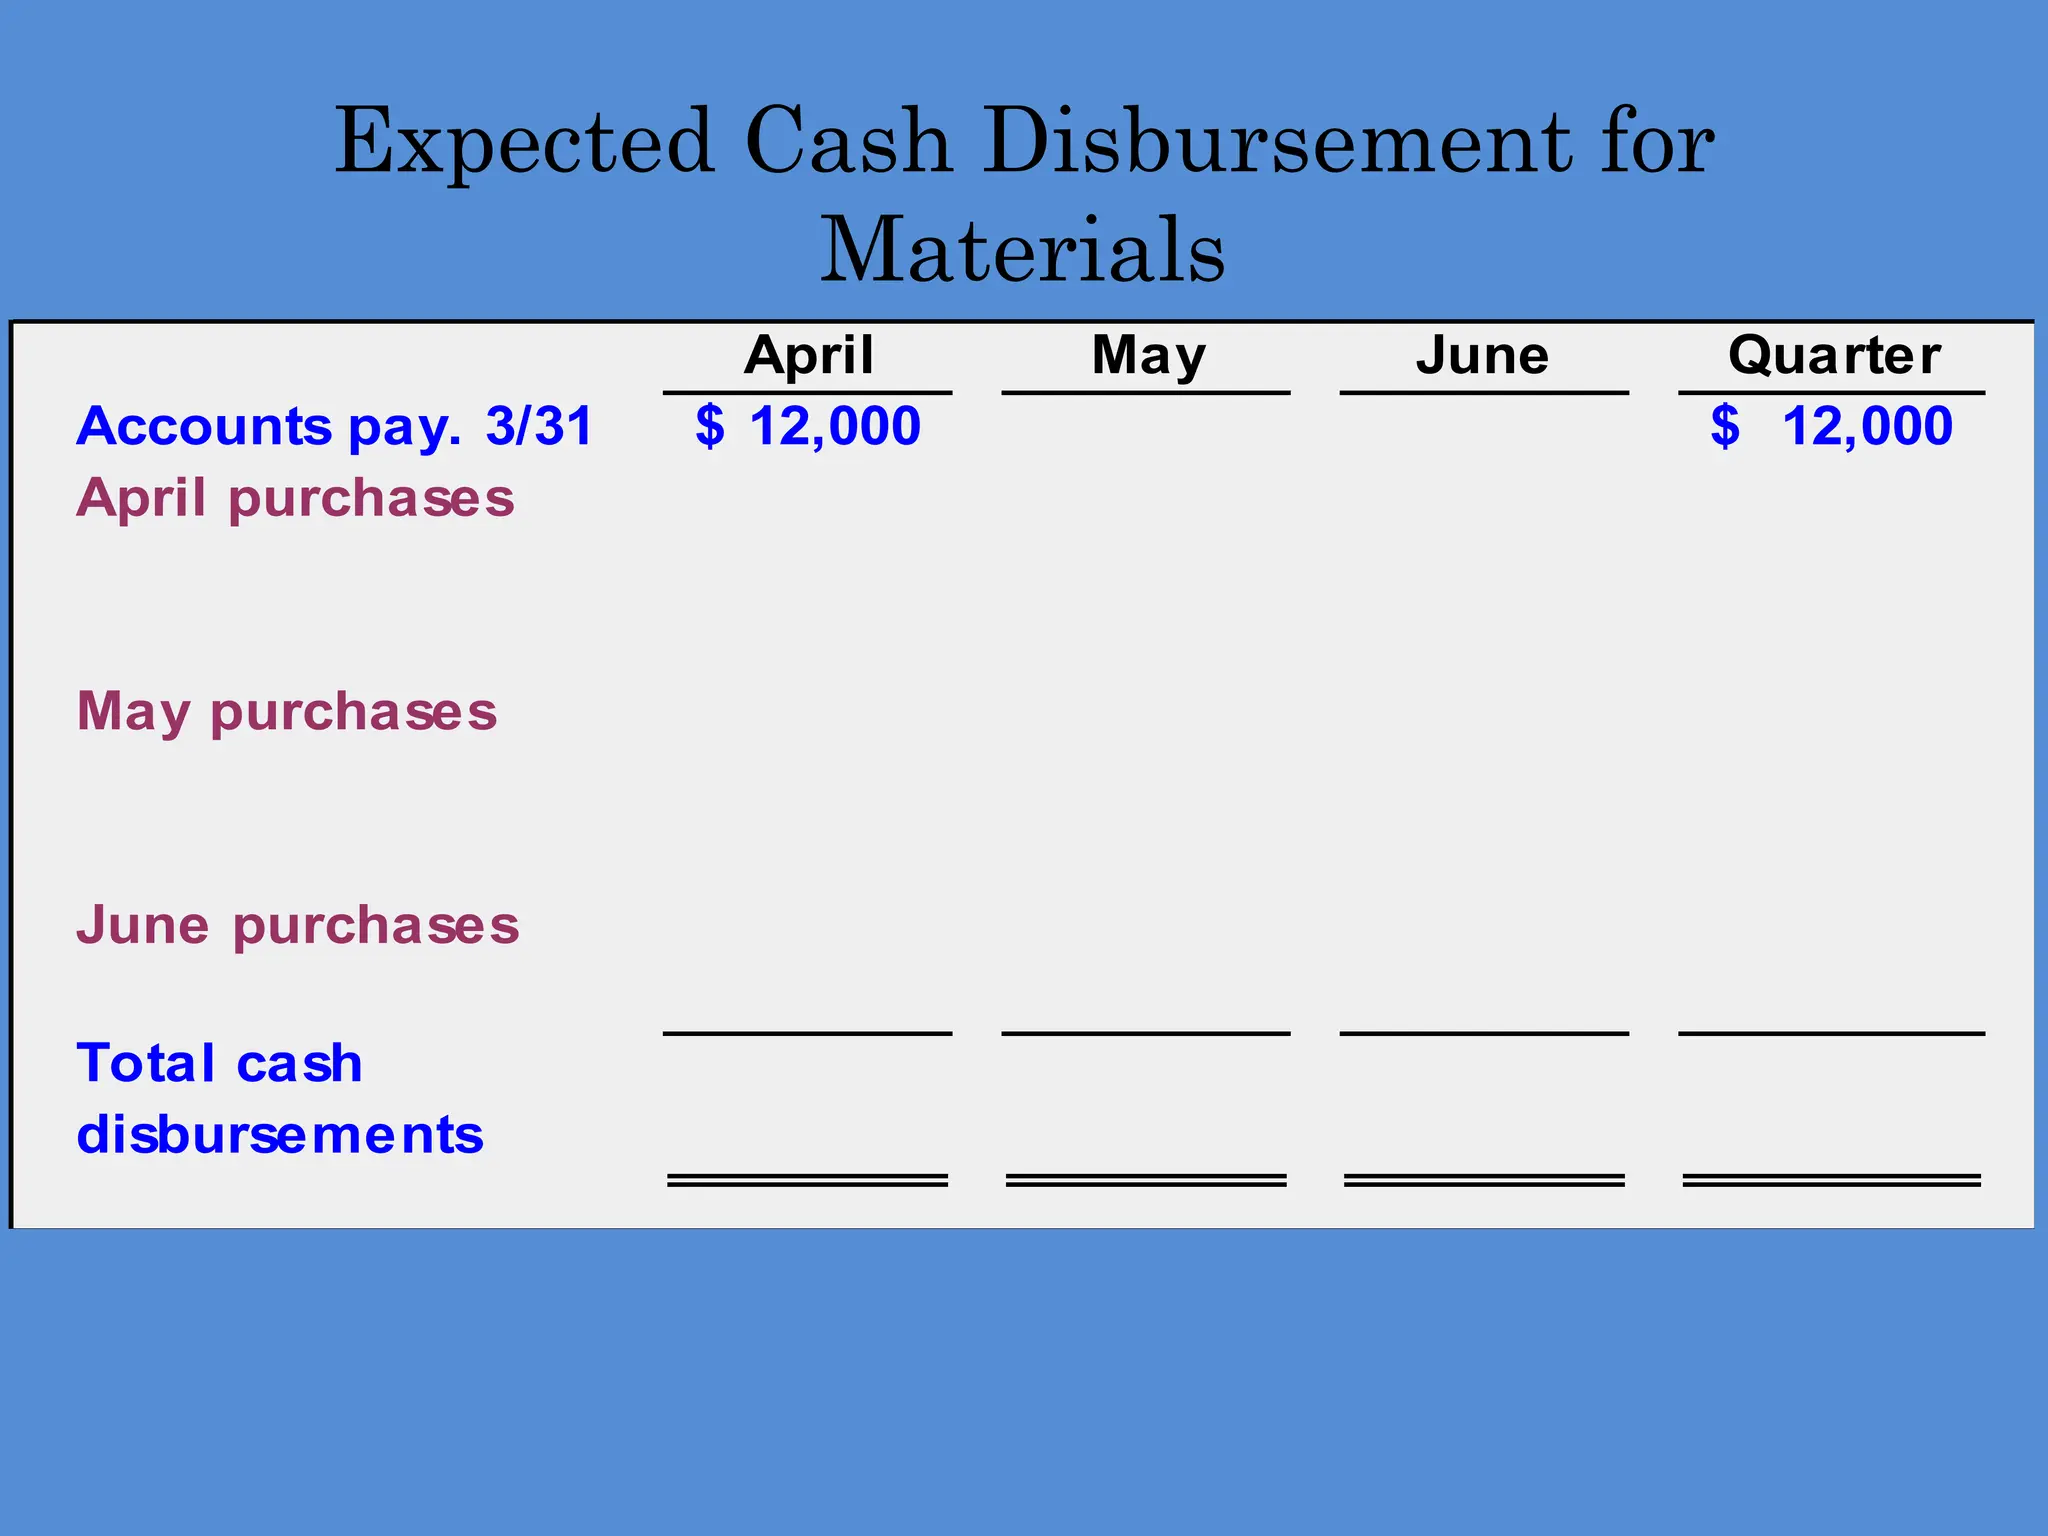
Expected Cash Disbursementfor
Materials
• Royal pays $0.40 per pound for its
materials.
• One-half of a month’s purchases are paid
for in the month of purchase; the other
half is paid in the following month.
• The March 31 accounts payable balance
is $12,000.
Let’s calculate expected cash
disbursements.
47.
Expected Cash Disbursementfor
Materials
April May June Quarter
Accounts pay. 3/31 12,000
$ 12,000
$
April purchases
May purchases
June purchases
Total cash
disbursements
48.
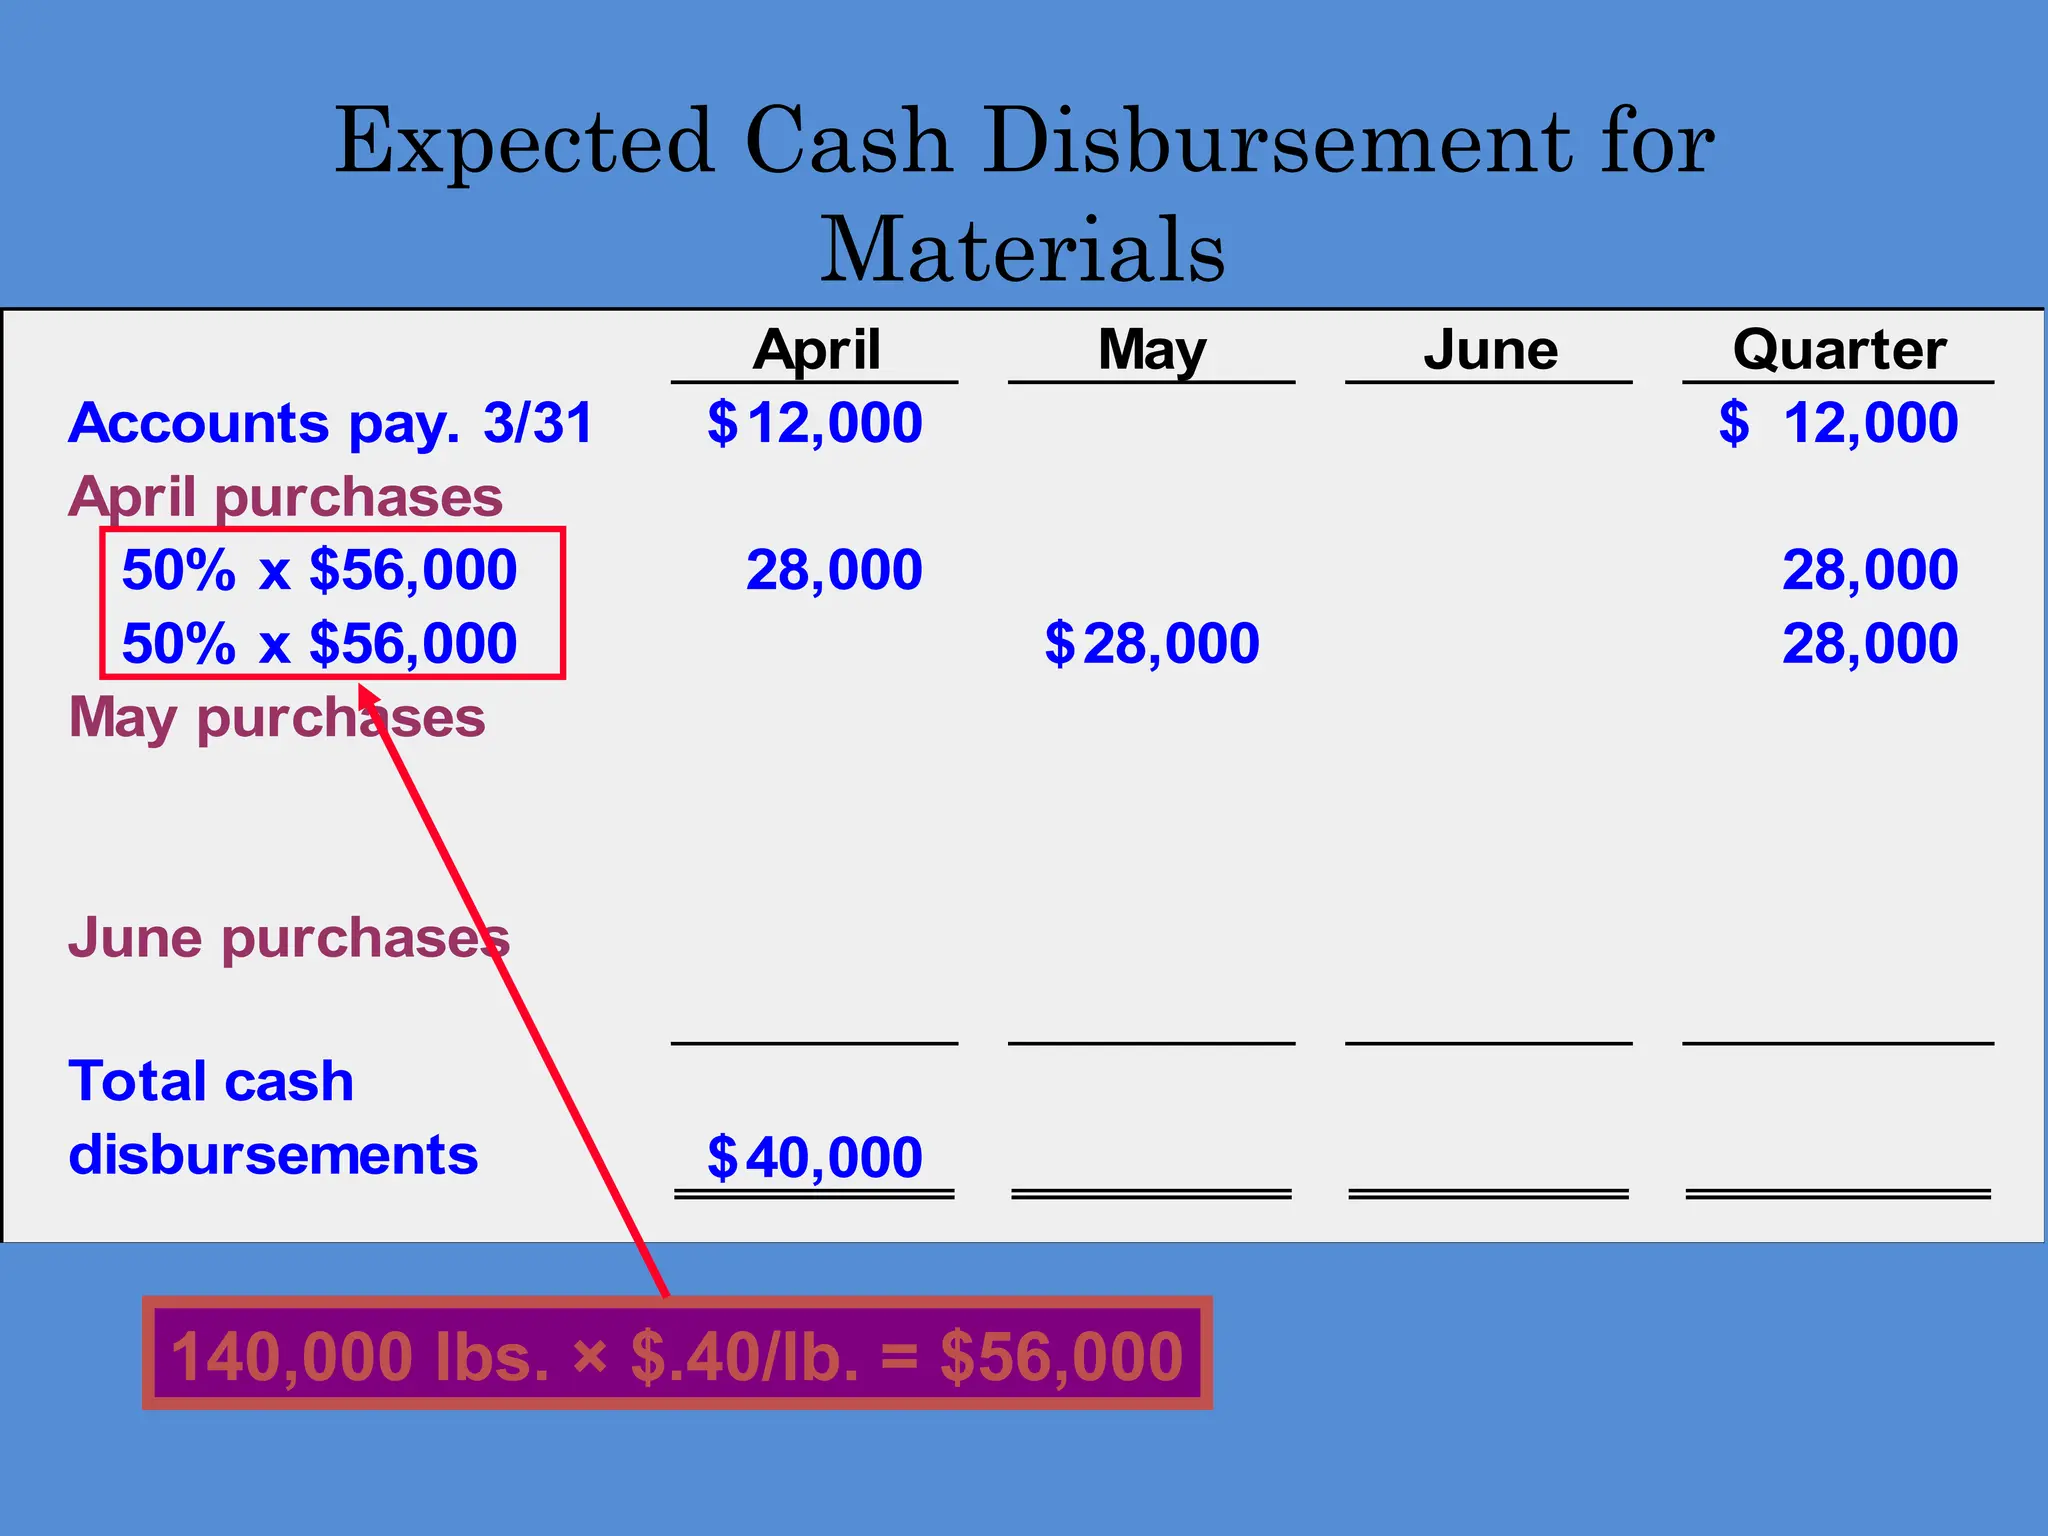
April May JuneQuarter
Accounts pay. 3/31 12,000
$ 12,000
$
April purchases
50% x $56,000 28,000 28,000
50% x $56,000 28,000
$ 28,000
May purchases
June purchases
Total cash
disbursements 40,000
$
Expected Cash Disbursement for
Materials
140,000 lbs. × $.40/lb. = $56,000
49.
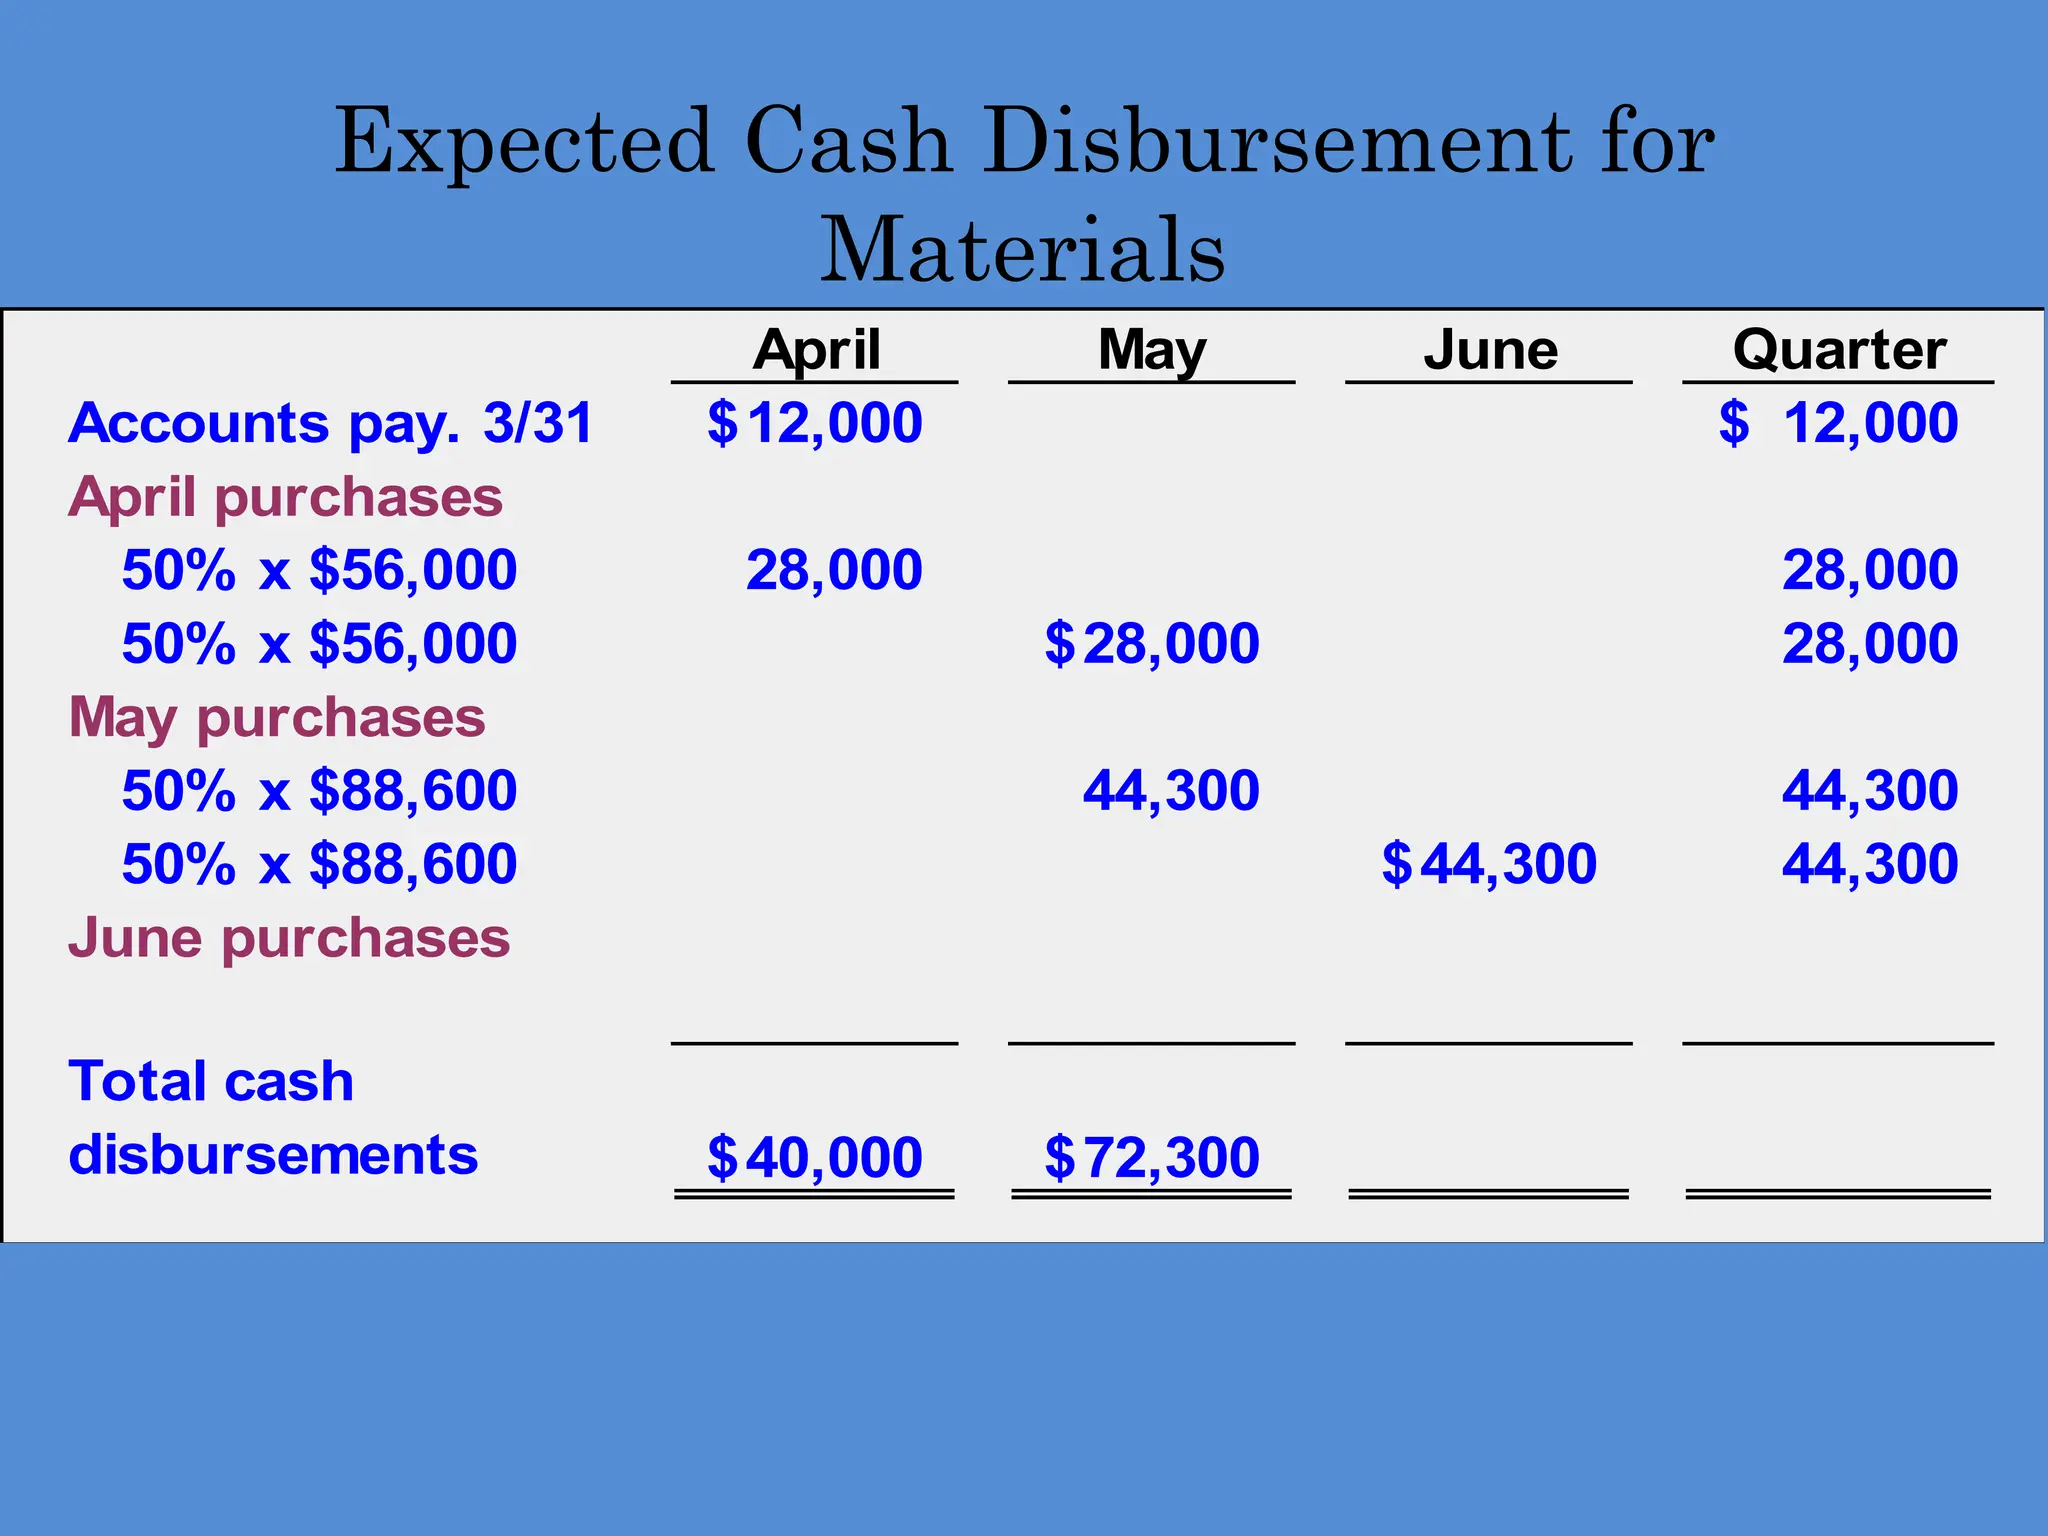
Expected Cash Disbursementfor
Materials
April May June Quarter
Accounts pay. 3/31 12,000
$ 12,000
$
April purchases
50% x $56,000 28,000 28,000
50% x $56,000 28,000
$ 28,000
May purchases
50% x $88,600 44,300 44,300
50% x $88,600 44,300
$ 44,300
June purchases
Total cash
disbursements 40,000
$ 72,300
$
50.
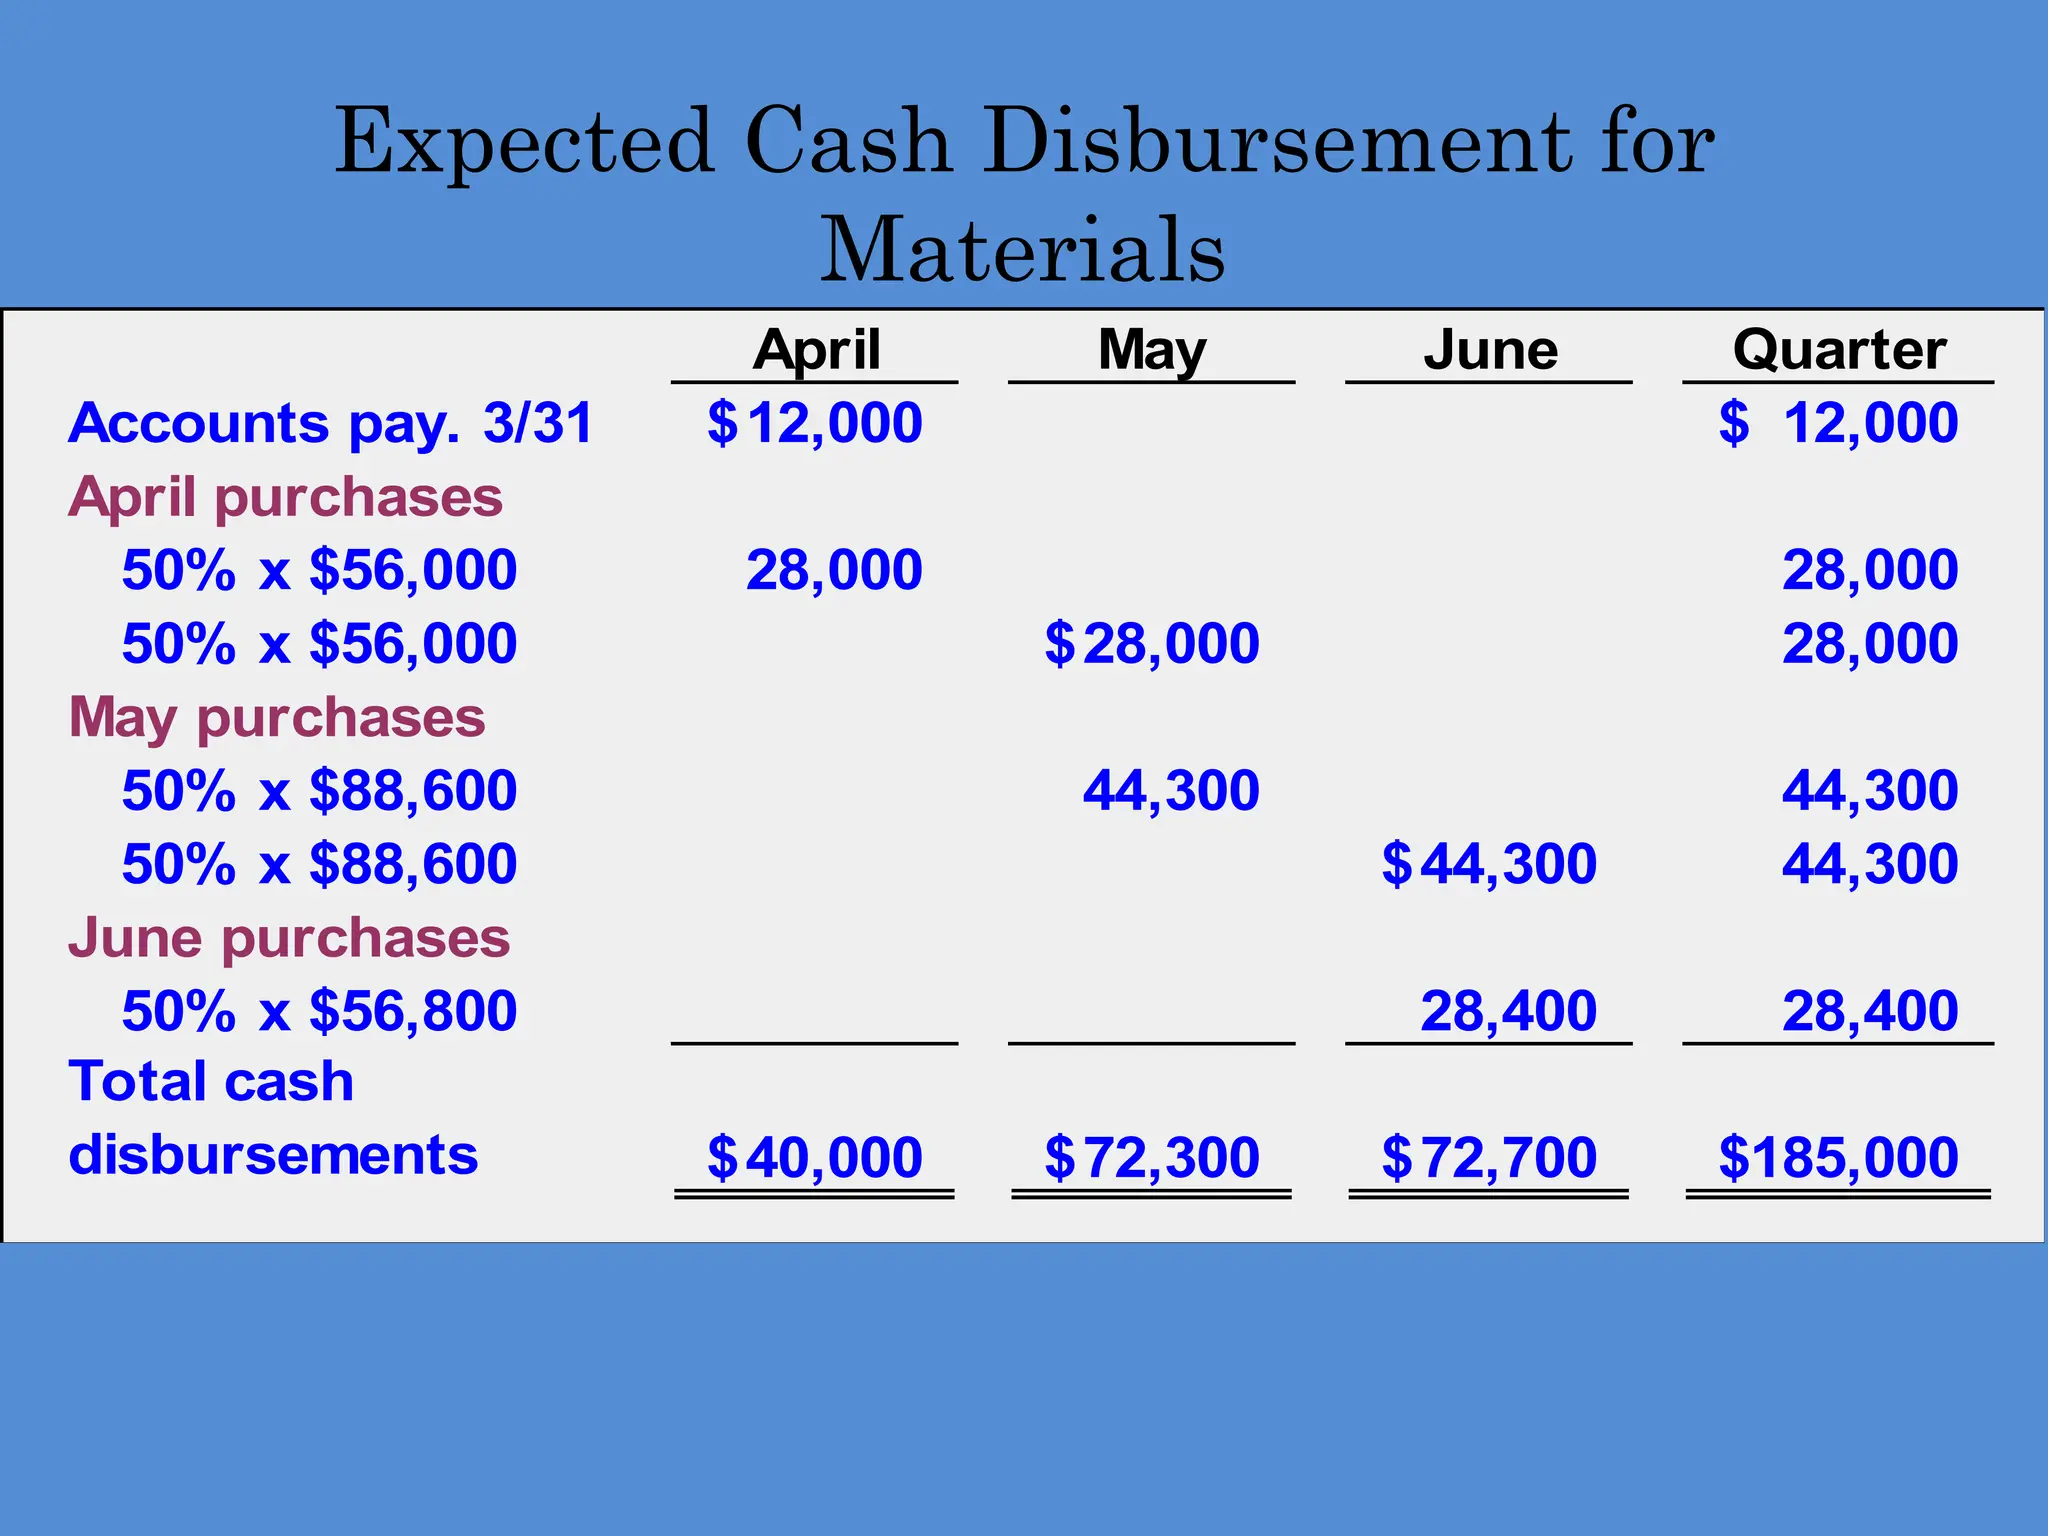
Expected Cash Disbursementfor
Materials
April May June Quarter
Accounts pay. 3/31 12,000
$ 12,000
$
April purchases
50% x $56,000 28,000 28,000
50% x $56,000 28,000
$ 28,000
May purchases
50% x $88,600 44,300 44,300
50% x $88,600 44,300
$ 44,300
June purchases
50% x $56,800 28,400 28,400
Total cash
disbursements 40,000
$ 72,300
$ 72,700
$ 185,000
$
51.
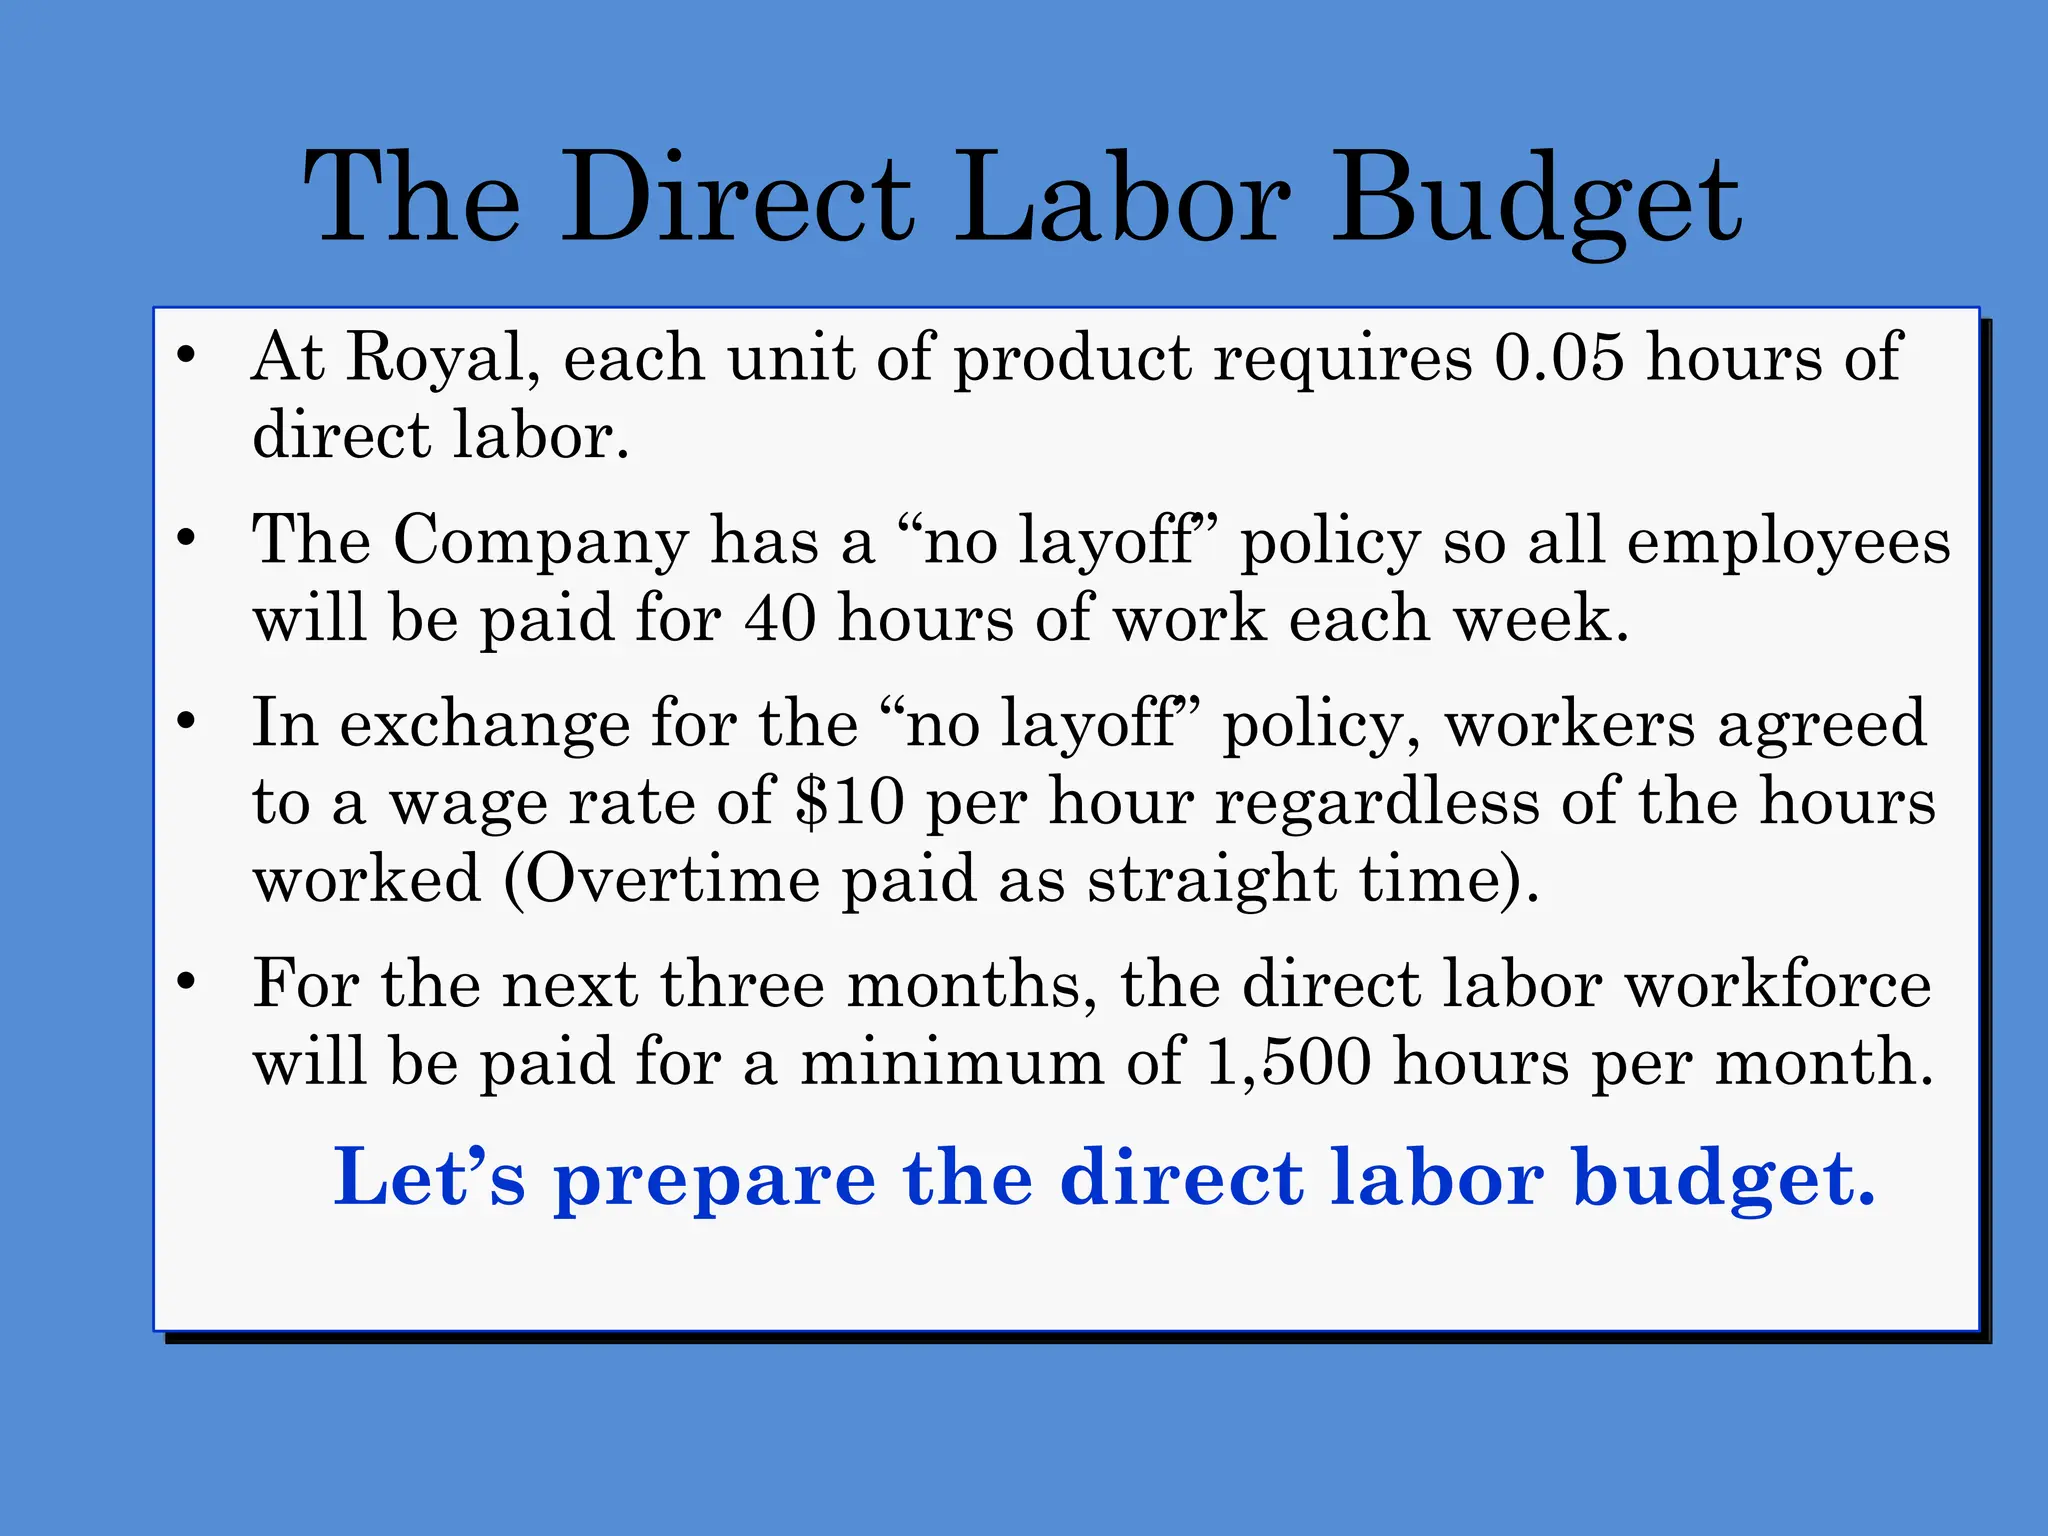
The Direct LaborBudget
• At Royal, each unit of product requires 0.05 hours of
direct labor.
• The Company has a “no layoff” policy so all employees
will be paid for 40 hours of work each week.
• In exchange for the “no layoff” policy, workers agreed
to a wage rate of $10 per hour regardless of the hours
worked (Overtime paid as straight time).
• For the next three months, the direct labor workforce
will be paid for a minimum of 1,500 hours per month.
Let’s prepare the direct labor budget.
52.
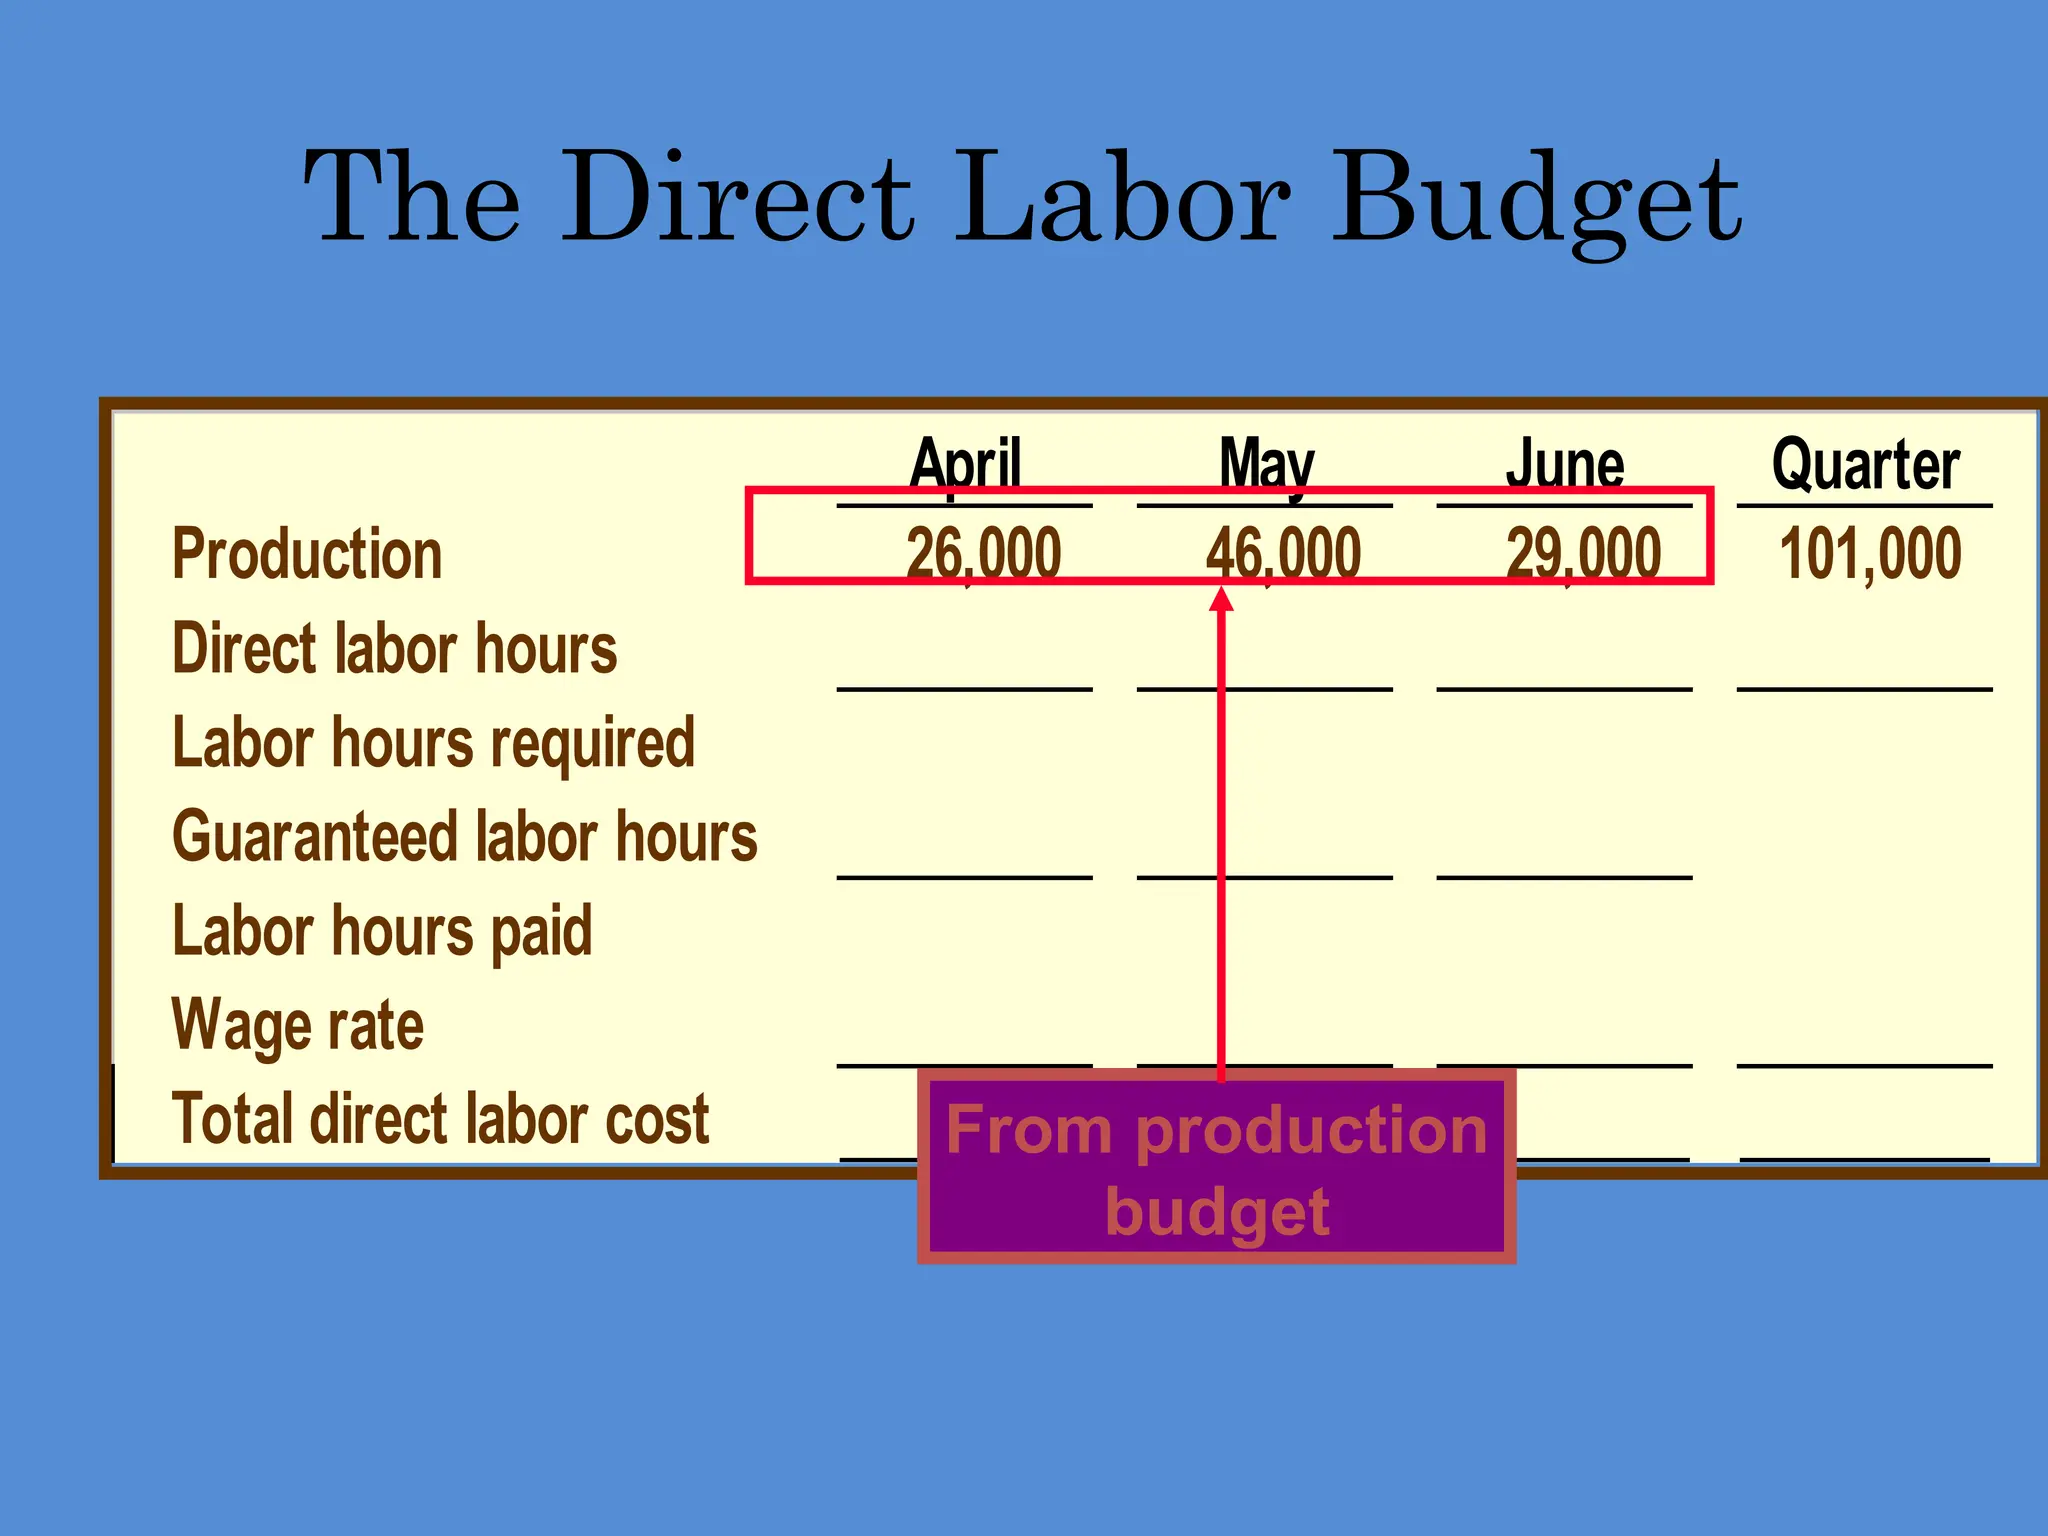
April May JuneQuarter
Production 26,000 46,000 29,000 101,000
Direct labor hours
Labor hours required
Guaranteed labor hours
Labor hours paid
Wage rate
Total direct labor cost
The Direct Labor Budget
From production
budget
53.
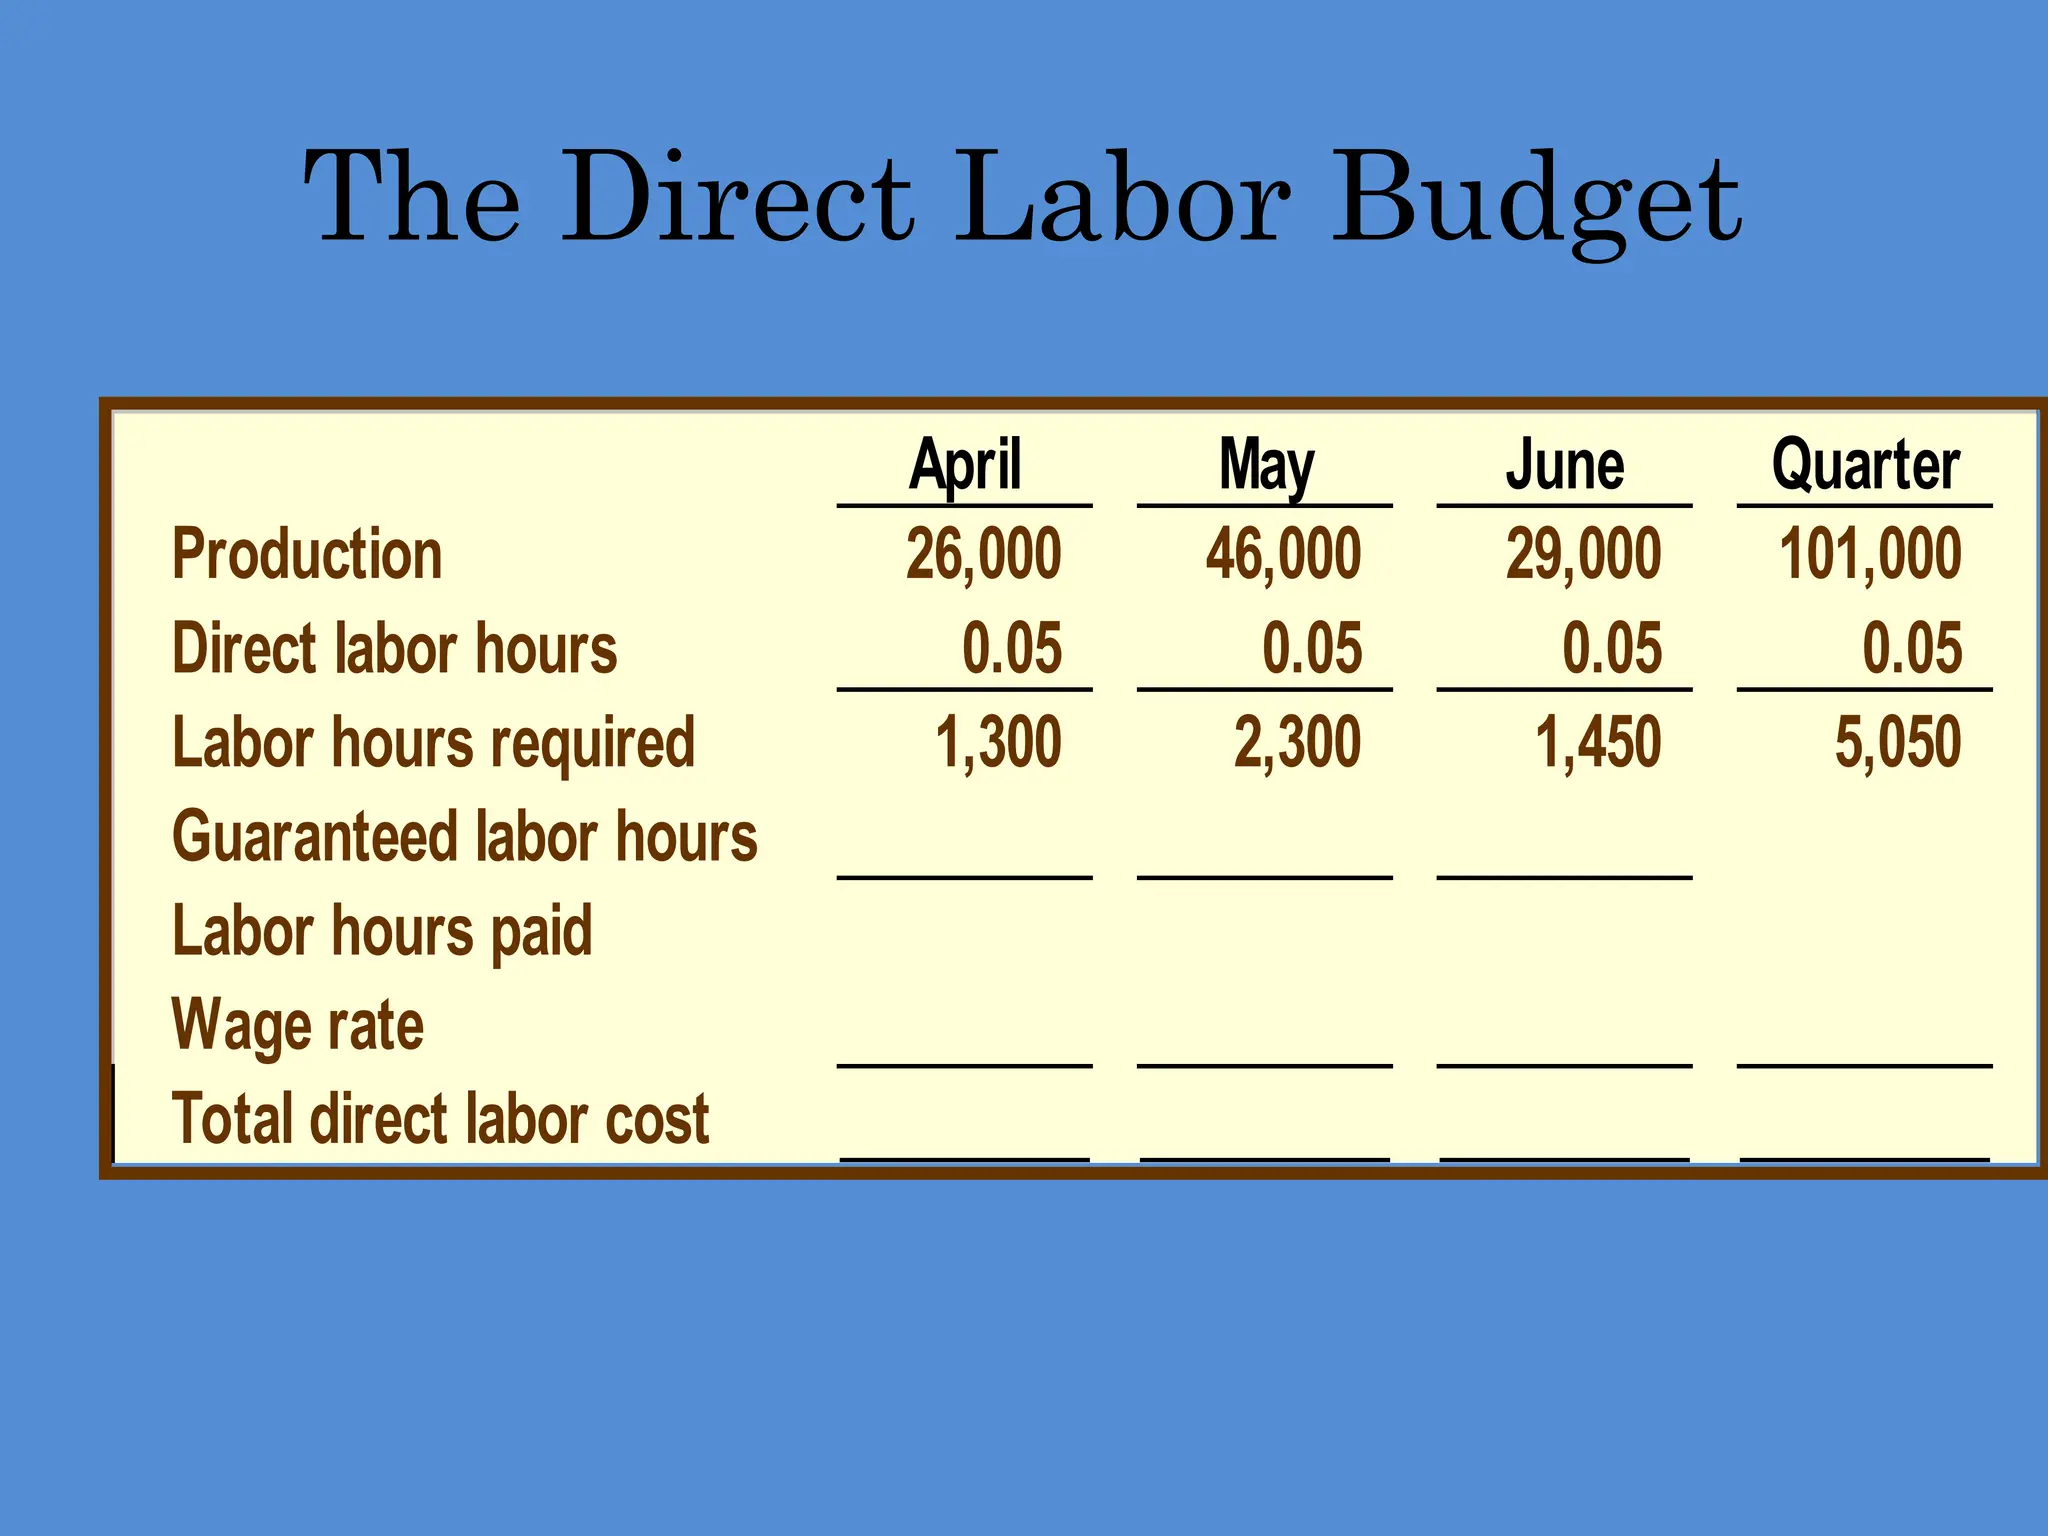
The Direct LaborBudget
April May June Quarter
Production 26,000 46,000 29,000 101,000
Direct labor hours 0.05 0.05 0.05 0.05
Labor hours required 1,300 2,300 1,450 5,050
Guaranteed labor hours
Labor hours paid
Wage rate
Total direct labor cost
54.
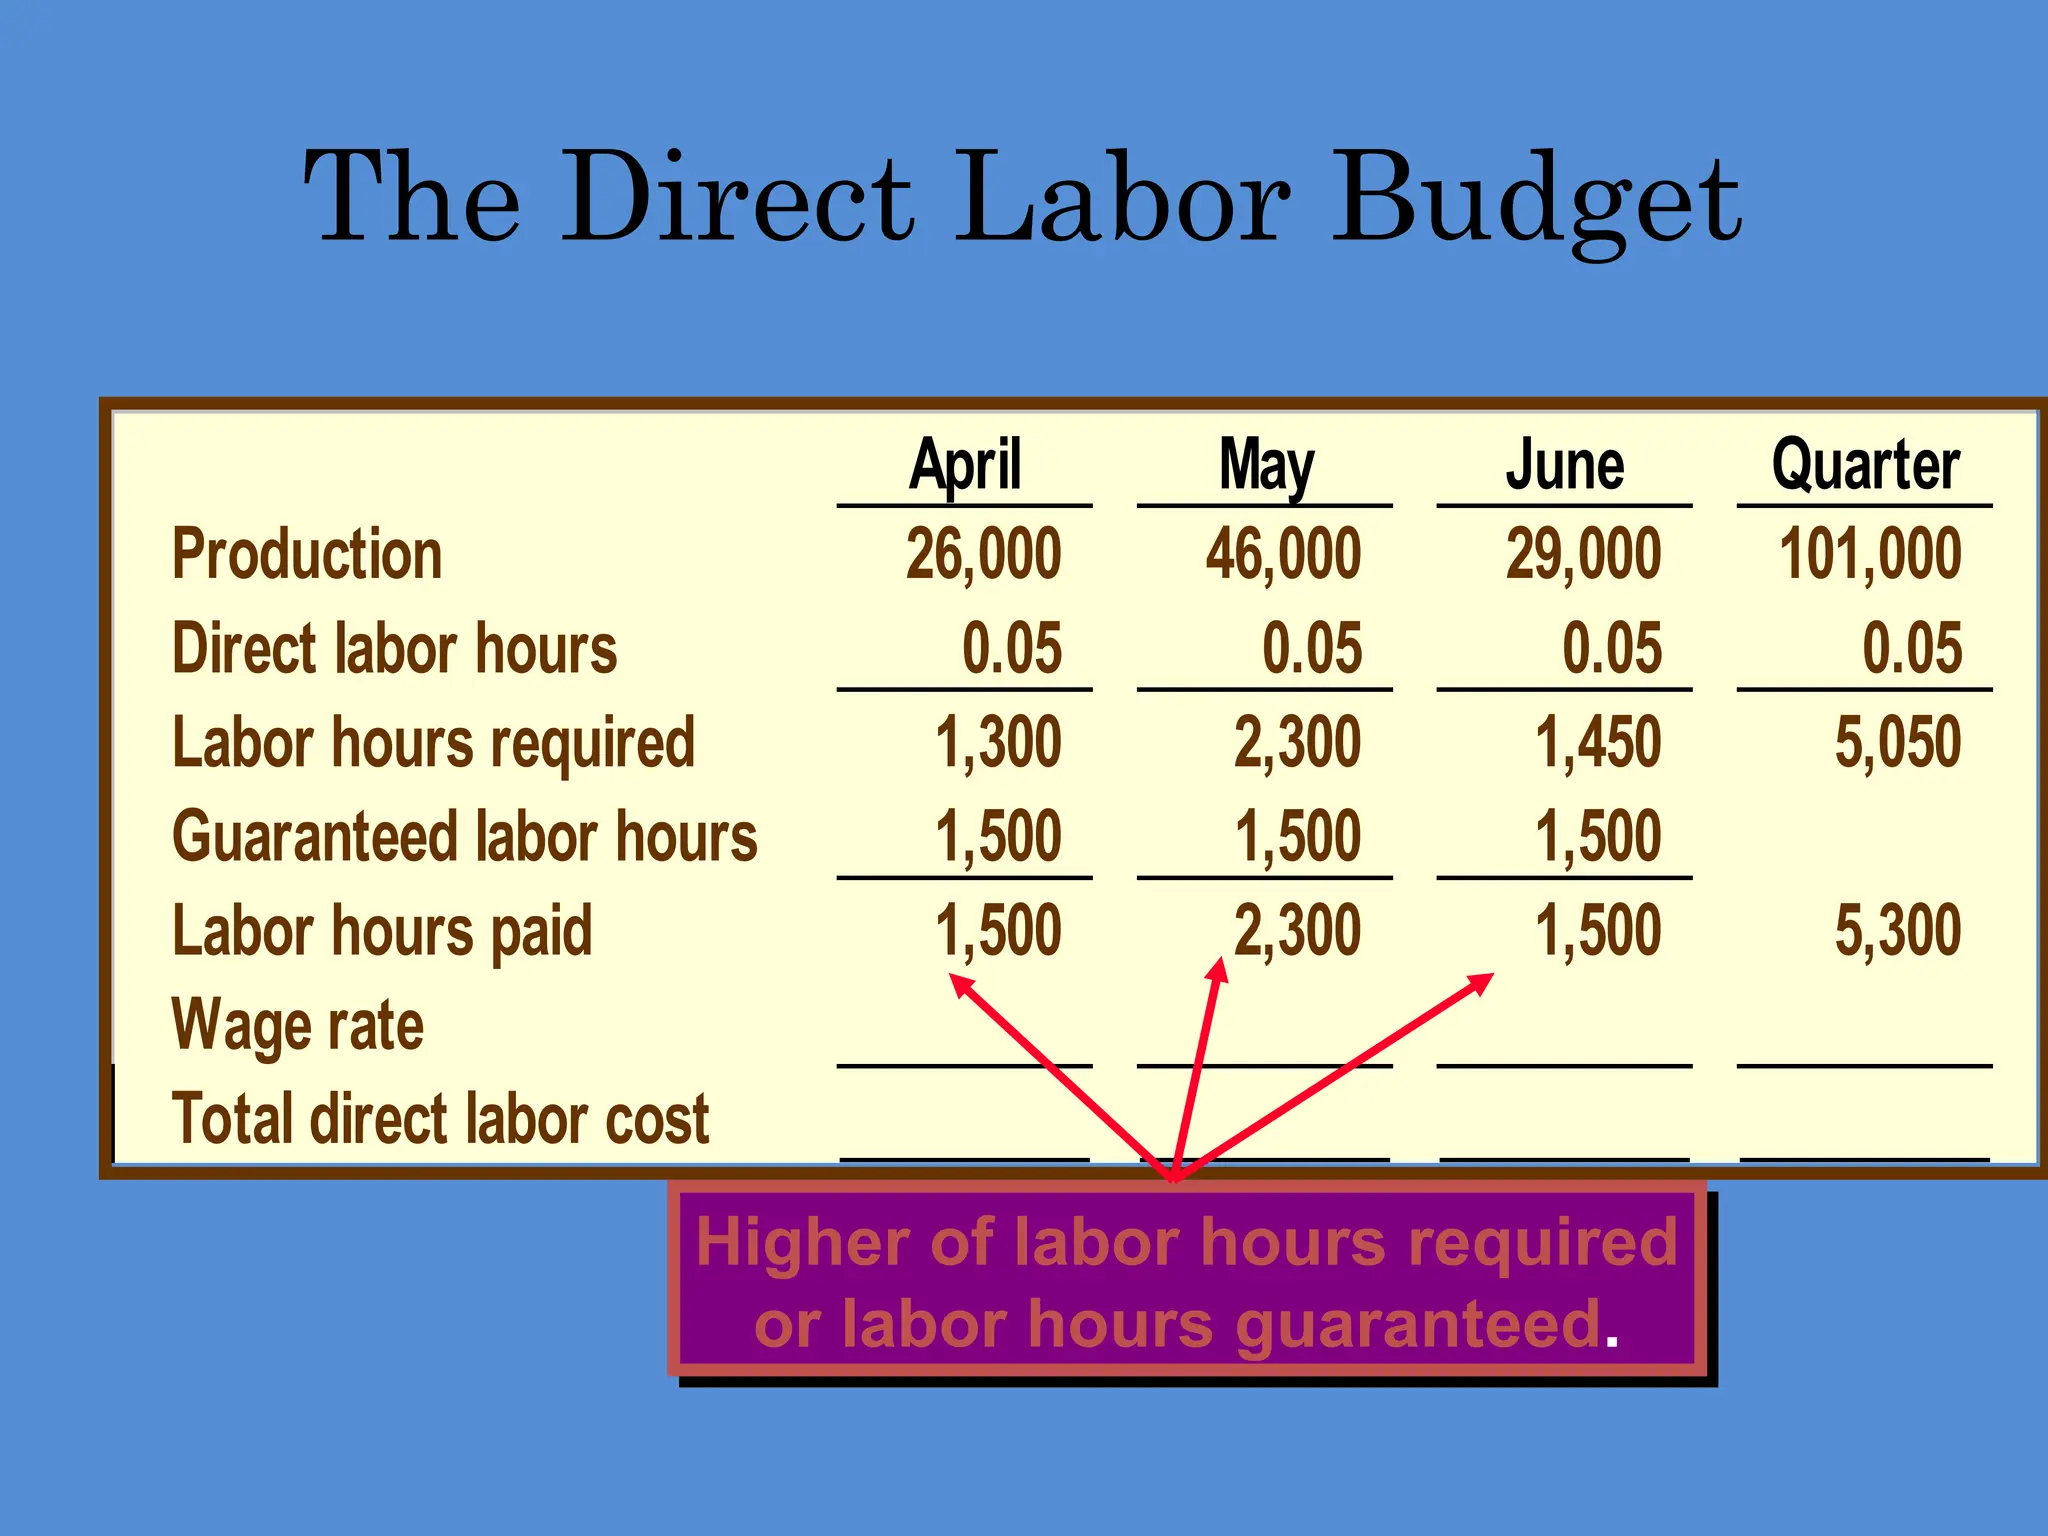
April May JuneQuarter
Production 26,000 46,000 29,000 101,000
Direct labor hours 0.05 0.05 0.05 0.05
Labor hours required 1,300 2,300 1,450 5,050
Guaranteed labor hours 1,500 1,500 1,500
Labor hours paid 1,500 2,300 1,500 5,300
Wage rate
Total direct labor cost
The Direct Labor Budget
Higher of labor hours required
or labor hours guaranteed.
55.
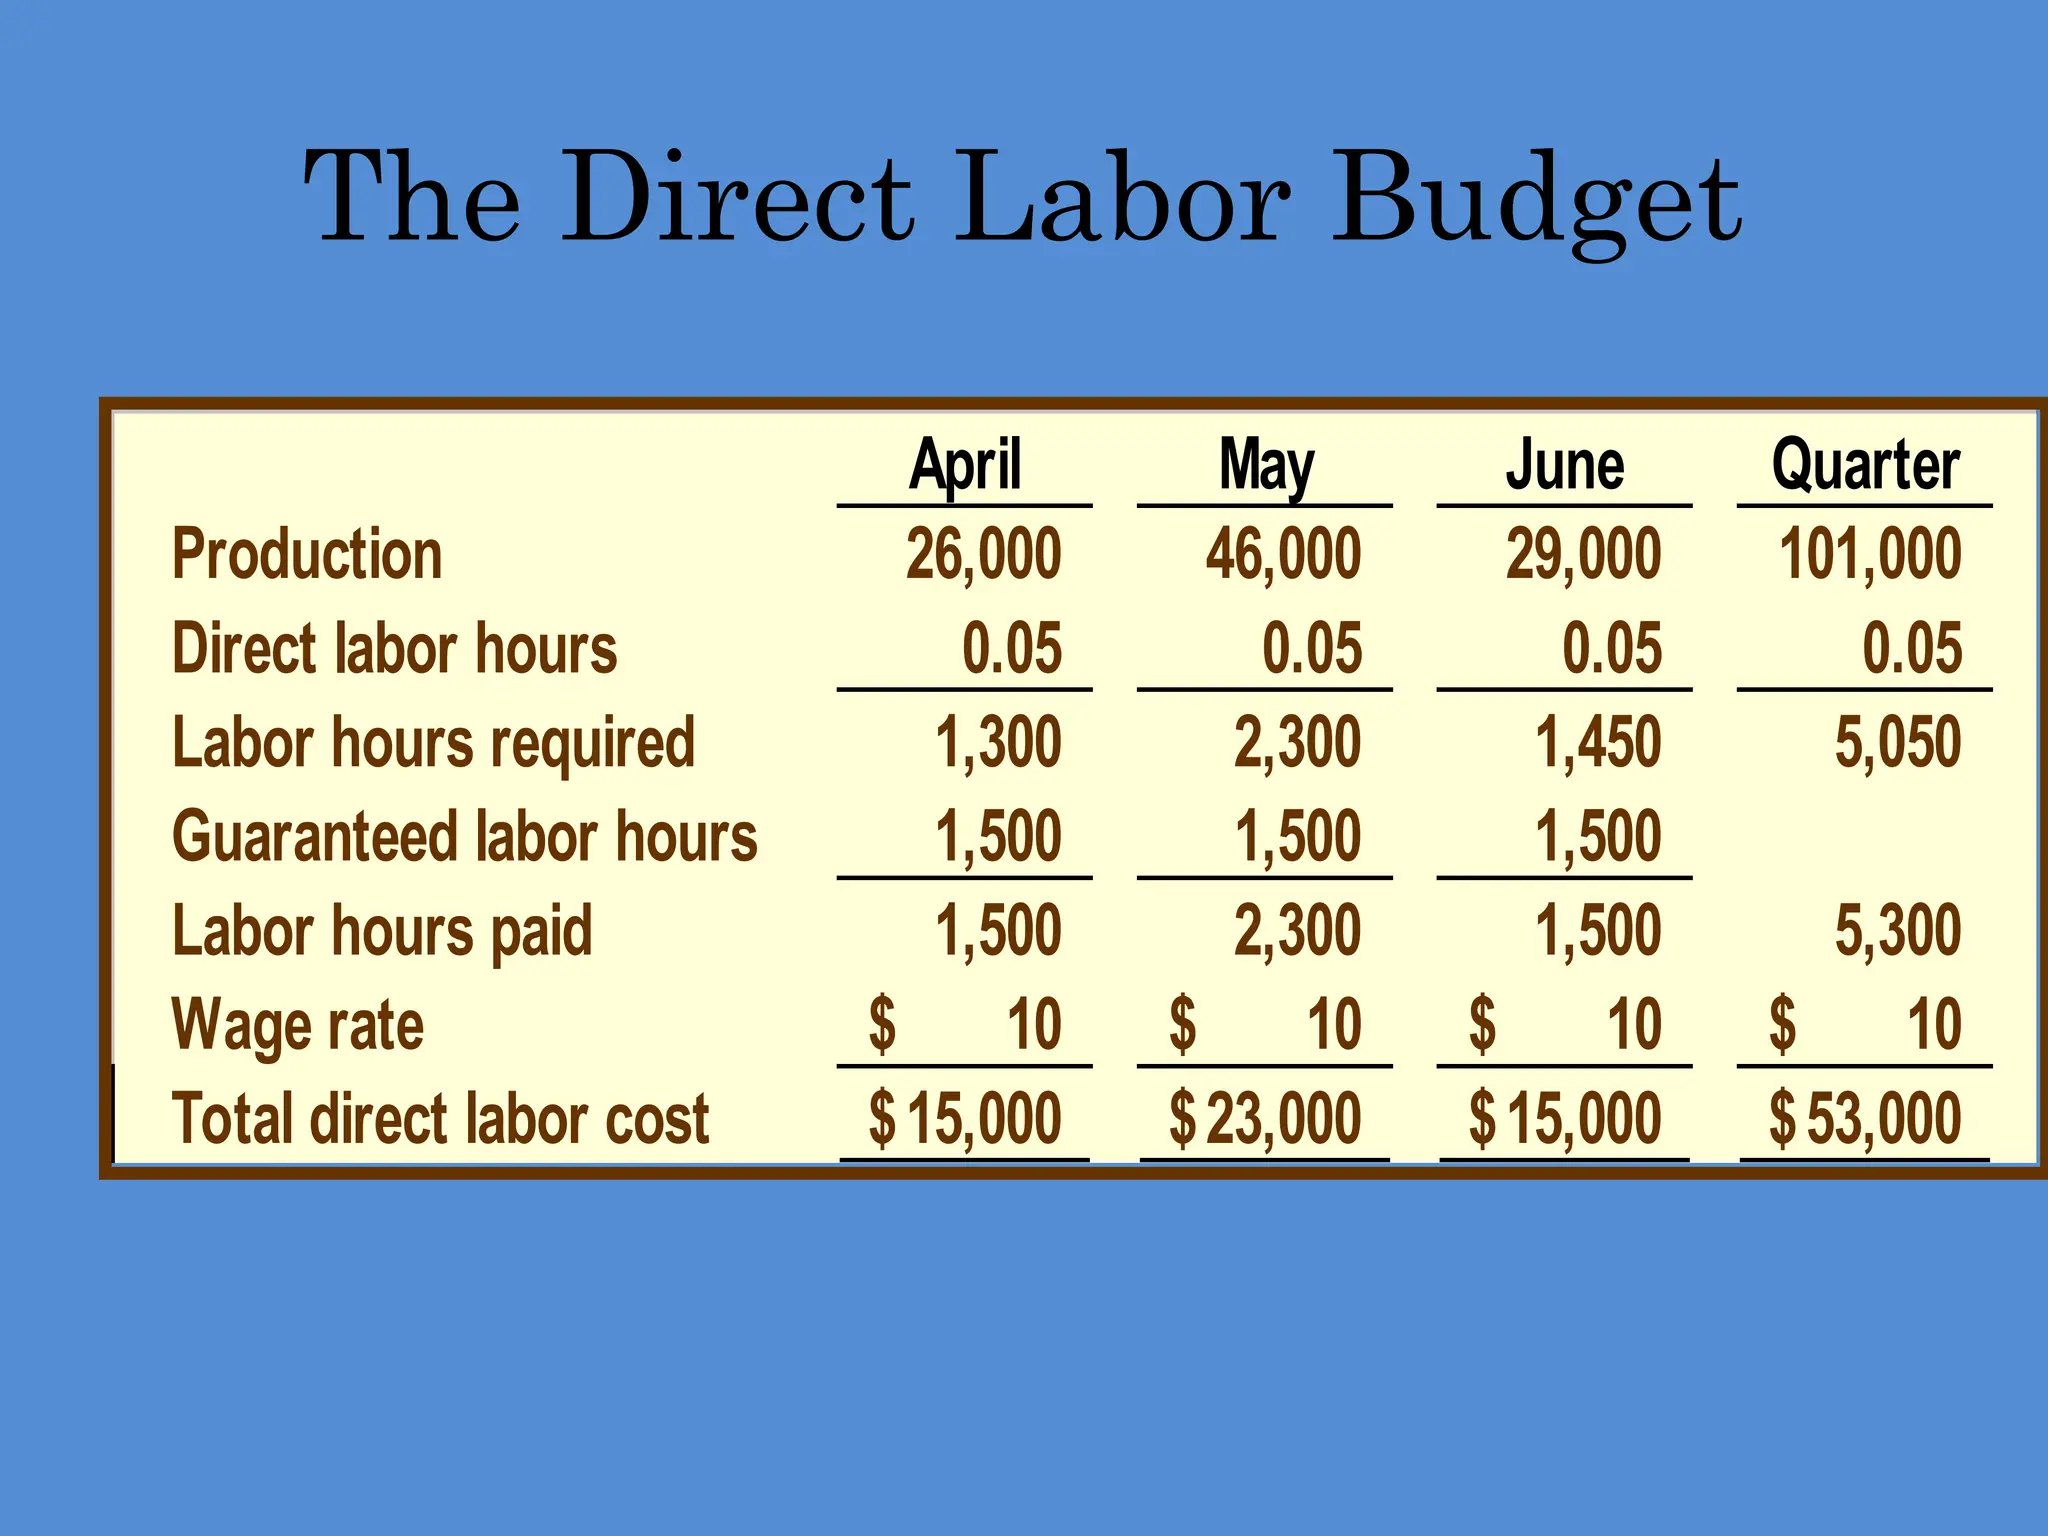
The Direct LaborBudget
April May June Quarter
Production 26,000 46,000 29,000 101,000
Direct labor hours 0.05 0.05 0.05 0.05
Labor hours required 1,300 2,300 1,450 5,050
Guaranteed labor hours 1,500 1,500 1,500
Labor hours paid 1,500 2,300 1,500 5,300
Wage rate 10
$ 10
$ 10
$ 10
$
Total direct labor cost 15,000
$ 23,000
$ 15,000
$ 53,000
$
56.
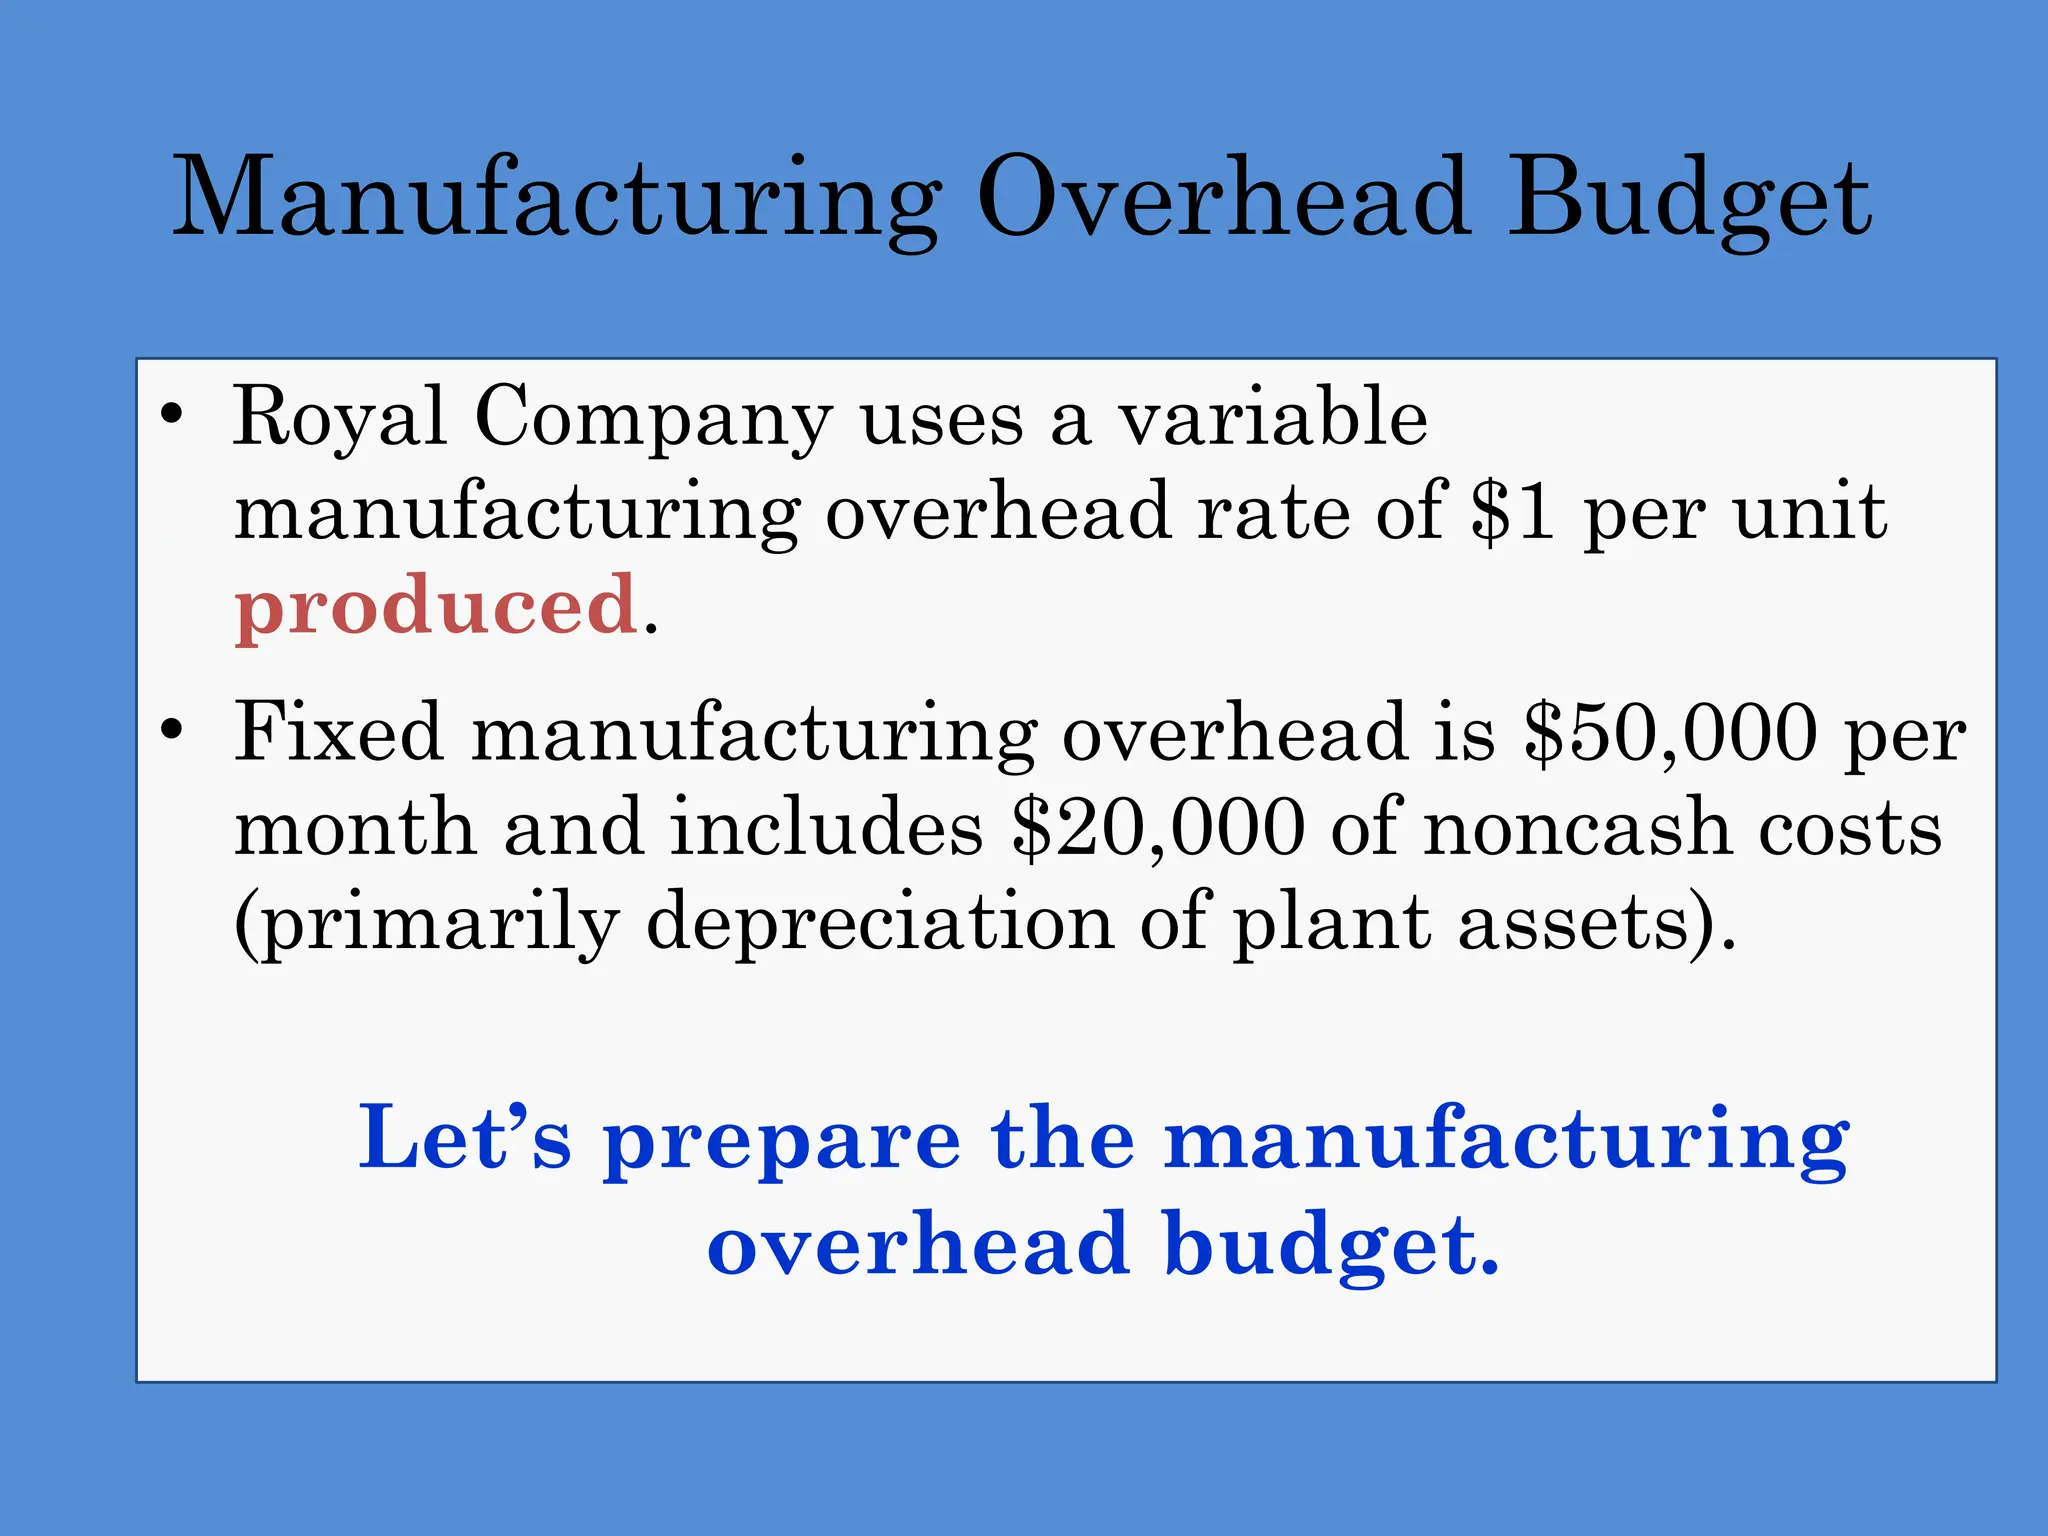
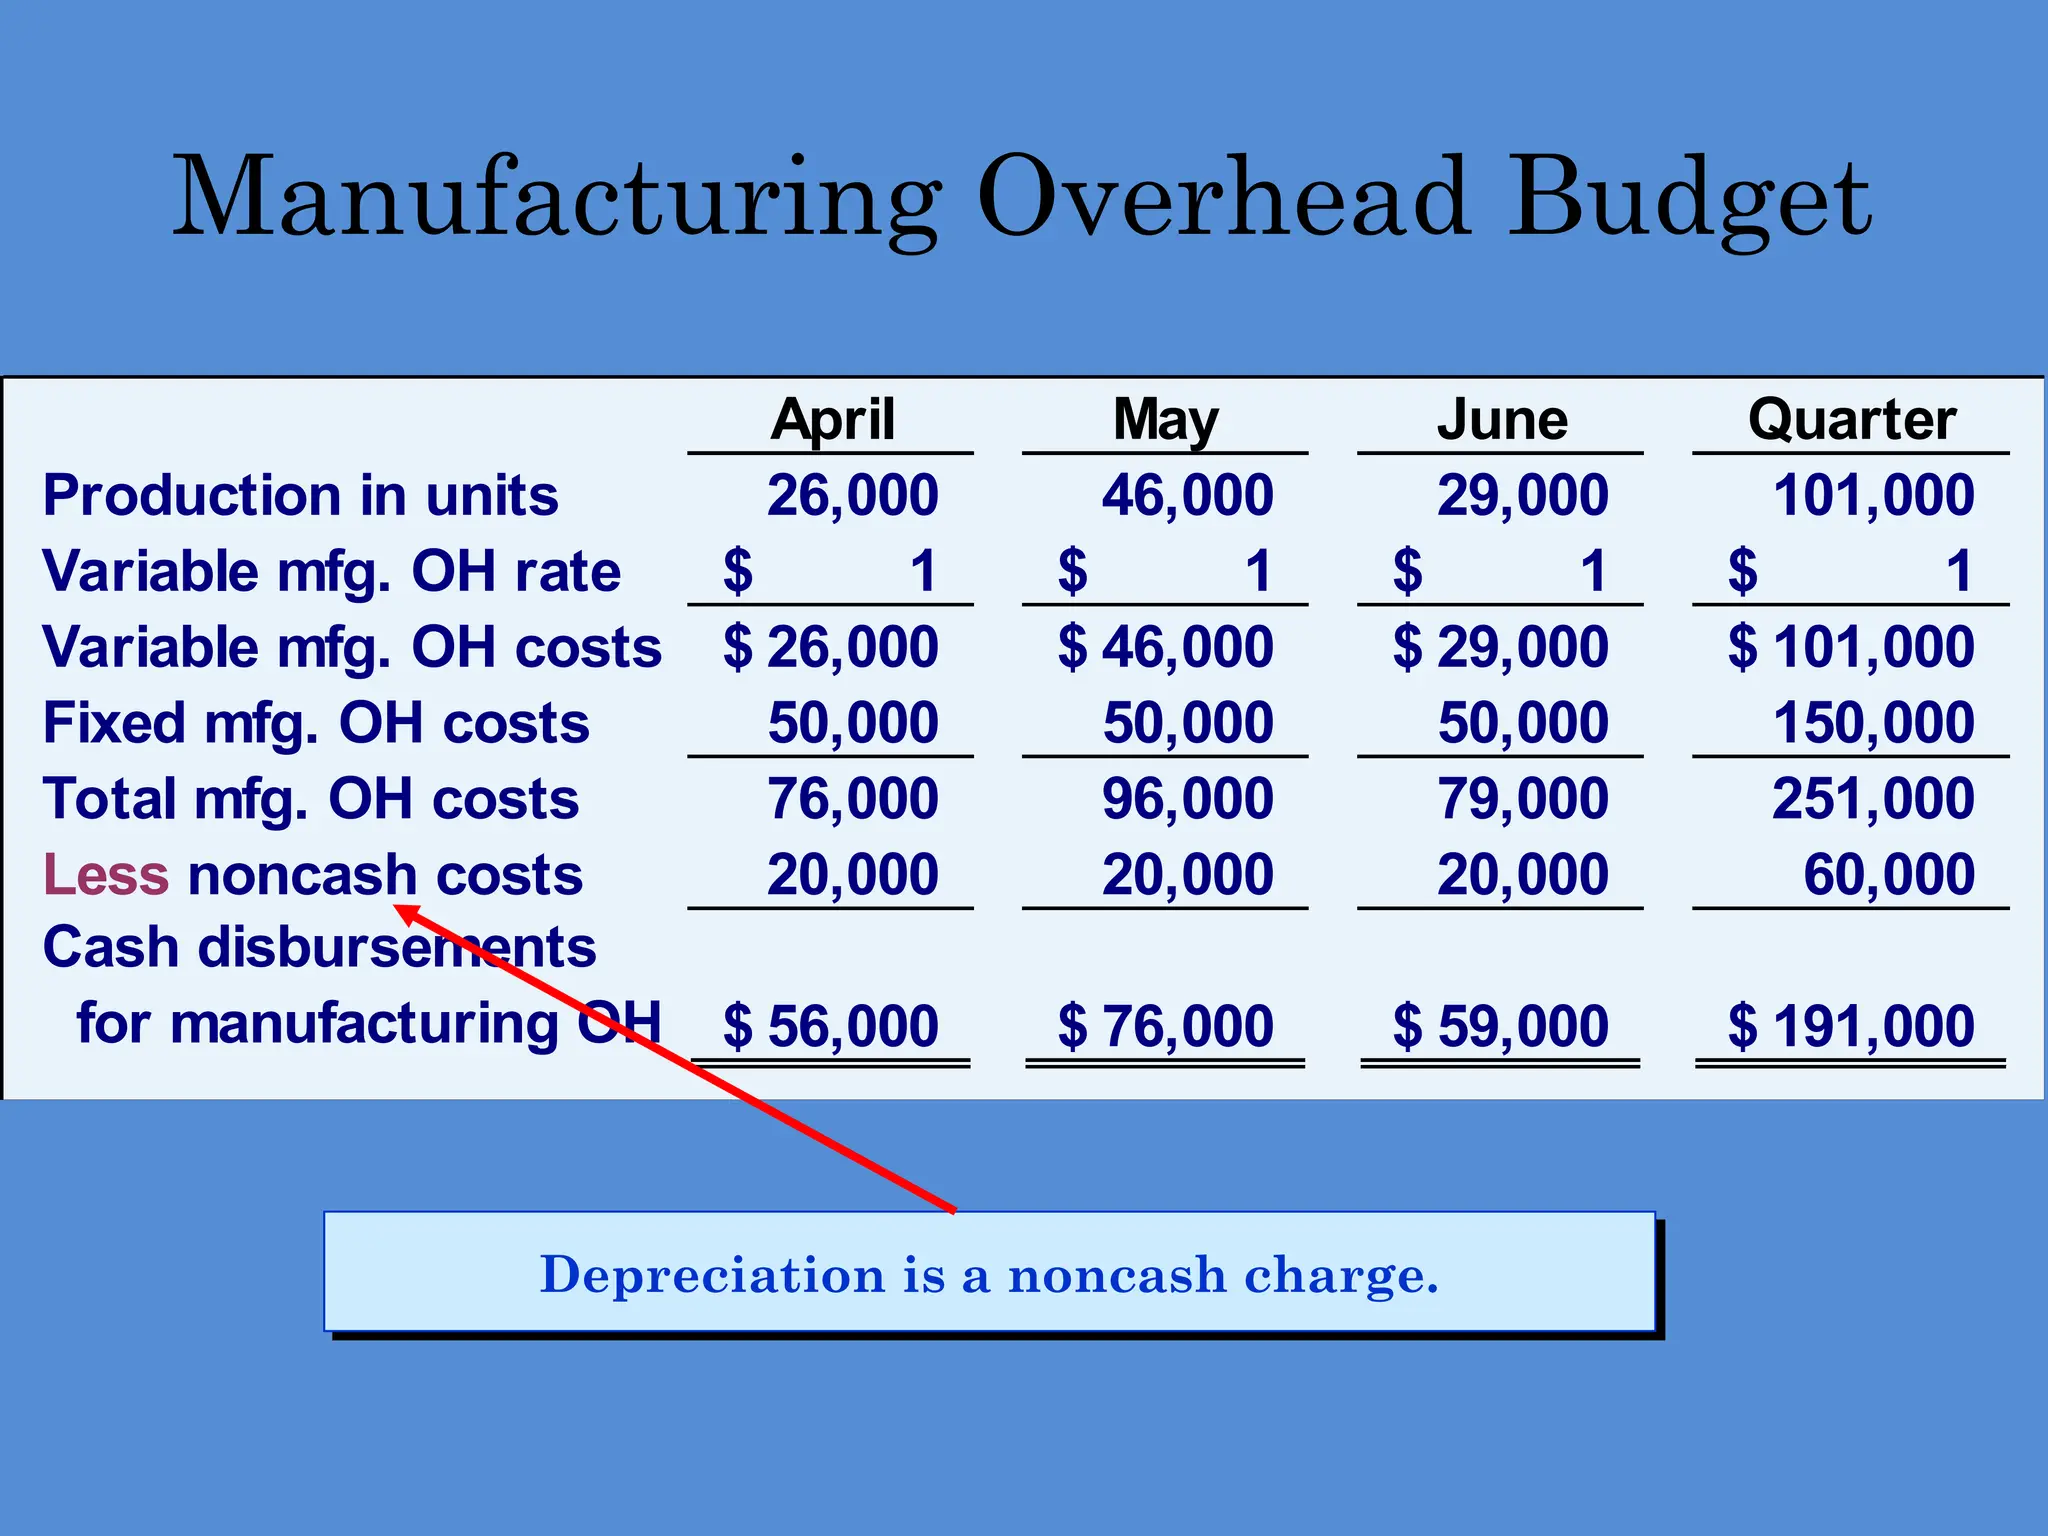
Manufacturing Overhead Budget
•Royal Company uses a variable
manufacturing overhead rate of $1 per unit
produced.
• Fixed manufacturing overhead is $50,000 per
month and includes $20,000 of noncash costs
(primarily depreciation of plant assets).
Let’s prepare the manufacturing
overhead budget.
57.
April May JuneQuarter
Production in units 26,000 46,000 29,000 101,000
Variable mfg. OH rate 1
$ 1
$ 1
$ 1
$
Variable mfg. OH costs 26,000
$ 46,000
$ 29,000
$ 101,000
$
Fixed mfg. OH costs
Total mfg. OH costs
Less noncash costs
Cash disbursements
for manufacturing OH
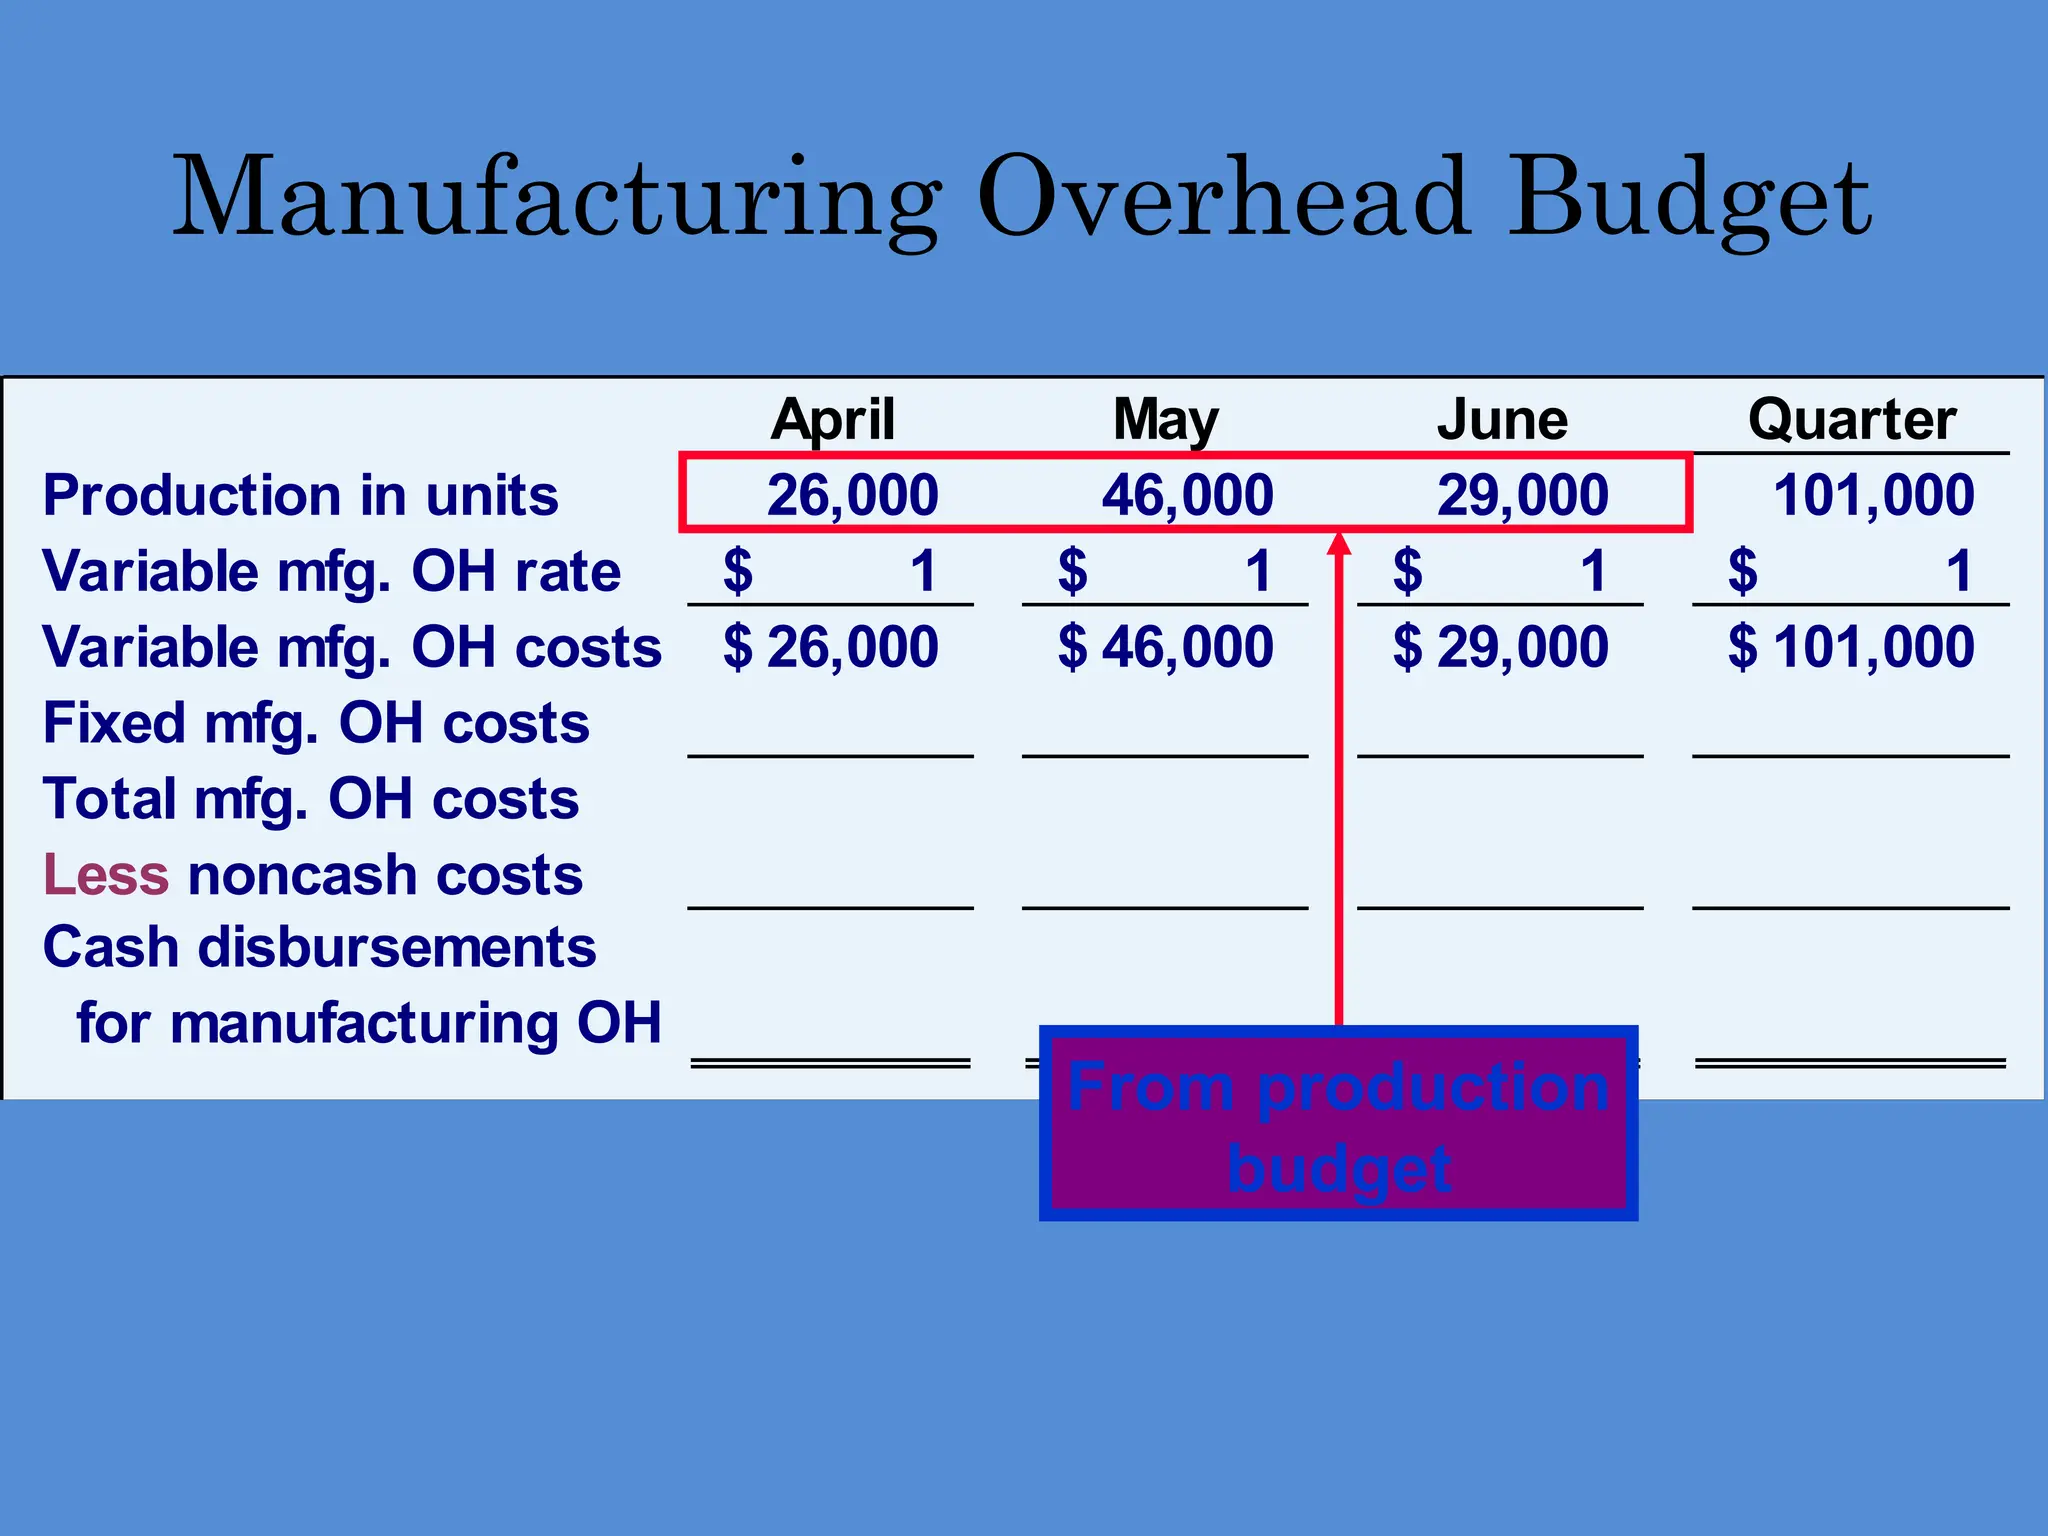
Manufacturing Overhead Budget
From production
budget
58.
Manufacturing Overhead Budget
AprilMay June Quarter
Production in units 26,000 46,000 29,000 101,000
Variable mfg. OH rate 1
$ 1
$ 1
$ 1
$
Variable mfg. OH costs 26,000
$ 46,000
$ 29,000
$ 101,000
$
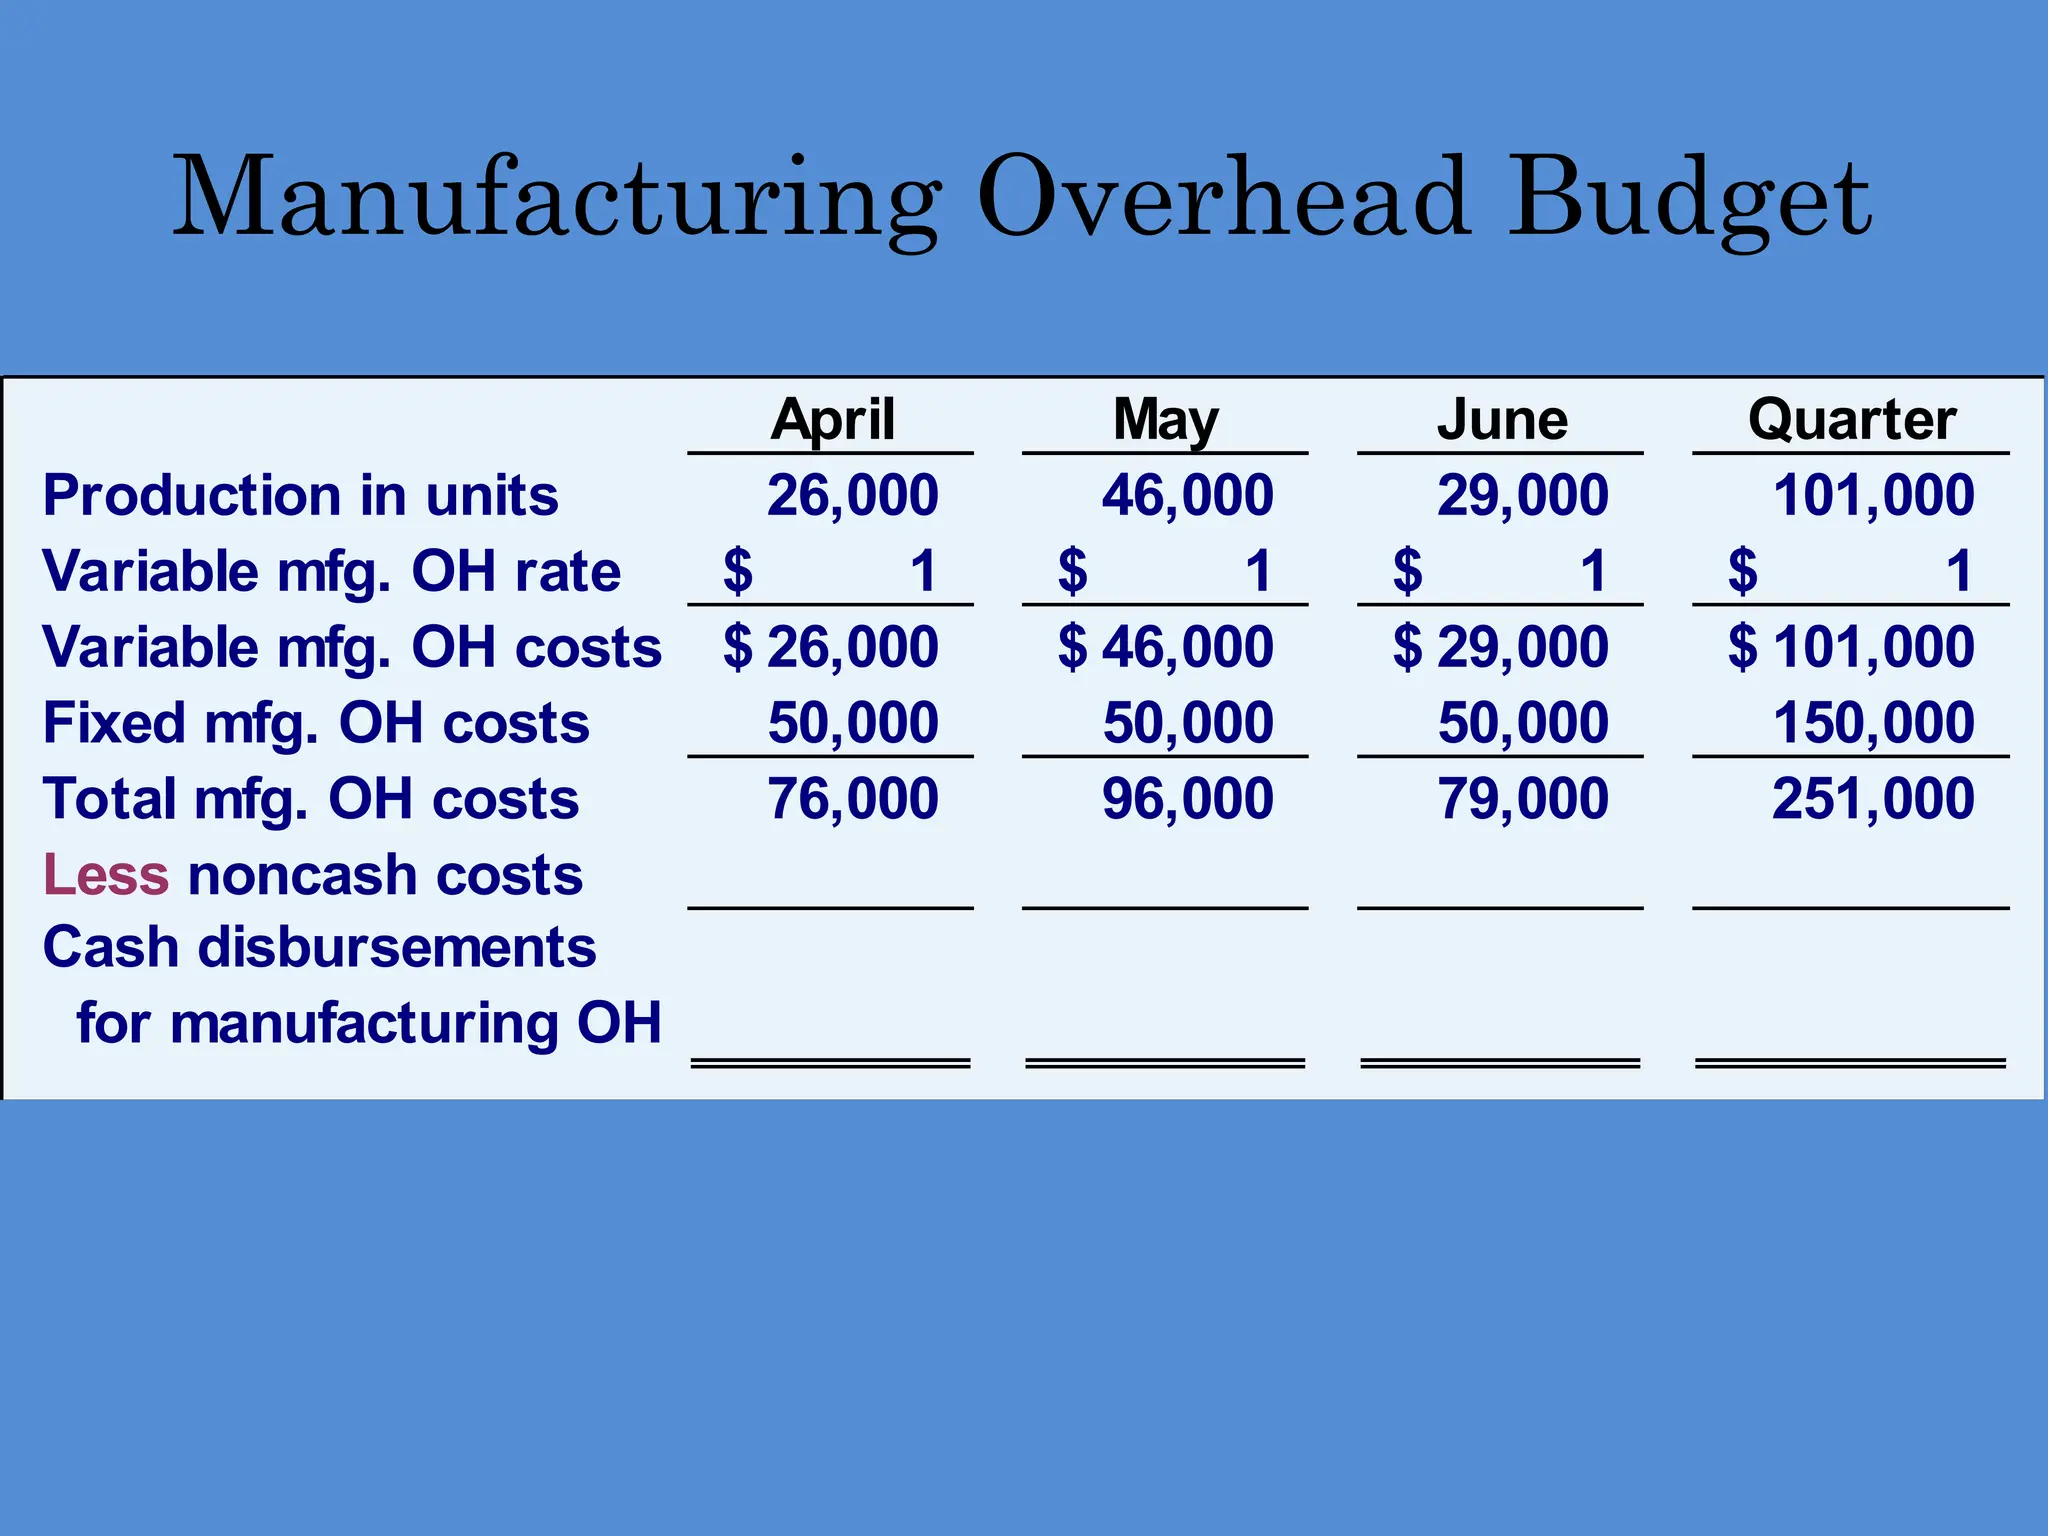
Fixed mfg. OH costs 50,000 50,000 50,000 150,000
Total mfg. OH costs 76,000 96,000 79,000 251,000
Less noncash costs
Cash disbursements
for manufacturing OH
59.
Manufacturing Overhead Budget
AprilMay June Quarter
Production in units 26,000 46,000 29,000 101,000
Variable mfg. OH rate 1
$ 1
$ 1
$ 1
$
Variable mfg. OH costs 26,000
$ 46,000
$ 29,000
$ 101,000
$
Fixed mfg. OH costs 50,000 50,000 50,000 150,000
Total mfg. OH costs 76,000 96,000 79,000 251,000
Less noncash costs 20,000 20,000 20,000 60,000
Cash disbursements
for manufacturing OH 56,000
$ 76,000
$ 59,000
$ 191,000
$
Depreciation is a noncash charge.
60.
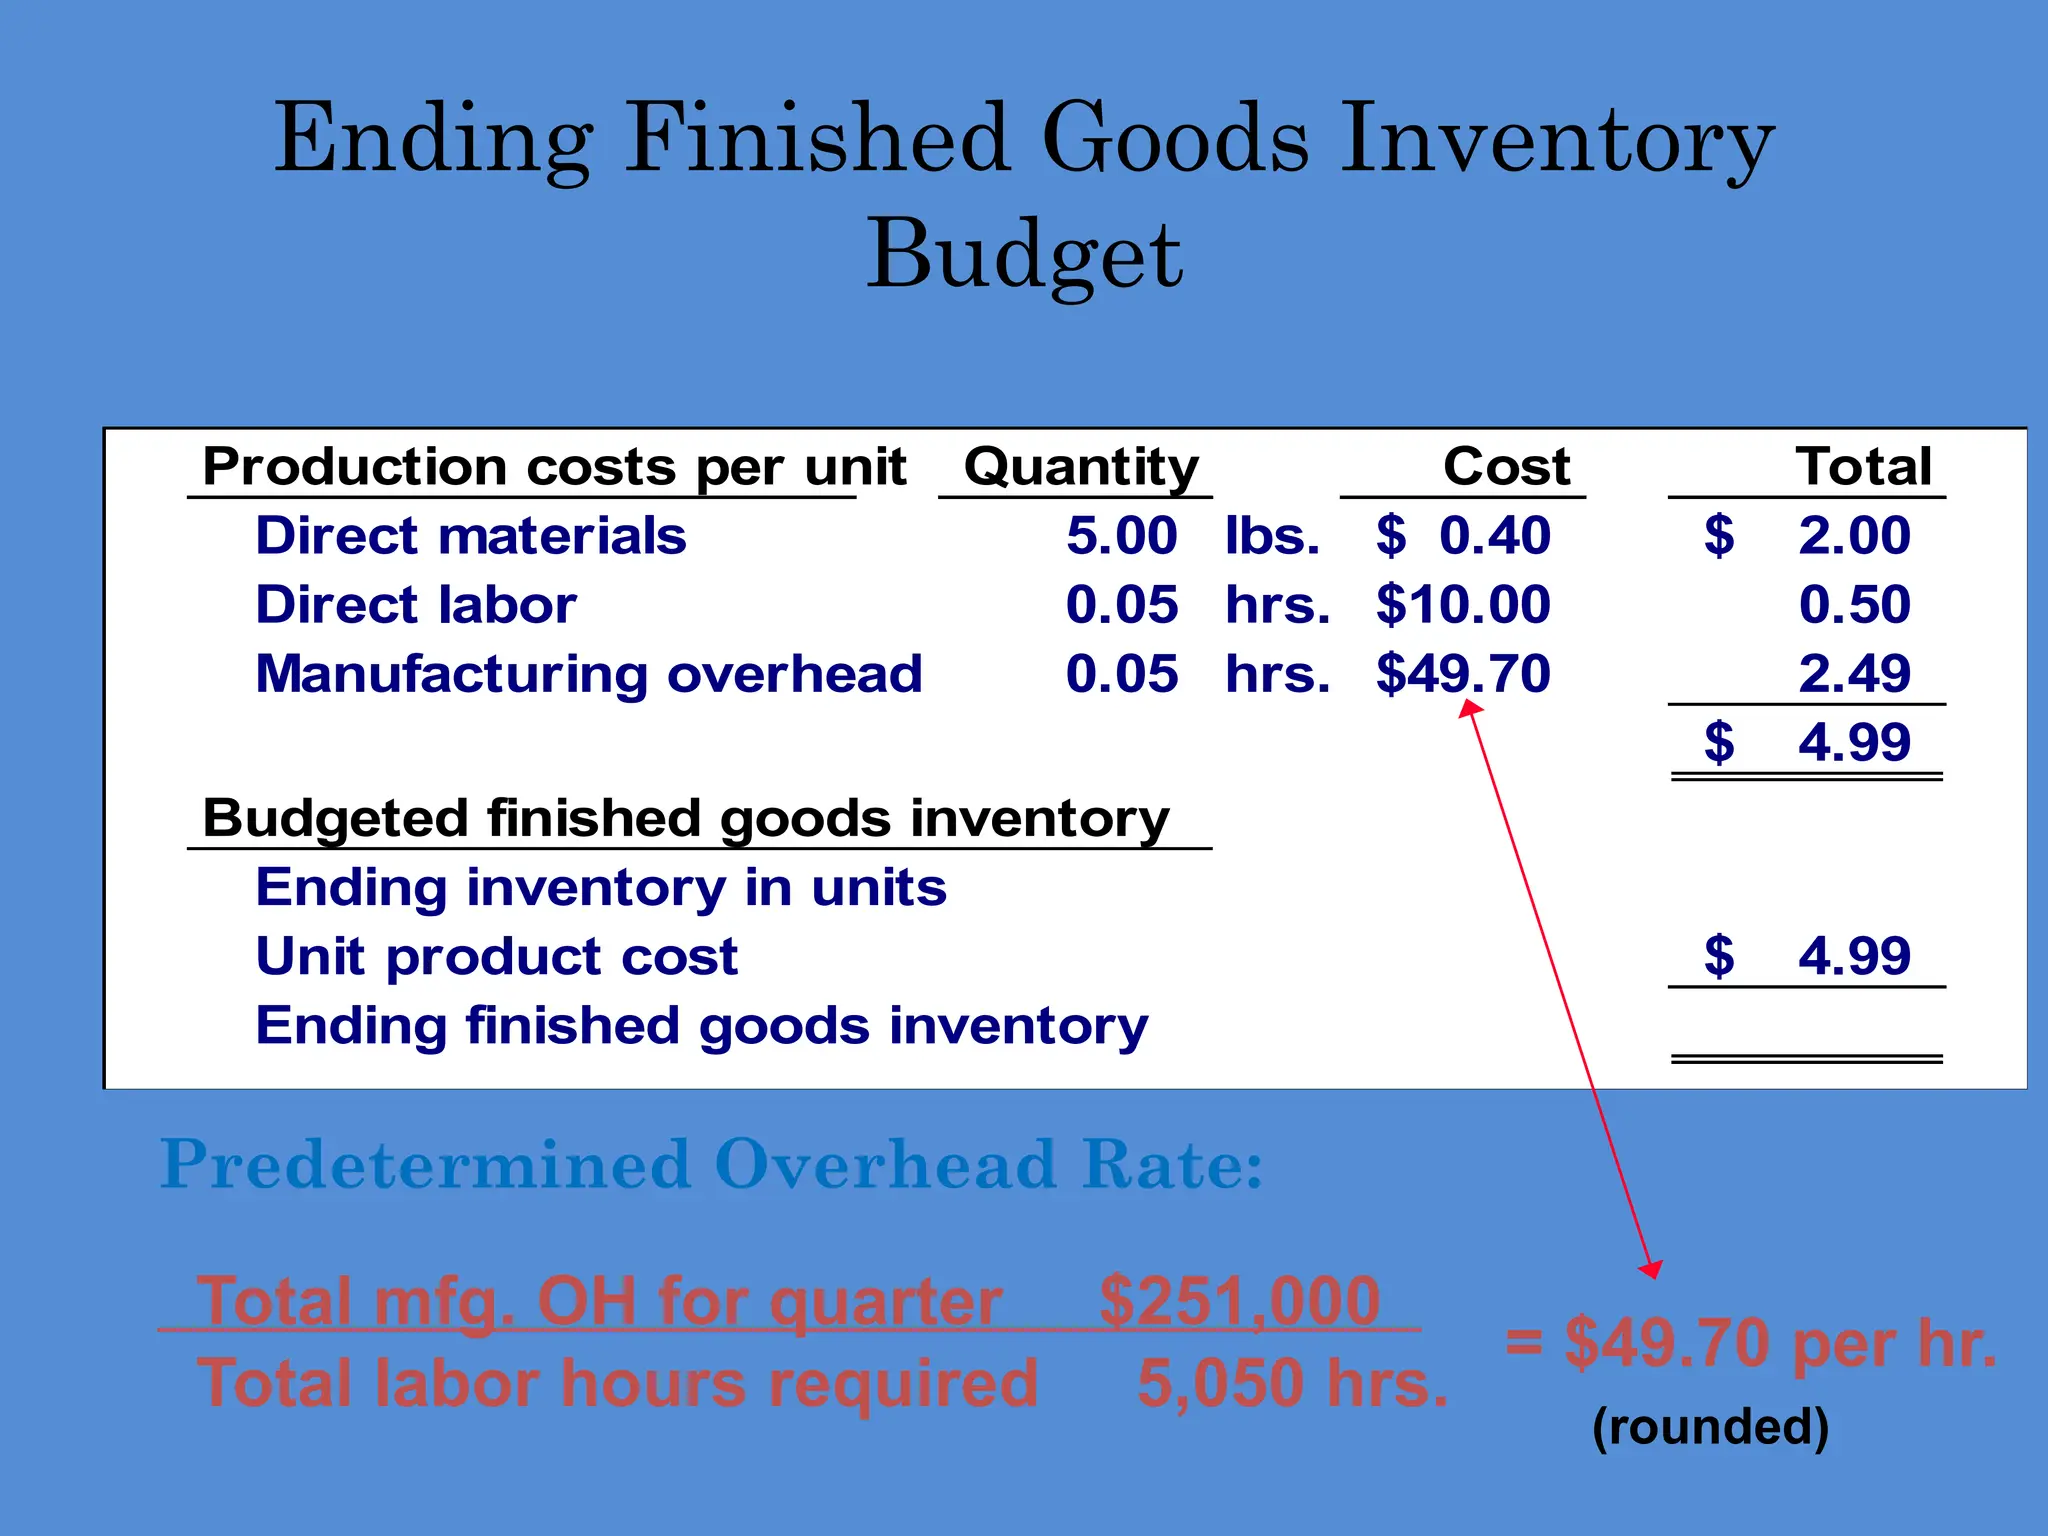
Ending Finished GoodsInventory
Budget
• Now, Royal can complete the ending
finished goods inventory budget.
• At Royal, manufacturing overhead is
applied to units of product on the basis of
direct labor hours.
Let’s calculate ending finished
goods inventory.
61.
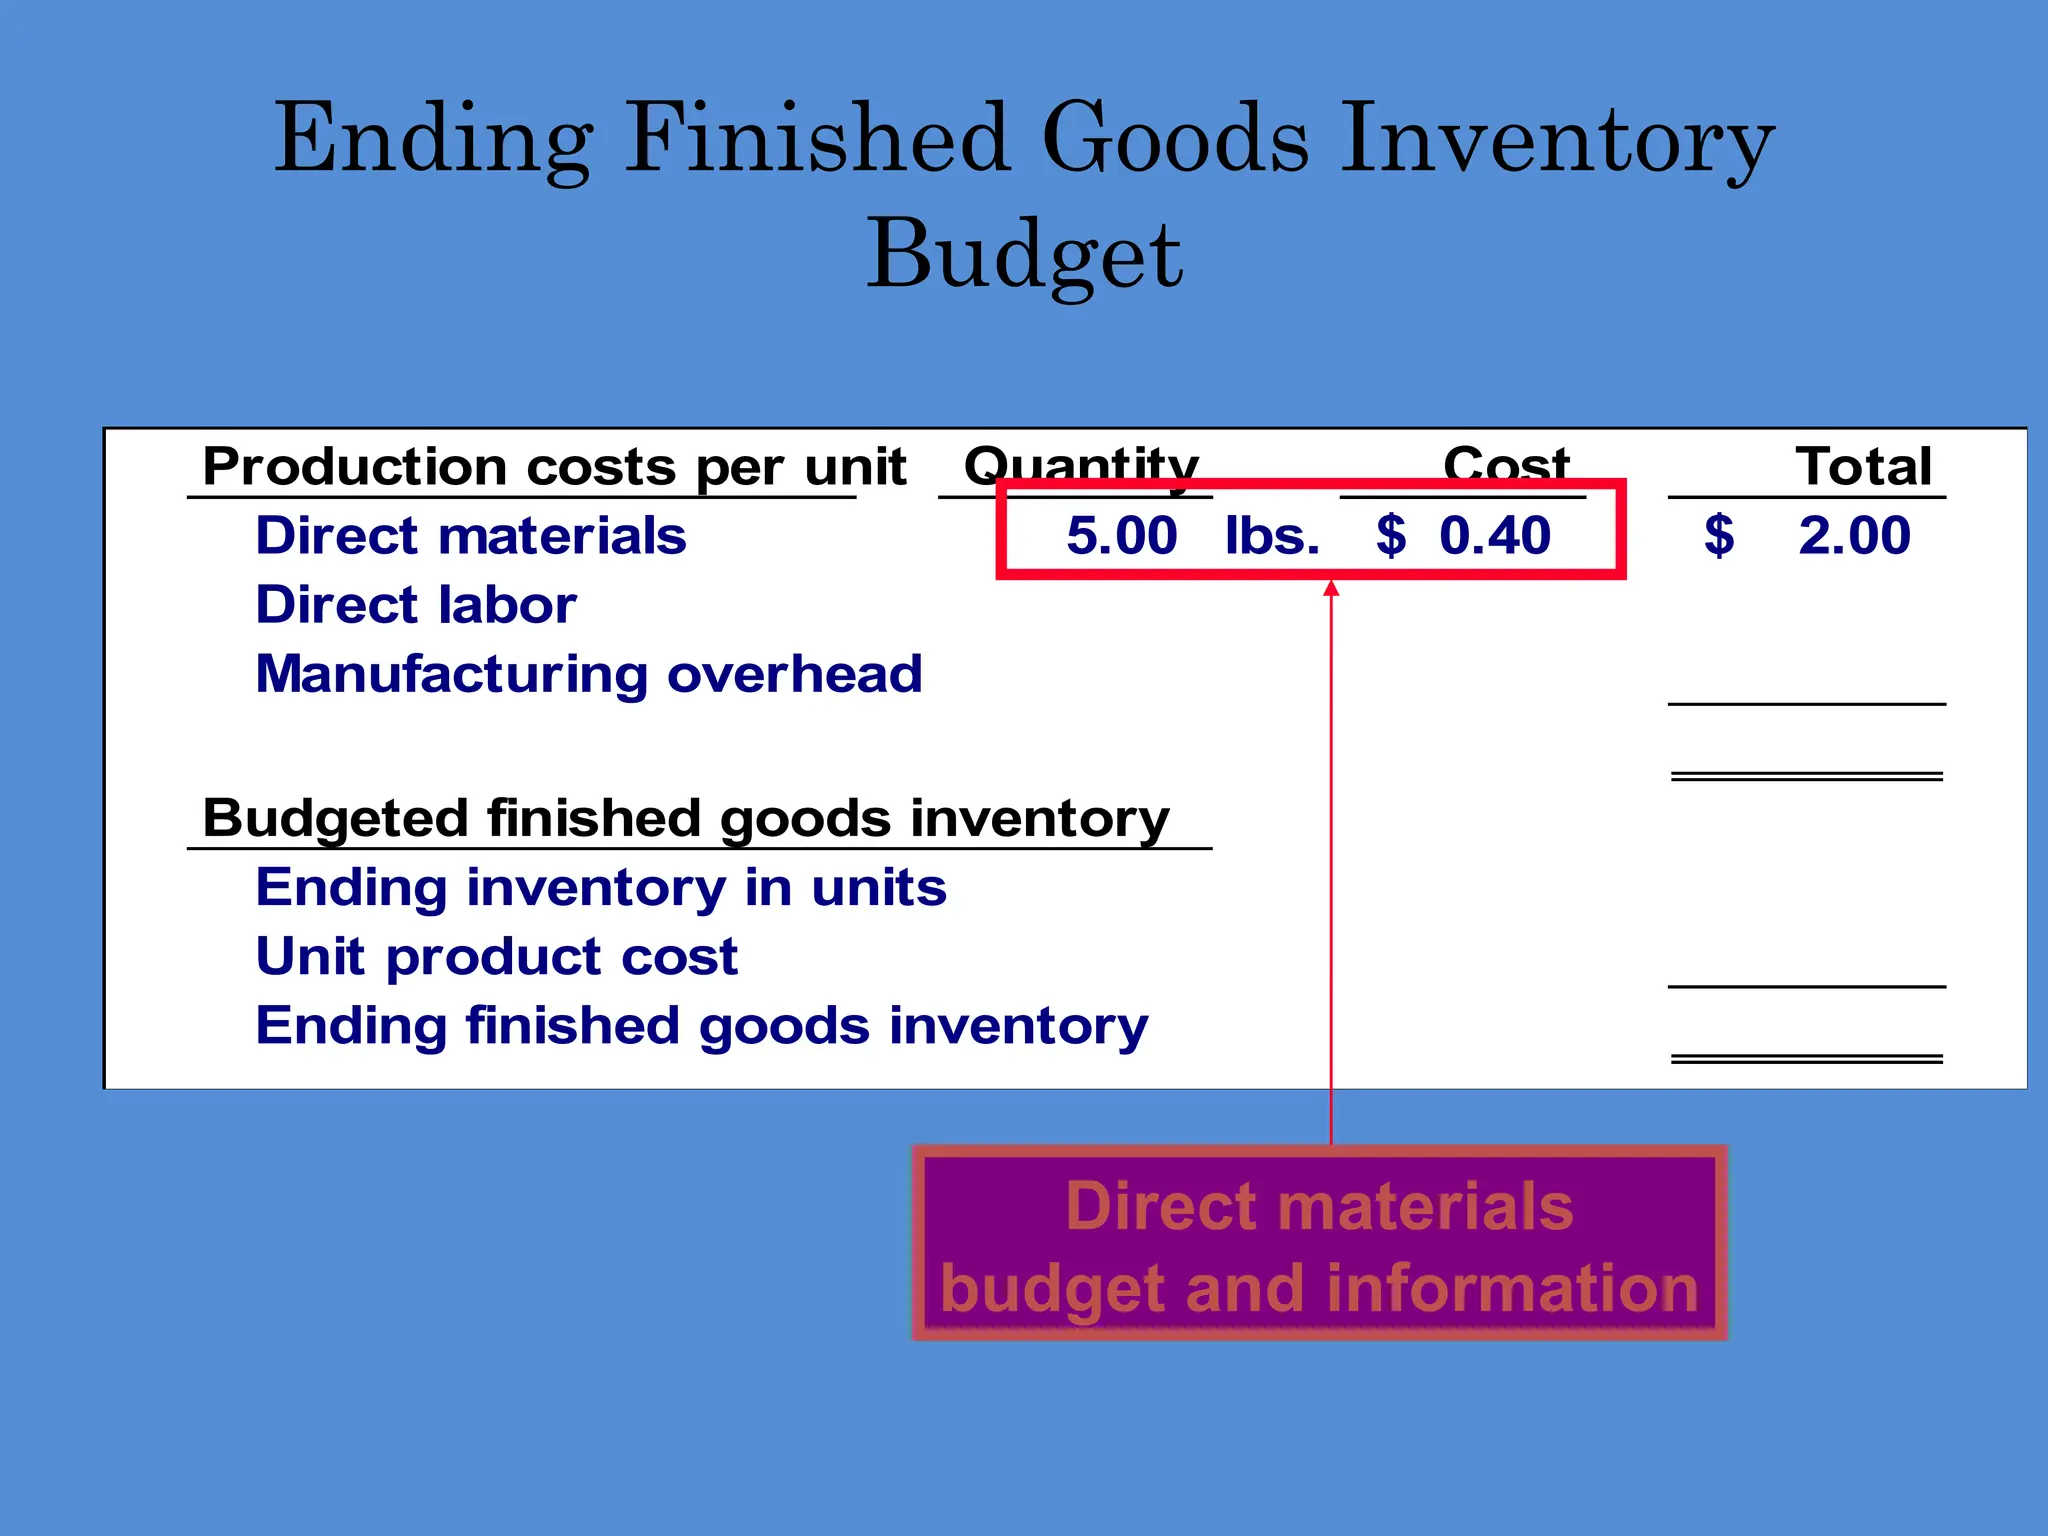
Production costs perunit Quantity Cost Total
Direct materials 5.00 lbs. 0.40
$ 2.00
$
Direct labor
Manufacturing overhead
Budgeted finished goods inventory
Ending inventory in units
Unit product cost
Ending finished goods inventory
Ending Finished Goods Inventory
Budget
Direct materials
budget and information
62.
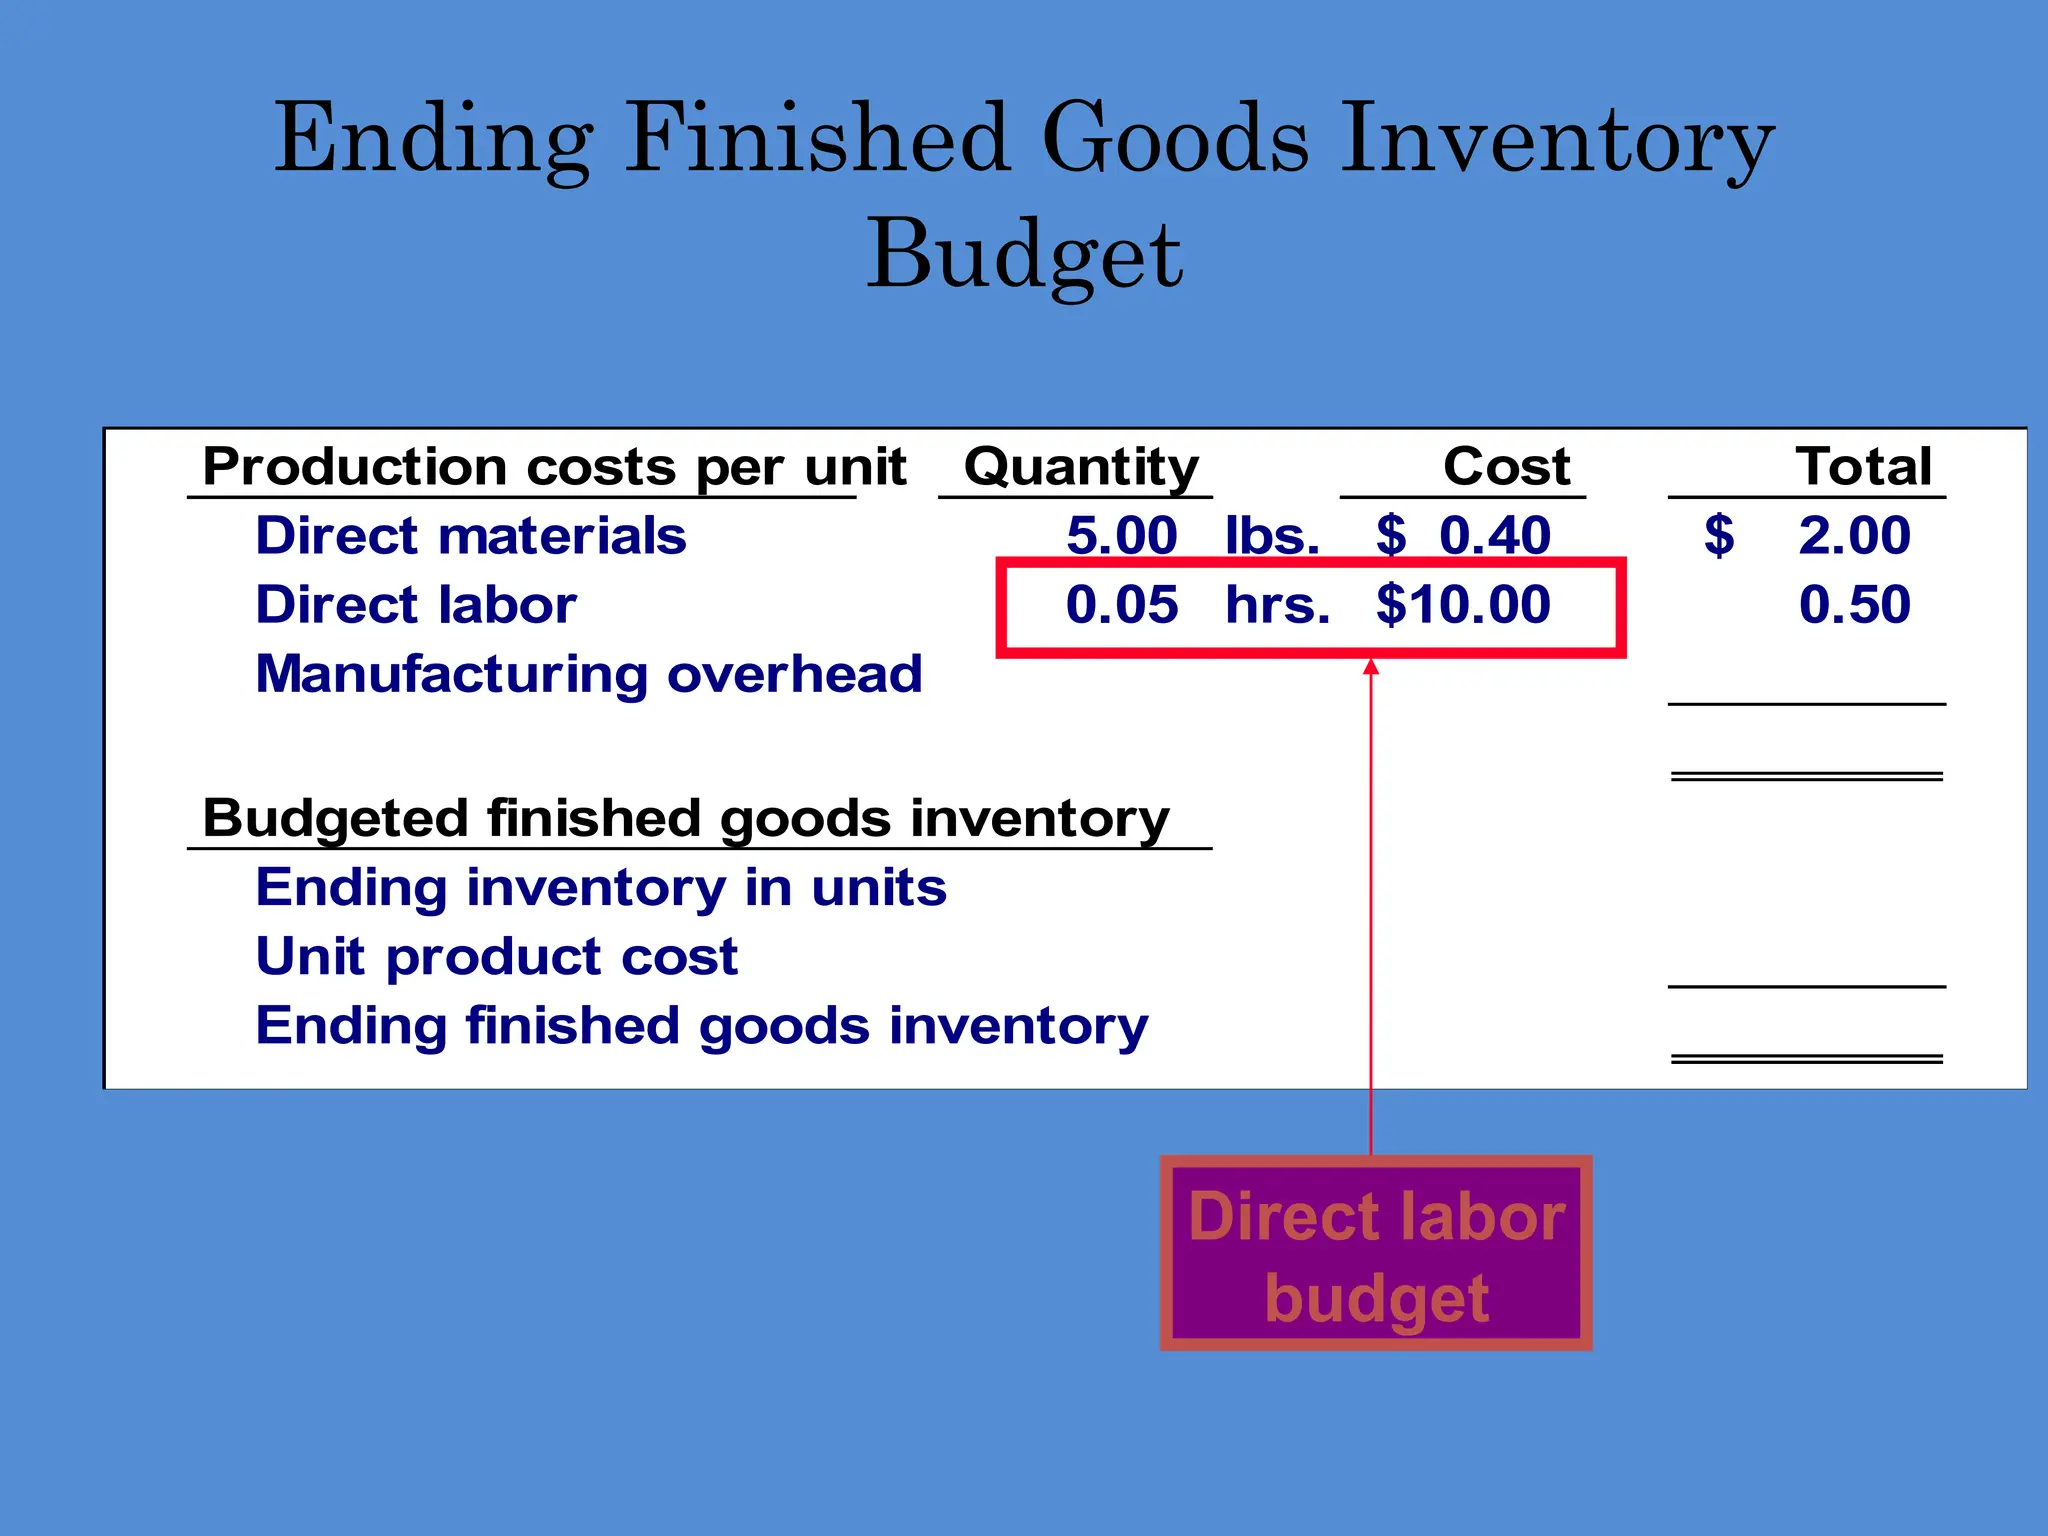
Production costs perunit Quantity Cost Total
Direct materials 5.00 lbs. 0.40
$ 2.00
$
Direct labor 0.05 hrs. 10.00
$ 0.50
Manufacturing overhead
Budgeted finished goods inventory
Ending inventory in units
Unit product cost
Ending finished goods inventory
Ending Finished Goods Inventory
Budget
Direct labor
budget
63.
Production costs perunit Quantity Cost Total
Direct materials 5.00 lbs. 0.40
$ 2.00
$
Direct labor 0.05 hrs. 10.00
$ 0.50
Manufacturing overhead 0.05 hrs. 49.70
$ 2.49
4.99
$
Budgeted finished goods inventory
Ending inventory in units
Unit product cost 4.99
$
Ending finished goods inventory
Ending Finished Goods Inventory
Budget
Total mfg. OH for quarter $251,000
Total labor hours required 5,050 hrs.
= $49.70 per hr.
(rounded)
Predetermined Overhead Rate:
64.
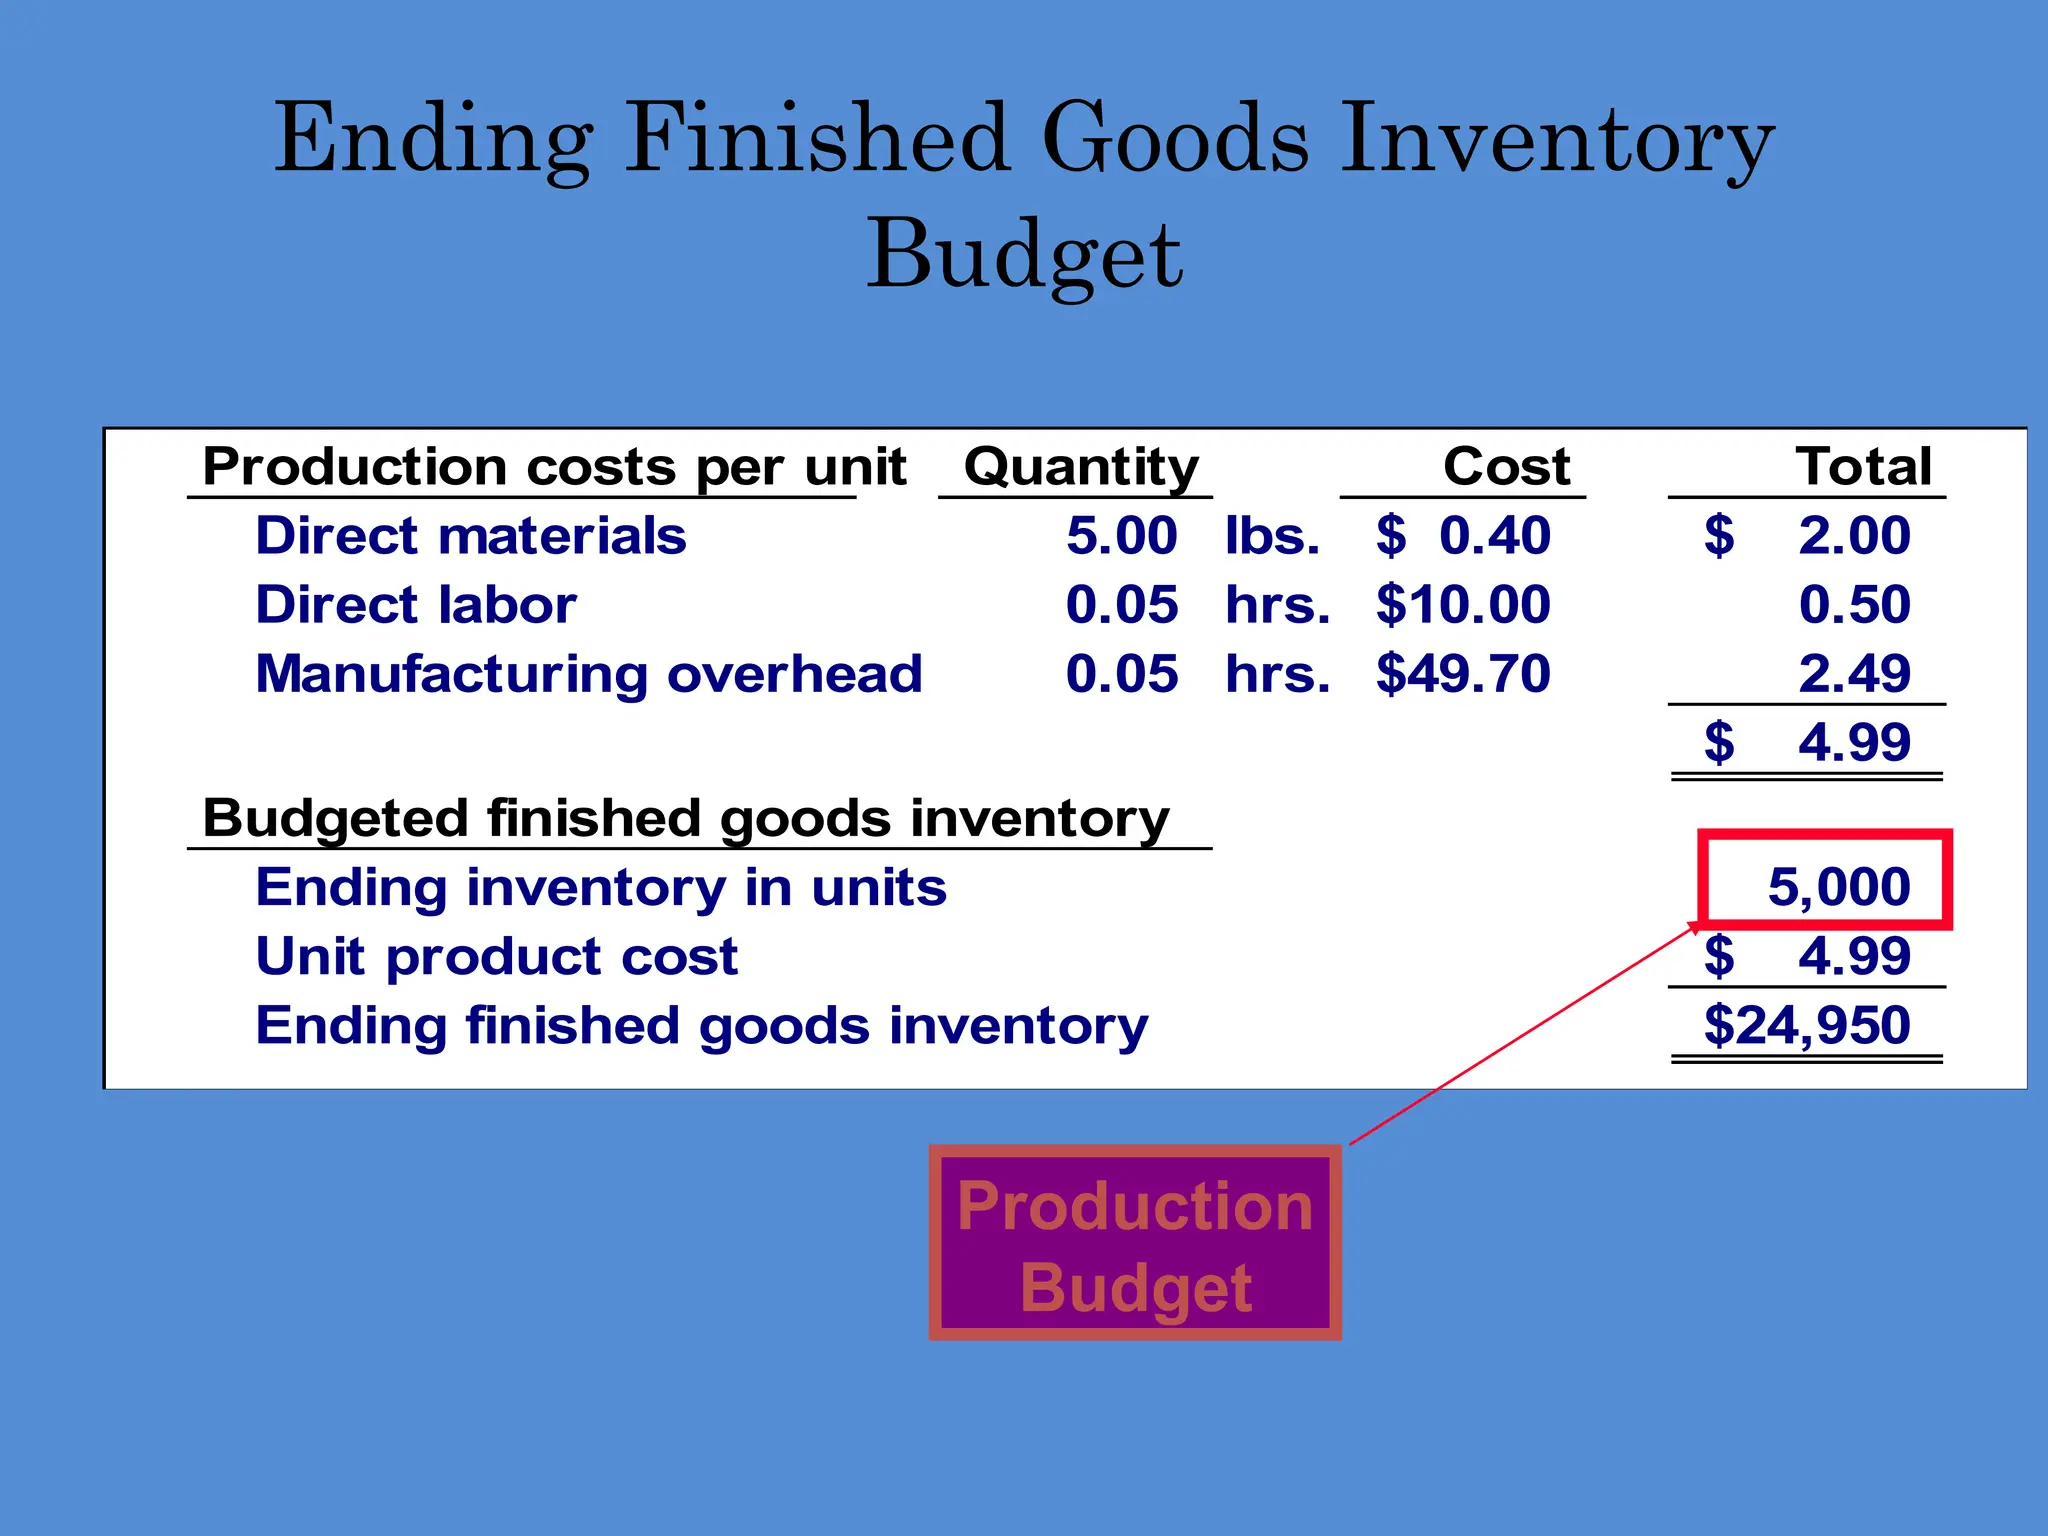
Production costs perunit Quantity Cost Total
Direct materials 5.00 lbs. 0.40
$ 2.00
$
Direct labor 0.05 hrs. 10.00
$ 0.50
Manufacturing overhead 0.05 hrs. 49.70
$ 2.49
4.99
$
Budgeted finished goods inventory
Ending inventory in units 5,000
Unit product cost 4.99
$
Ending finished goods inventory 24,950
$
Ending Finished Goods Inventory
Budget
Production
Budget
65.
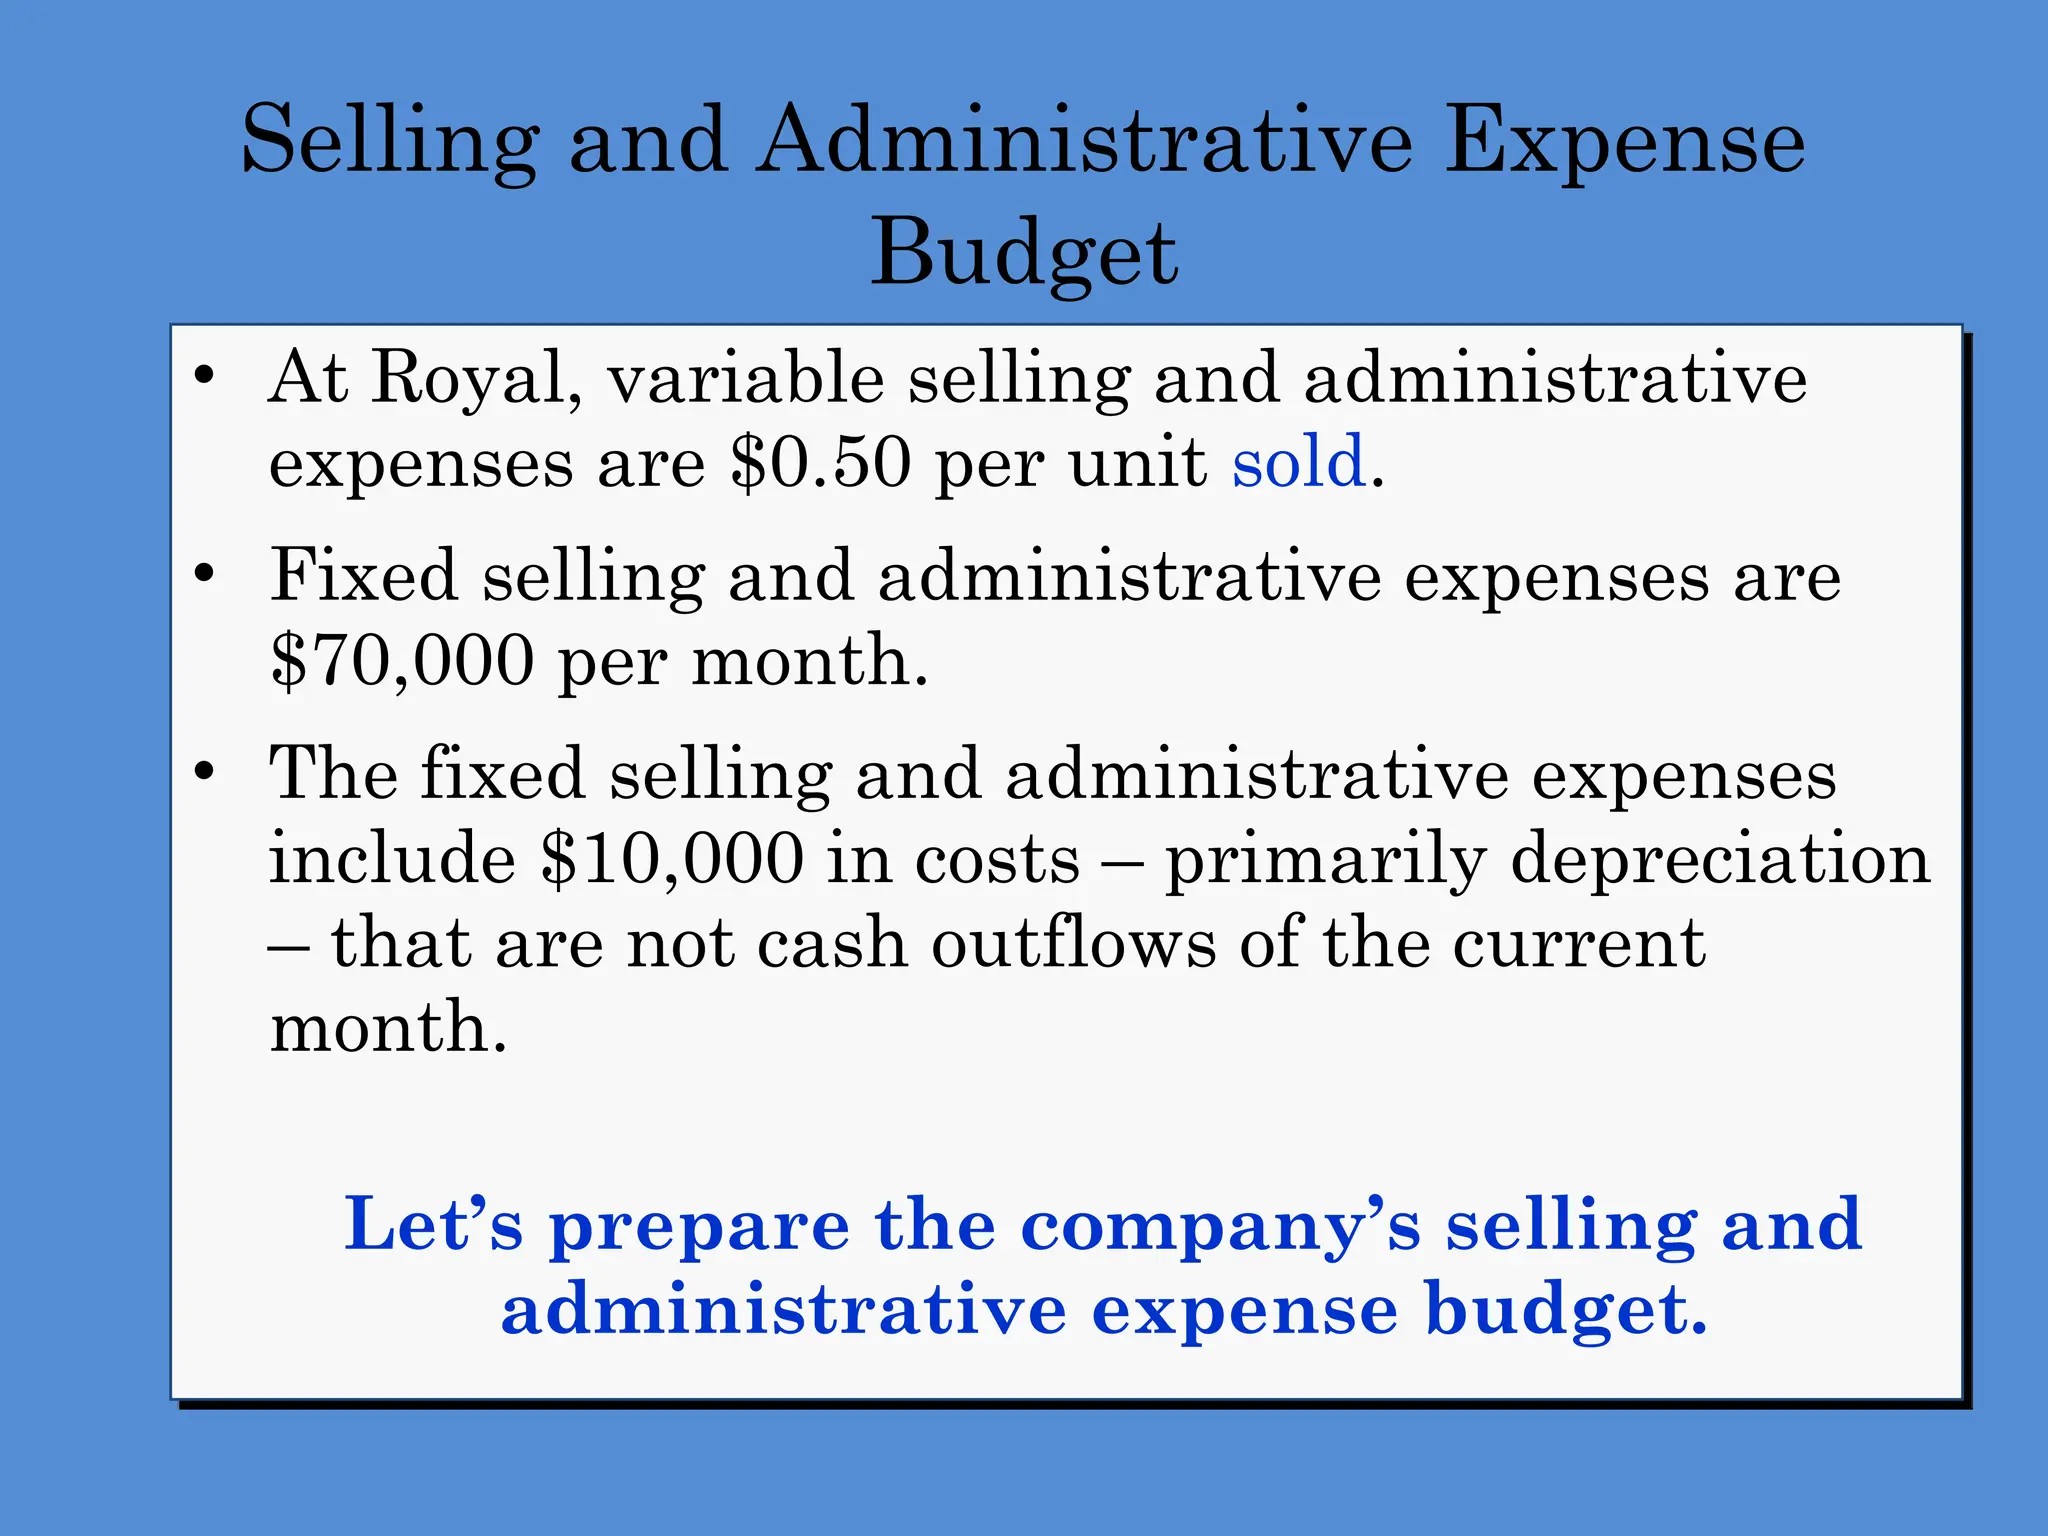
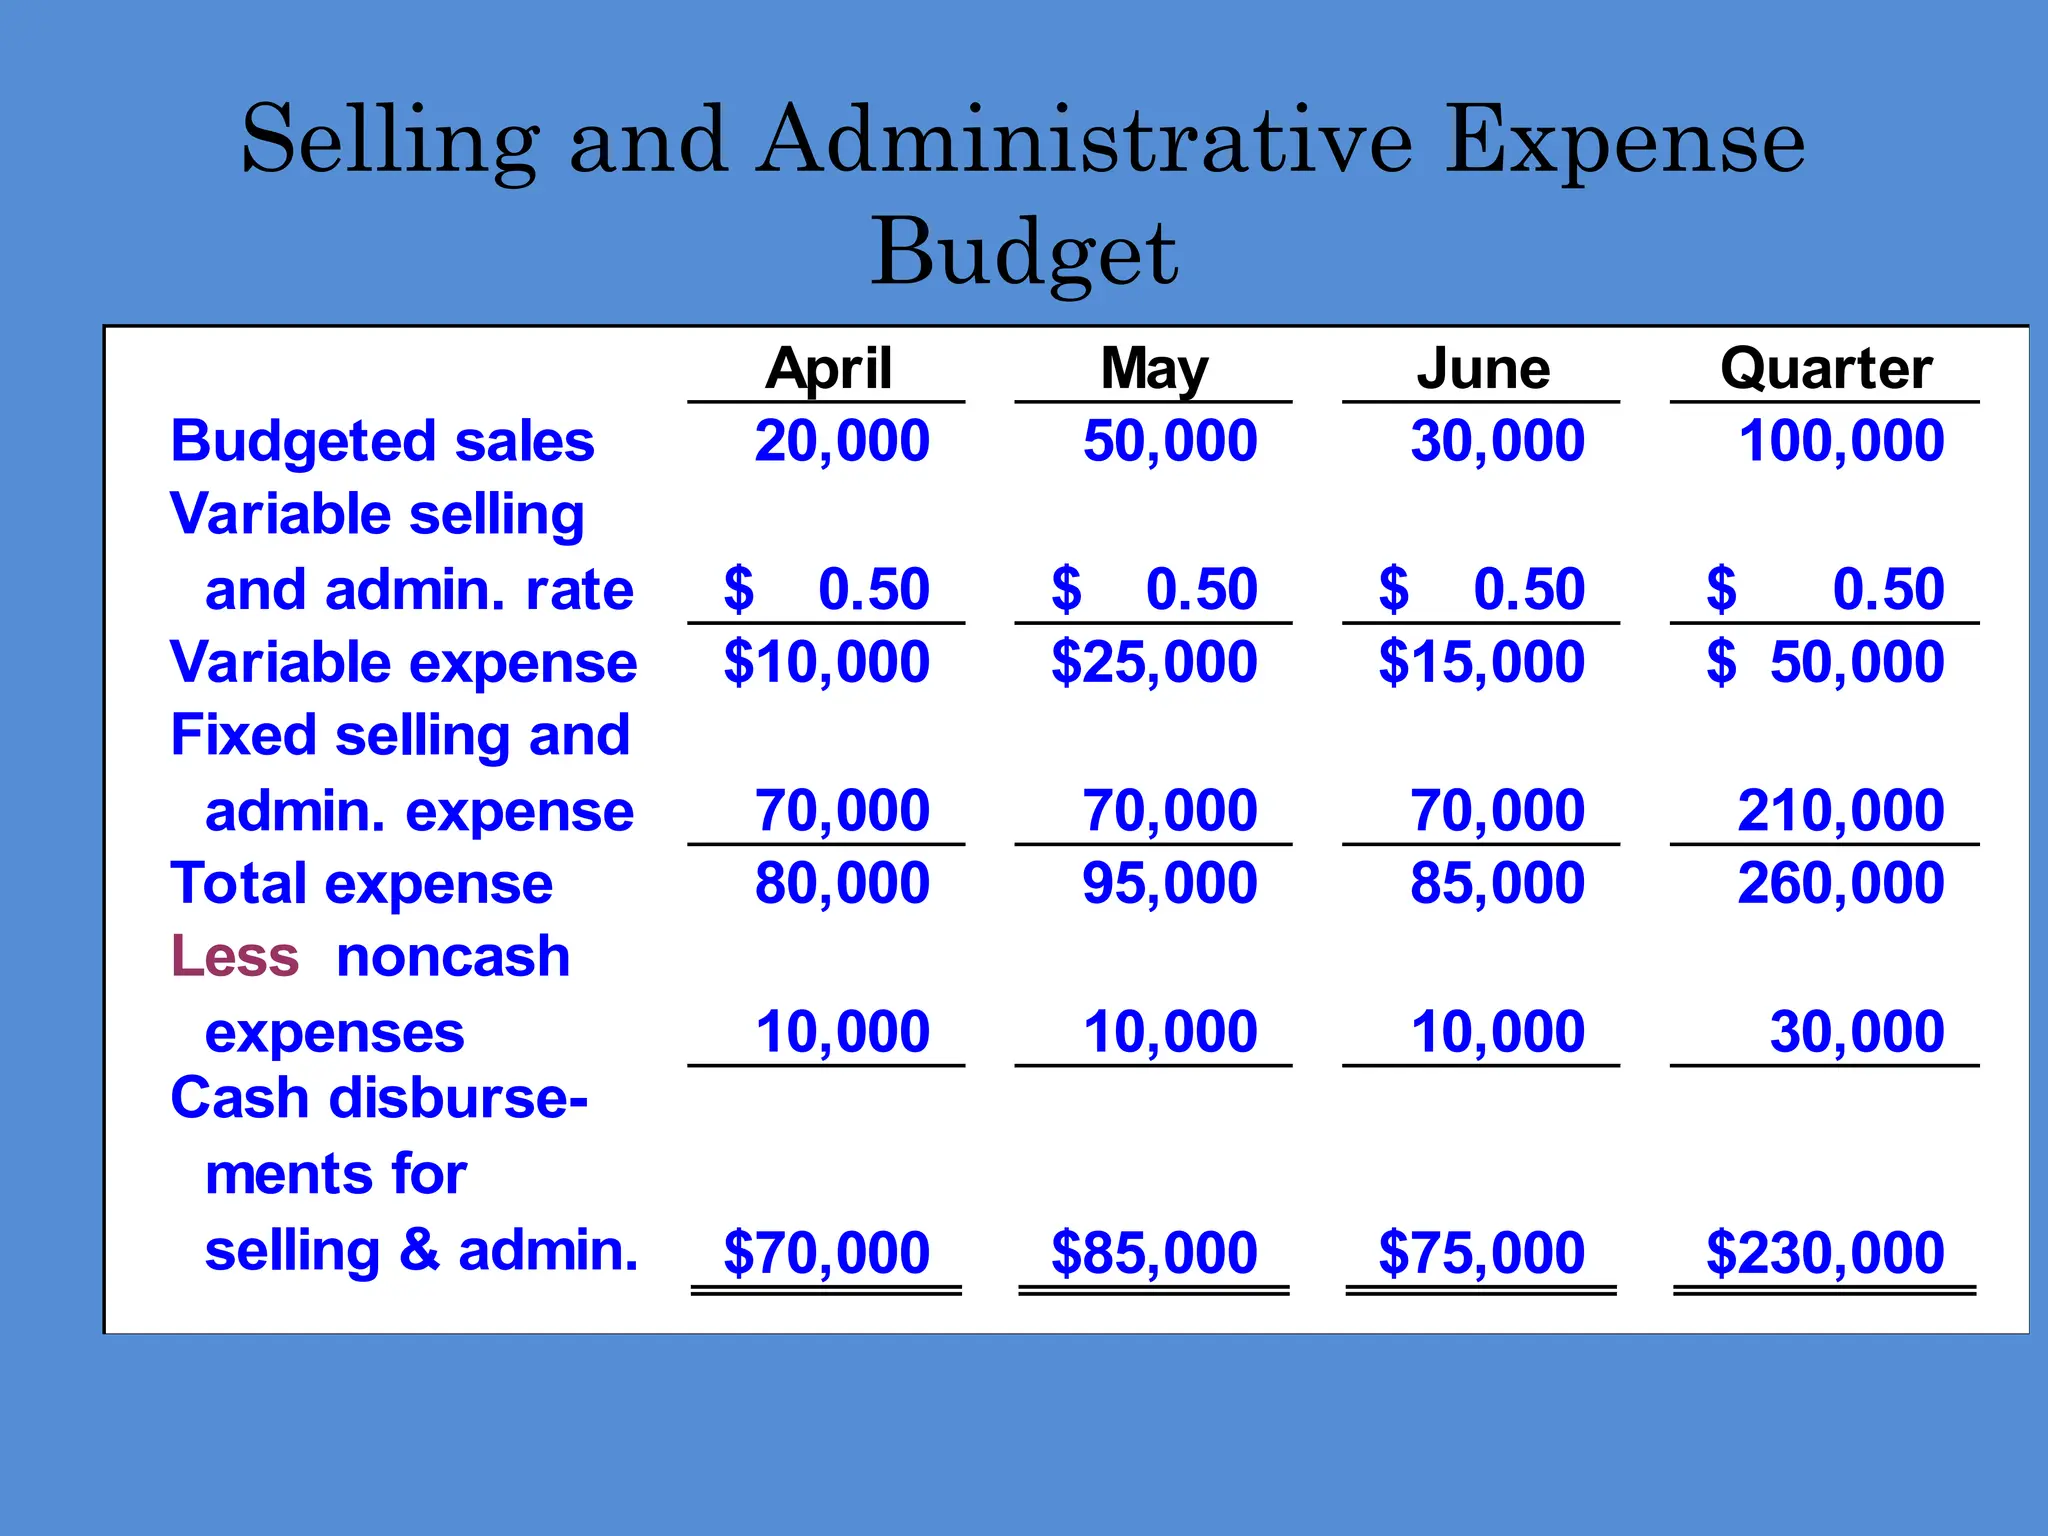
Selling and AdministrativeExpense
Budget
• At Royal, variable selling and administrative
expenses are $0.50 per unit sold.
• Fixed selling and administrative expenses are
$70,000 per month.
• The fixed selling and administrative expenses
include $10,000 in costs – primarily depreciation
– that are not cash outflows of the current
month.
Let’s prepare the company’s selling and
administrative expense budget.
66.
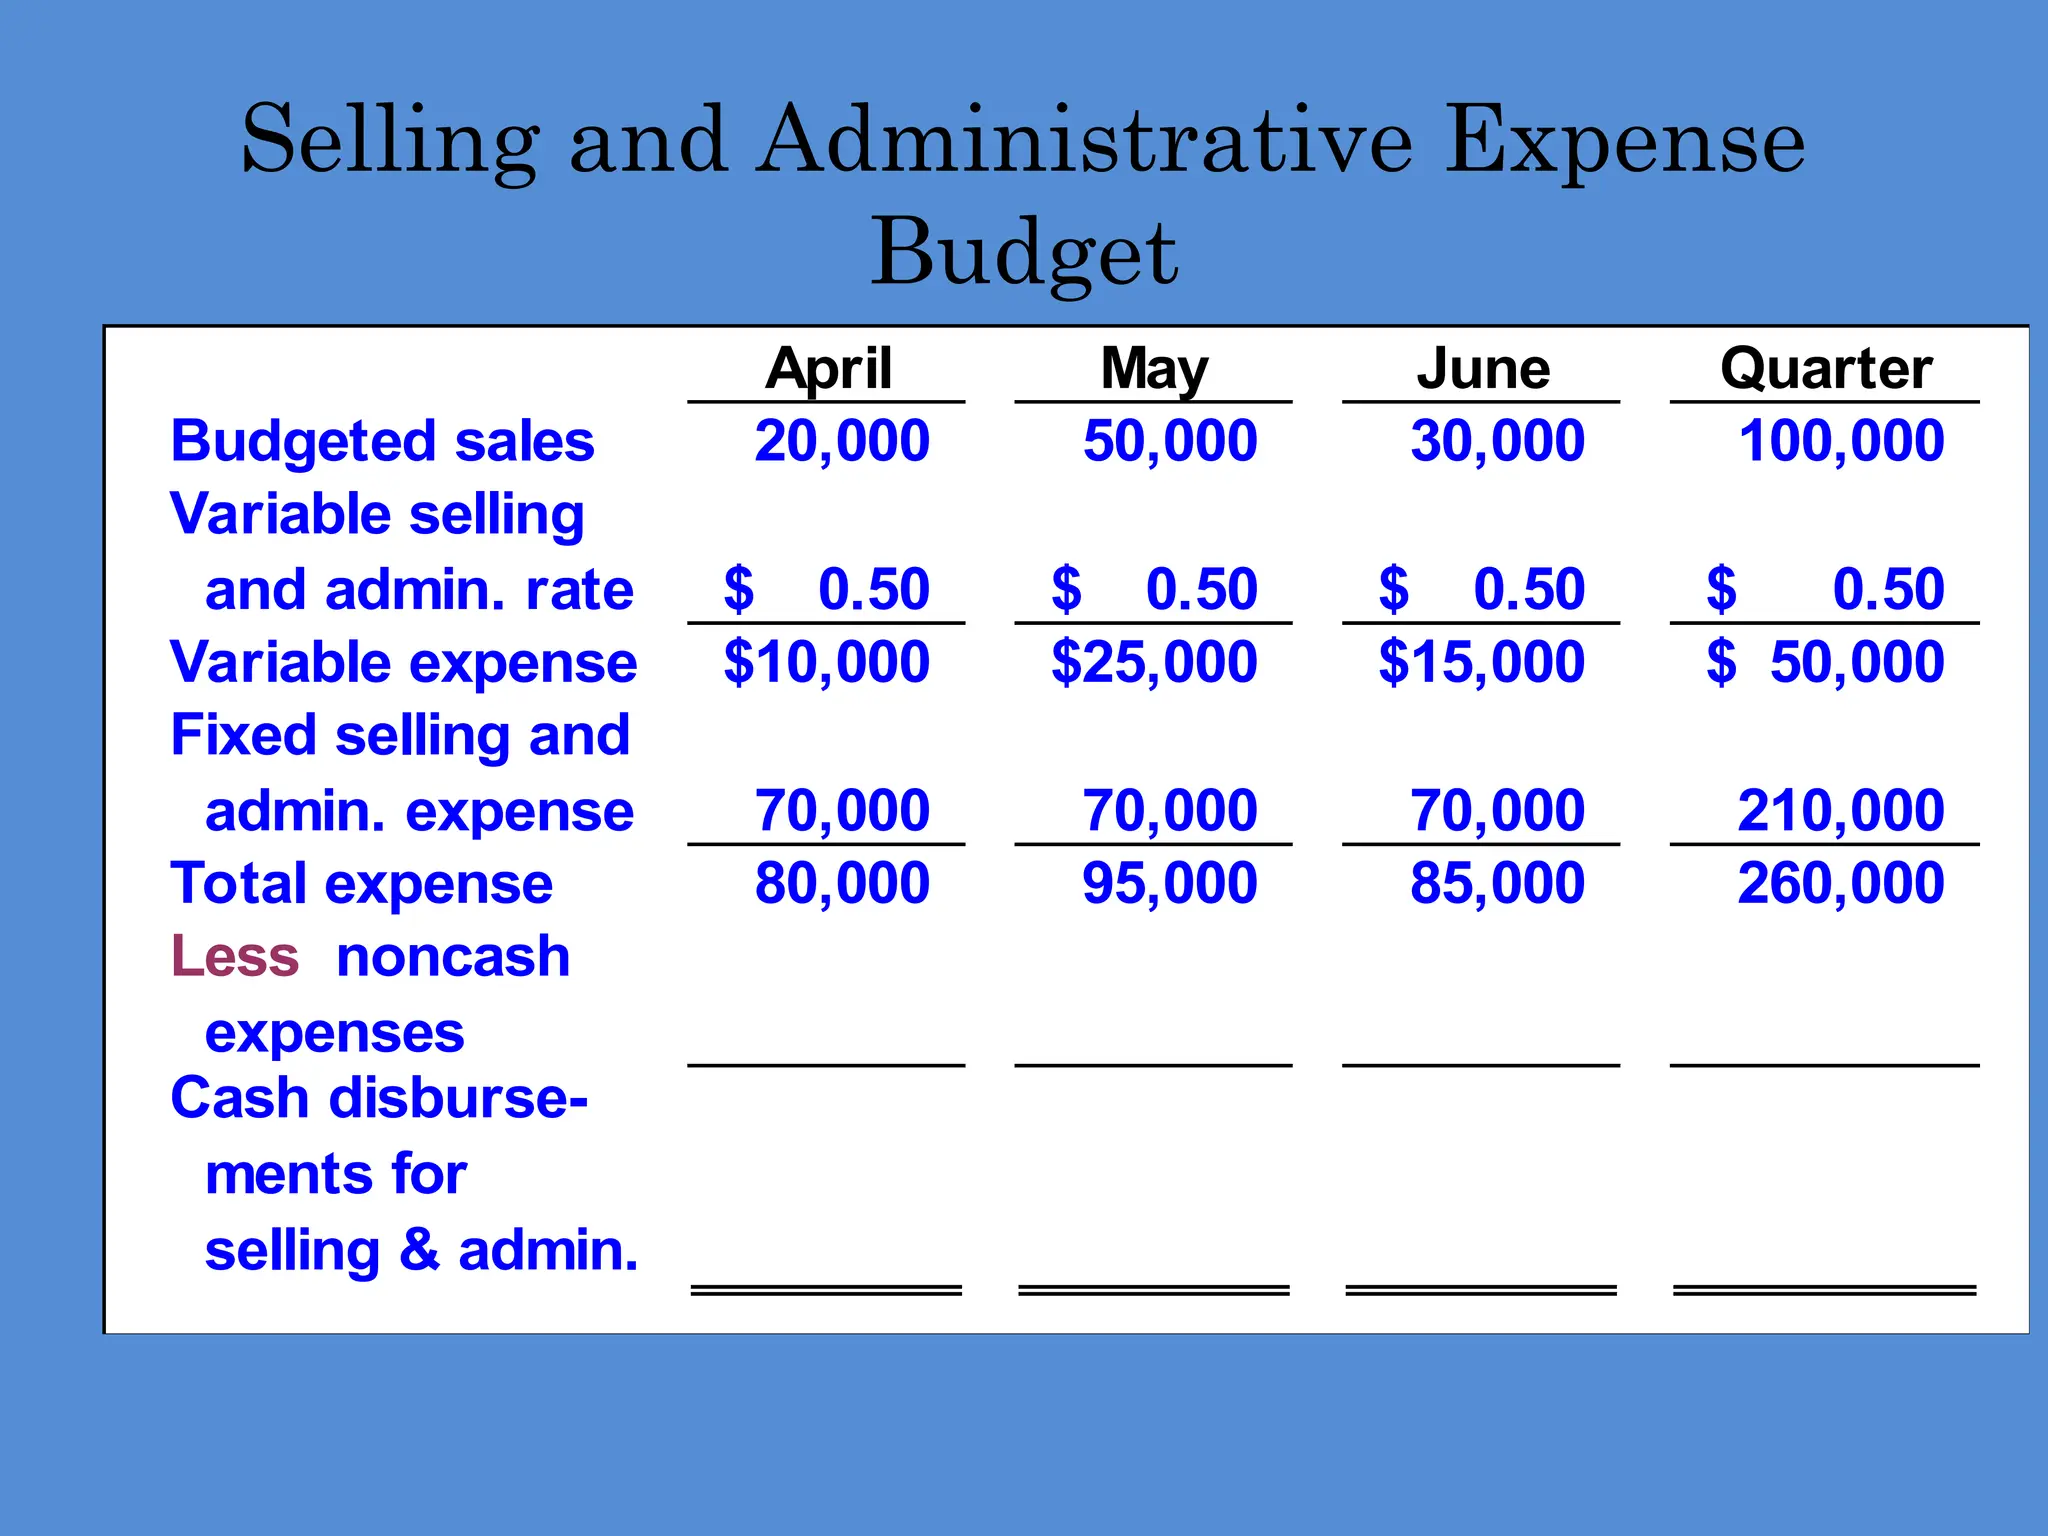
Selling and AdministrativeExpense
Budget
April May June Quarter
Budgeted sales 20,000 50,000 30,000 100,000
Variable selling
and admin. rate 0.50
$ 0.50
$ 0.50
$ 0.50
$
Variable expense 10,000
$ 25,000
$ 15,000
$ 50,000
$
Fixed selling and
admin. expense 70,000 70,000 70,000 210,000
Total expense 80,000 95,000 85,000 260,000
Less noncash
expenses
Cash disburse-
ments for
selling & admin.
67.
Selling and AdministrativeExpense
Budget
April May June Quarter
Budgeted sales 20,000 50,000 30,000 100,000
Variable selling
and admin. rate 0.50
$ 0.50
$ 0.50
$ 0.50
$
Variable expense 10,000
$ 25,000
$ 15,000
$ 50,000
$
Fixed selling and
admin. expense 70,000 70,000 70,000 210,000
Total expense 80,000 95,000 85,000 260,000
Less noncash
expenses 10,000 10,000 10,000 30,000
Cash disburse-
ments for
selling & admin. 70,000
$ 85,000
$ 75,000
$ 230,000
$
68.
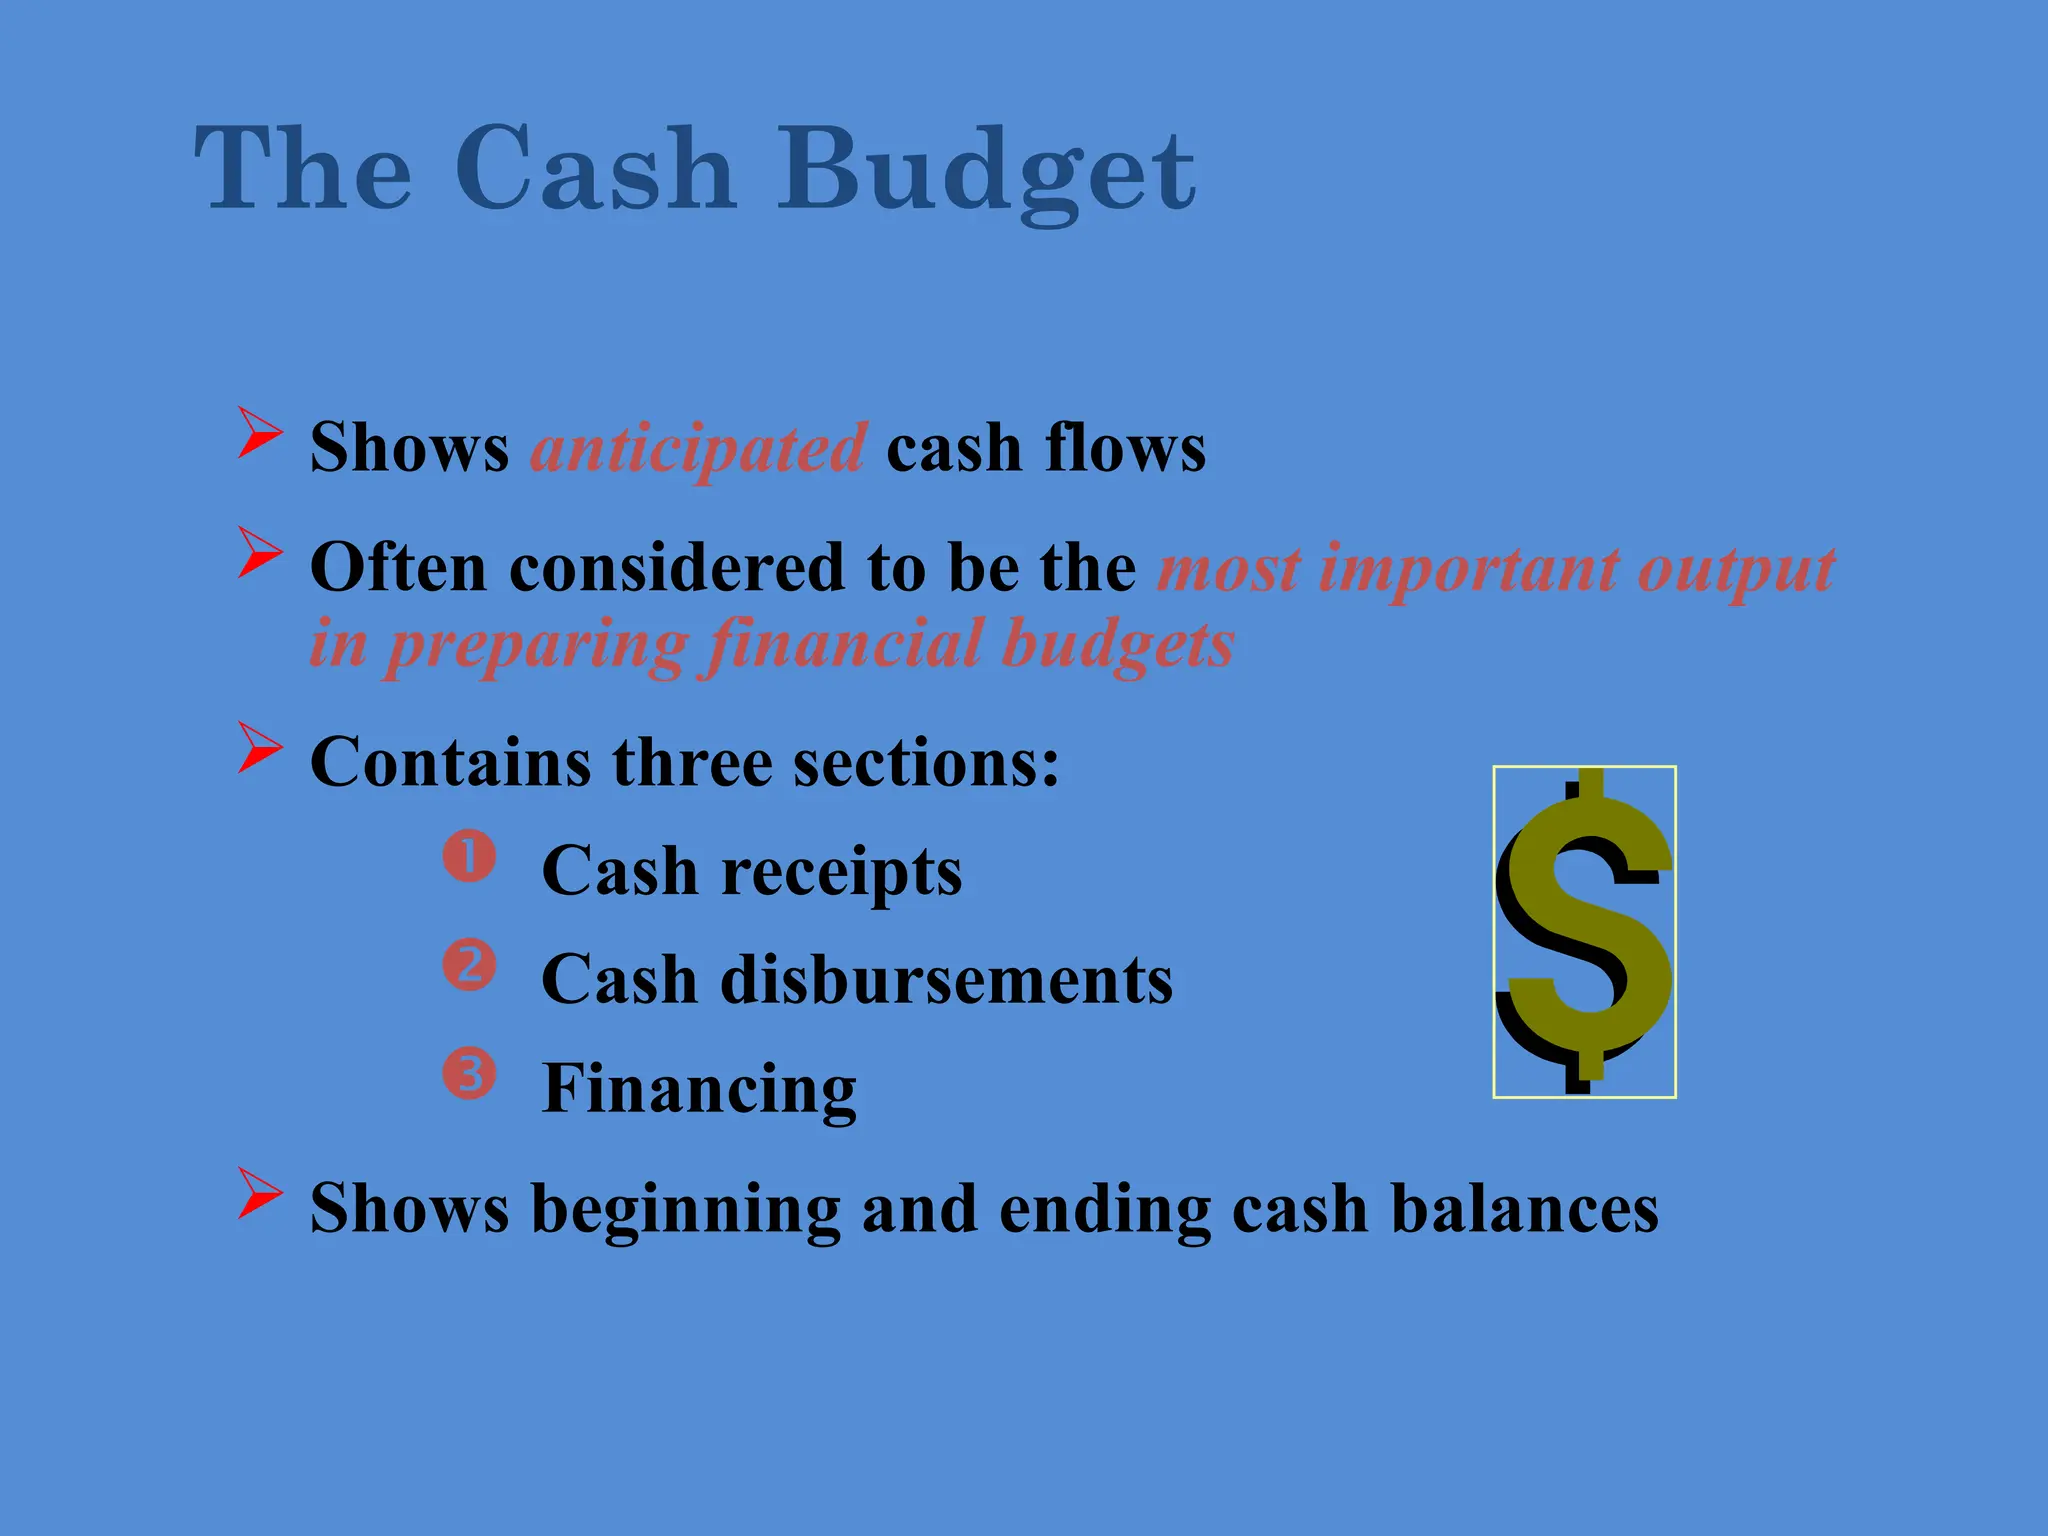
Shows anticipatedcash flows
Often considered to be the most important output
in preparing financial budgets
Contains three sections:
Cash receipts
Cash disbursements
Financing
Shows beginning and ending cash balances
The Cash Budget
69.
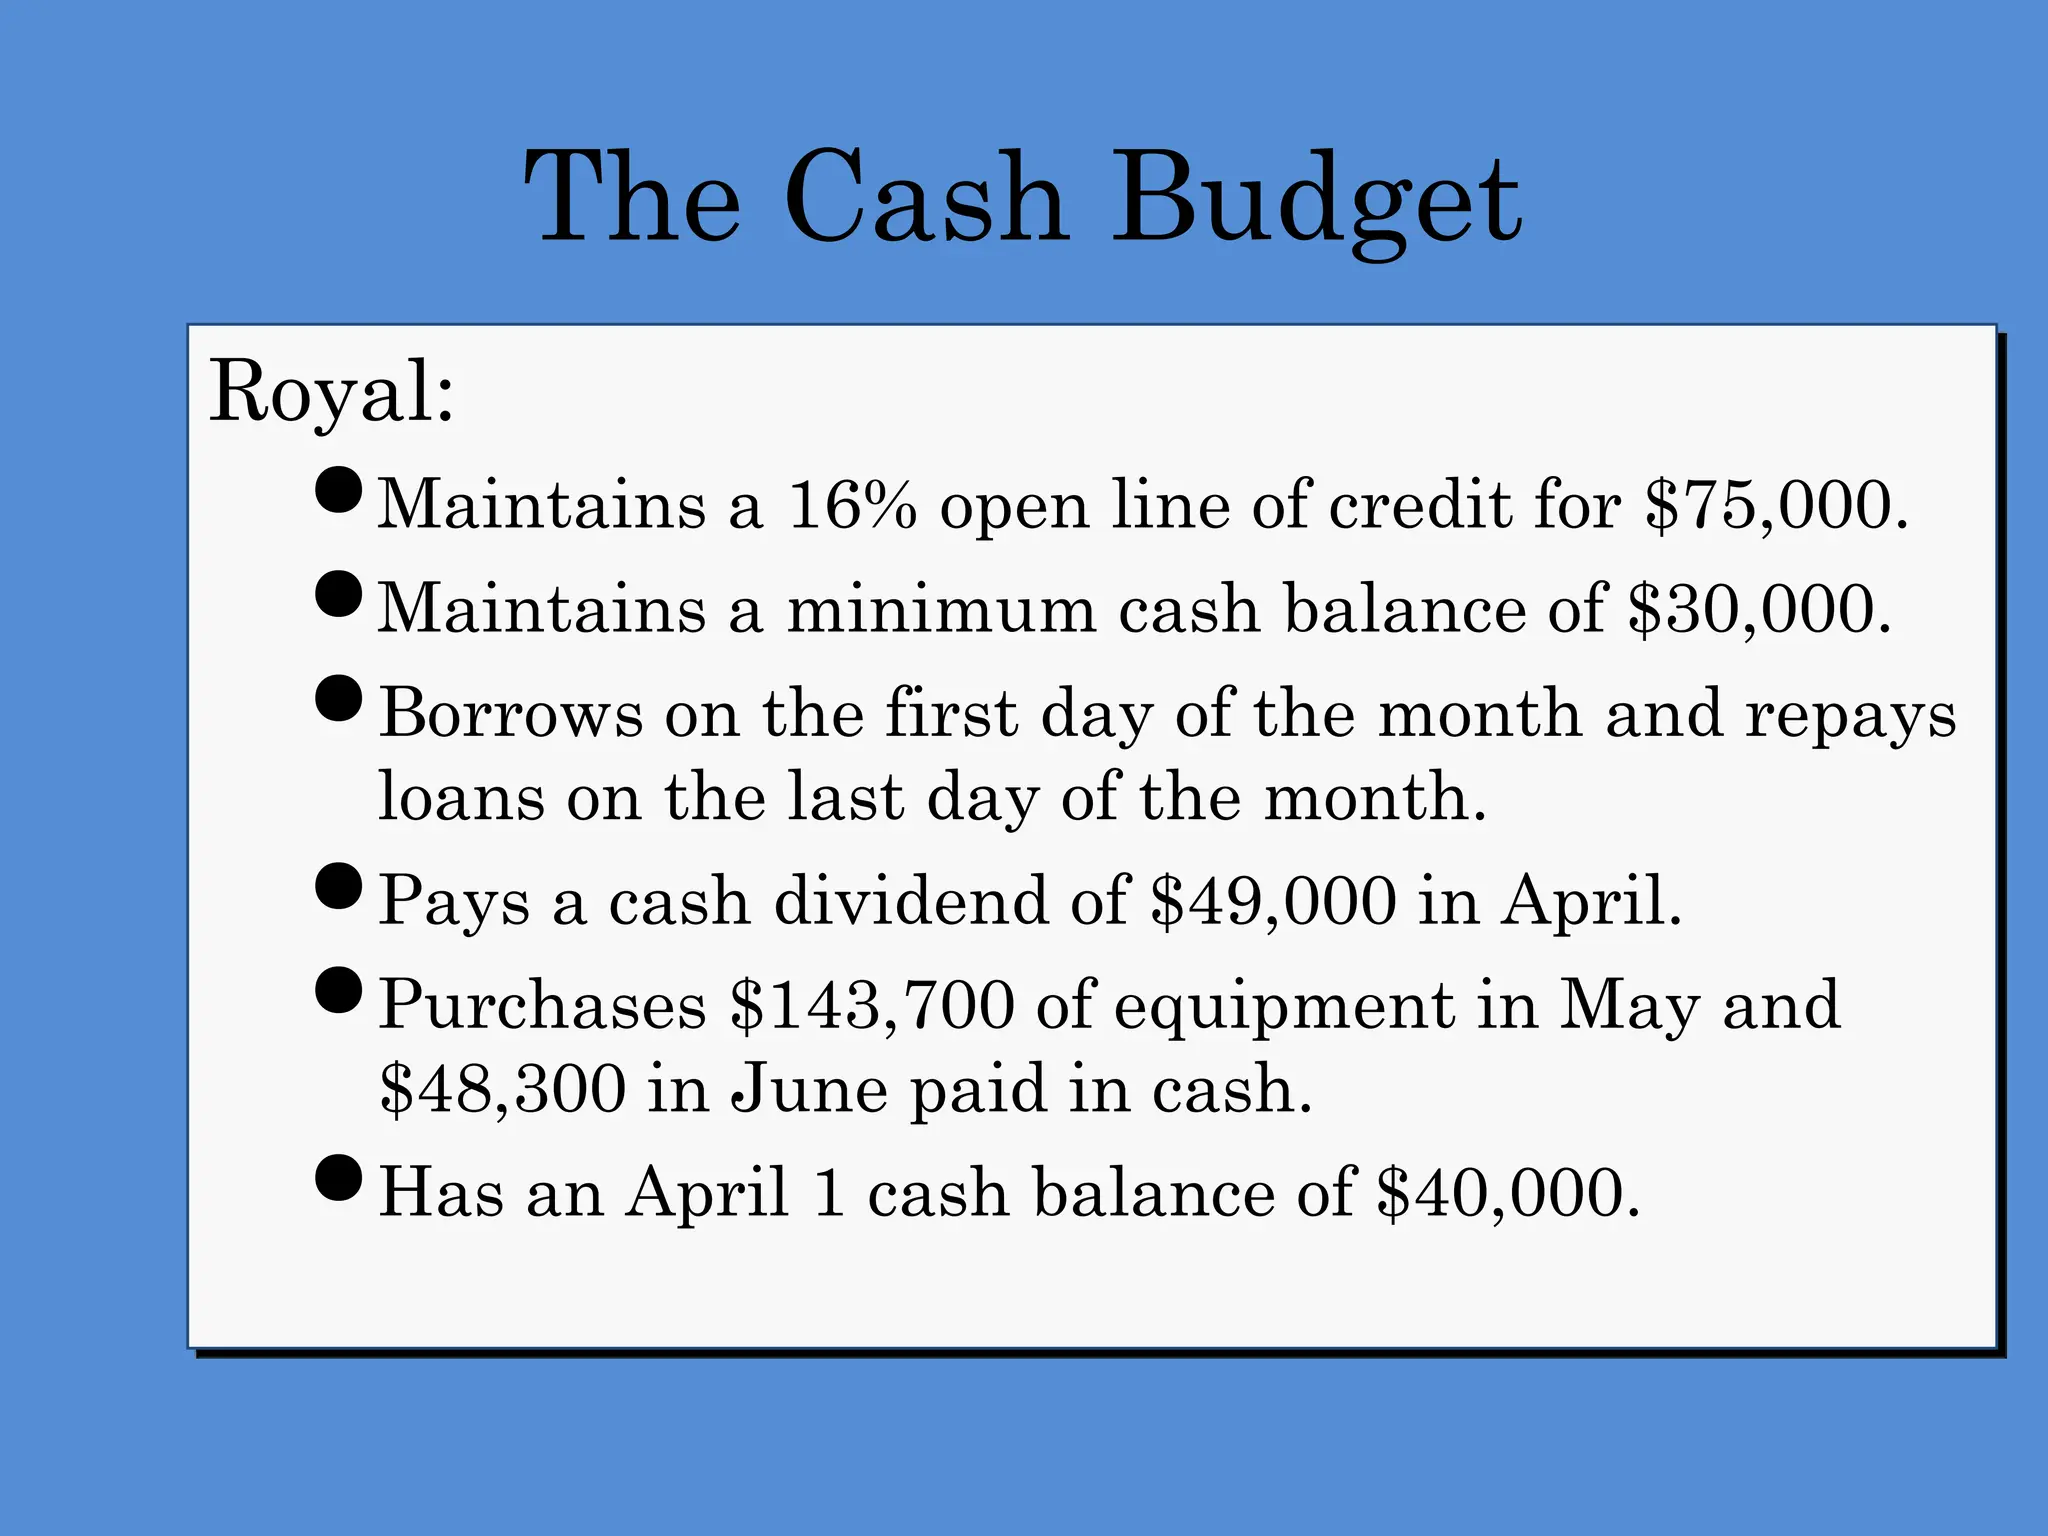
The Cash Budget
Royal:
Maintains a 16% open line of credit for $75,000.
Maintains a minimum cash balance of $30,000.
Borrows on the first day of the month and repays
loans on the last day of the month.
Pays a cash dividend of $49,000 in April.
Purchases $143,700 of equipment in May and
$48,300 in June paid in cash.
Has an April 1 cash balance of $40,000.
70.
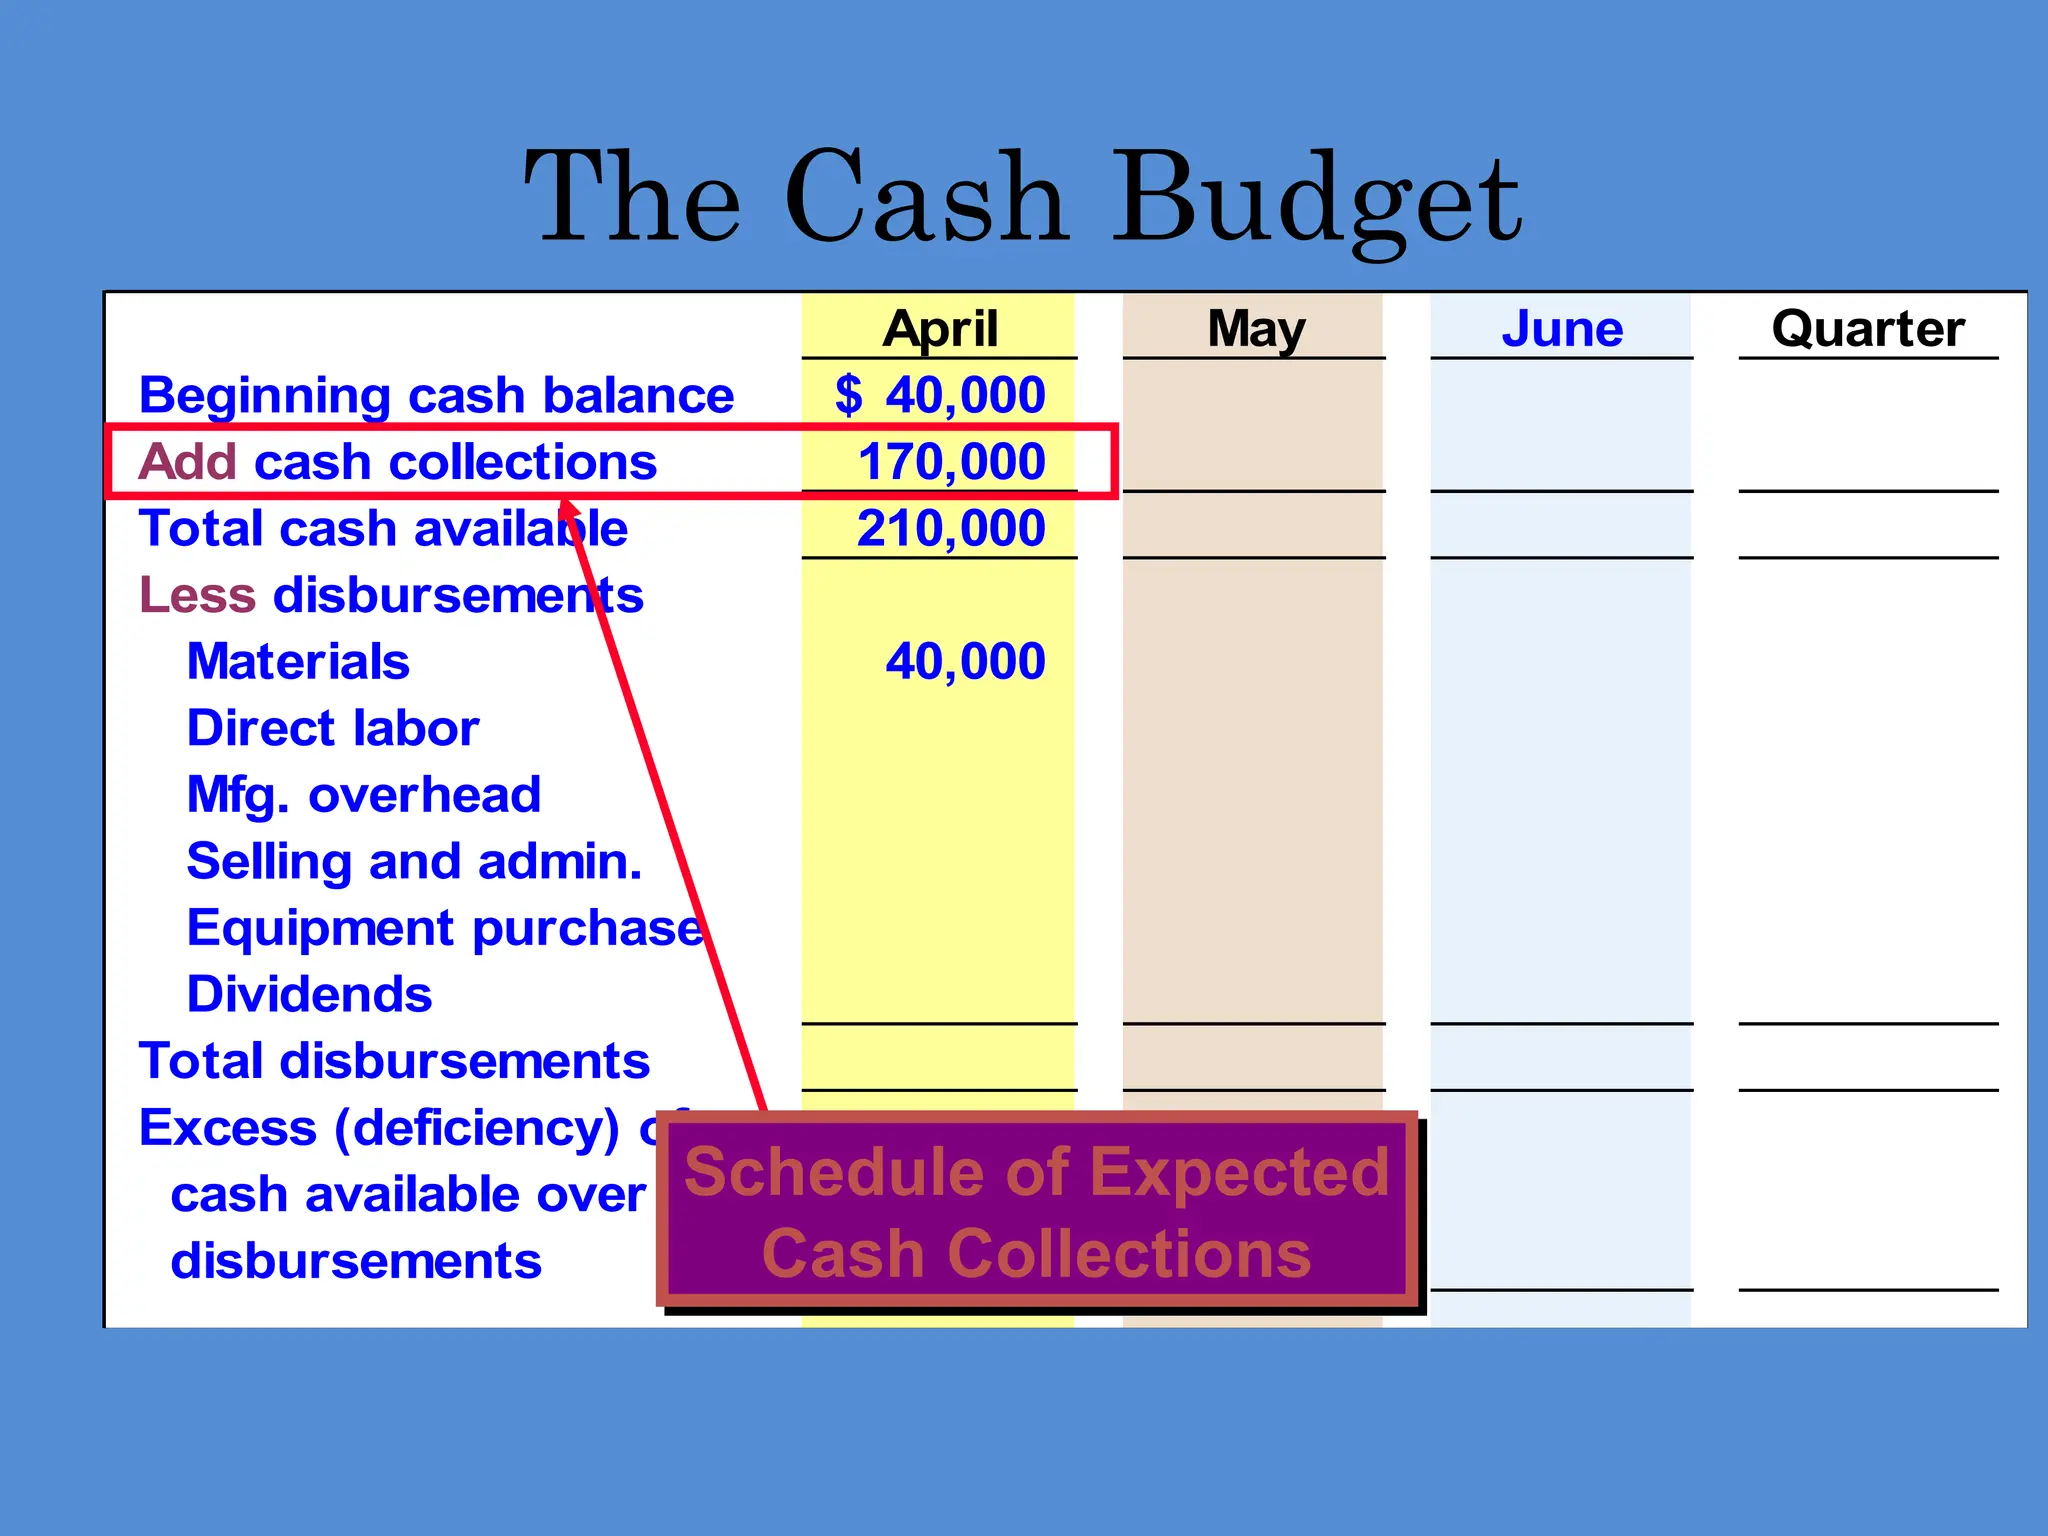
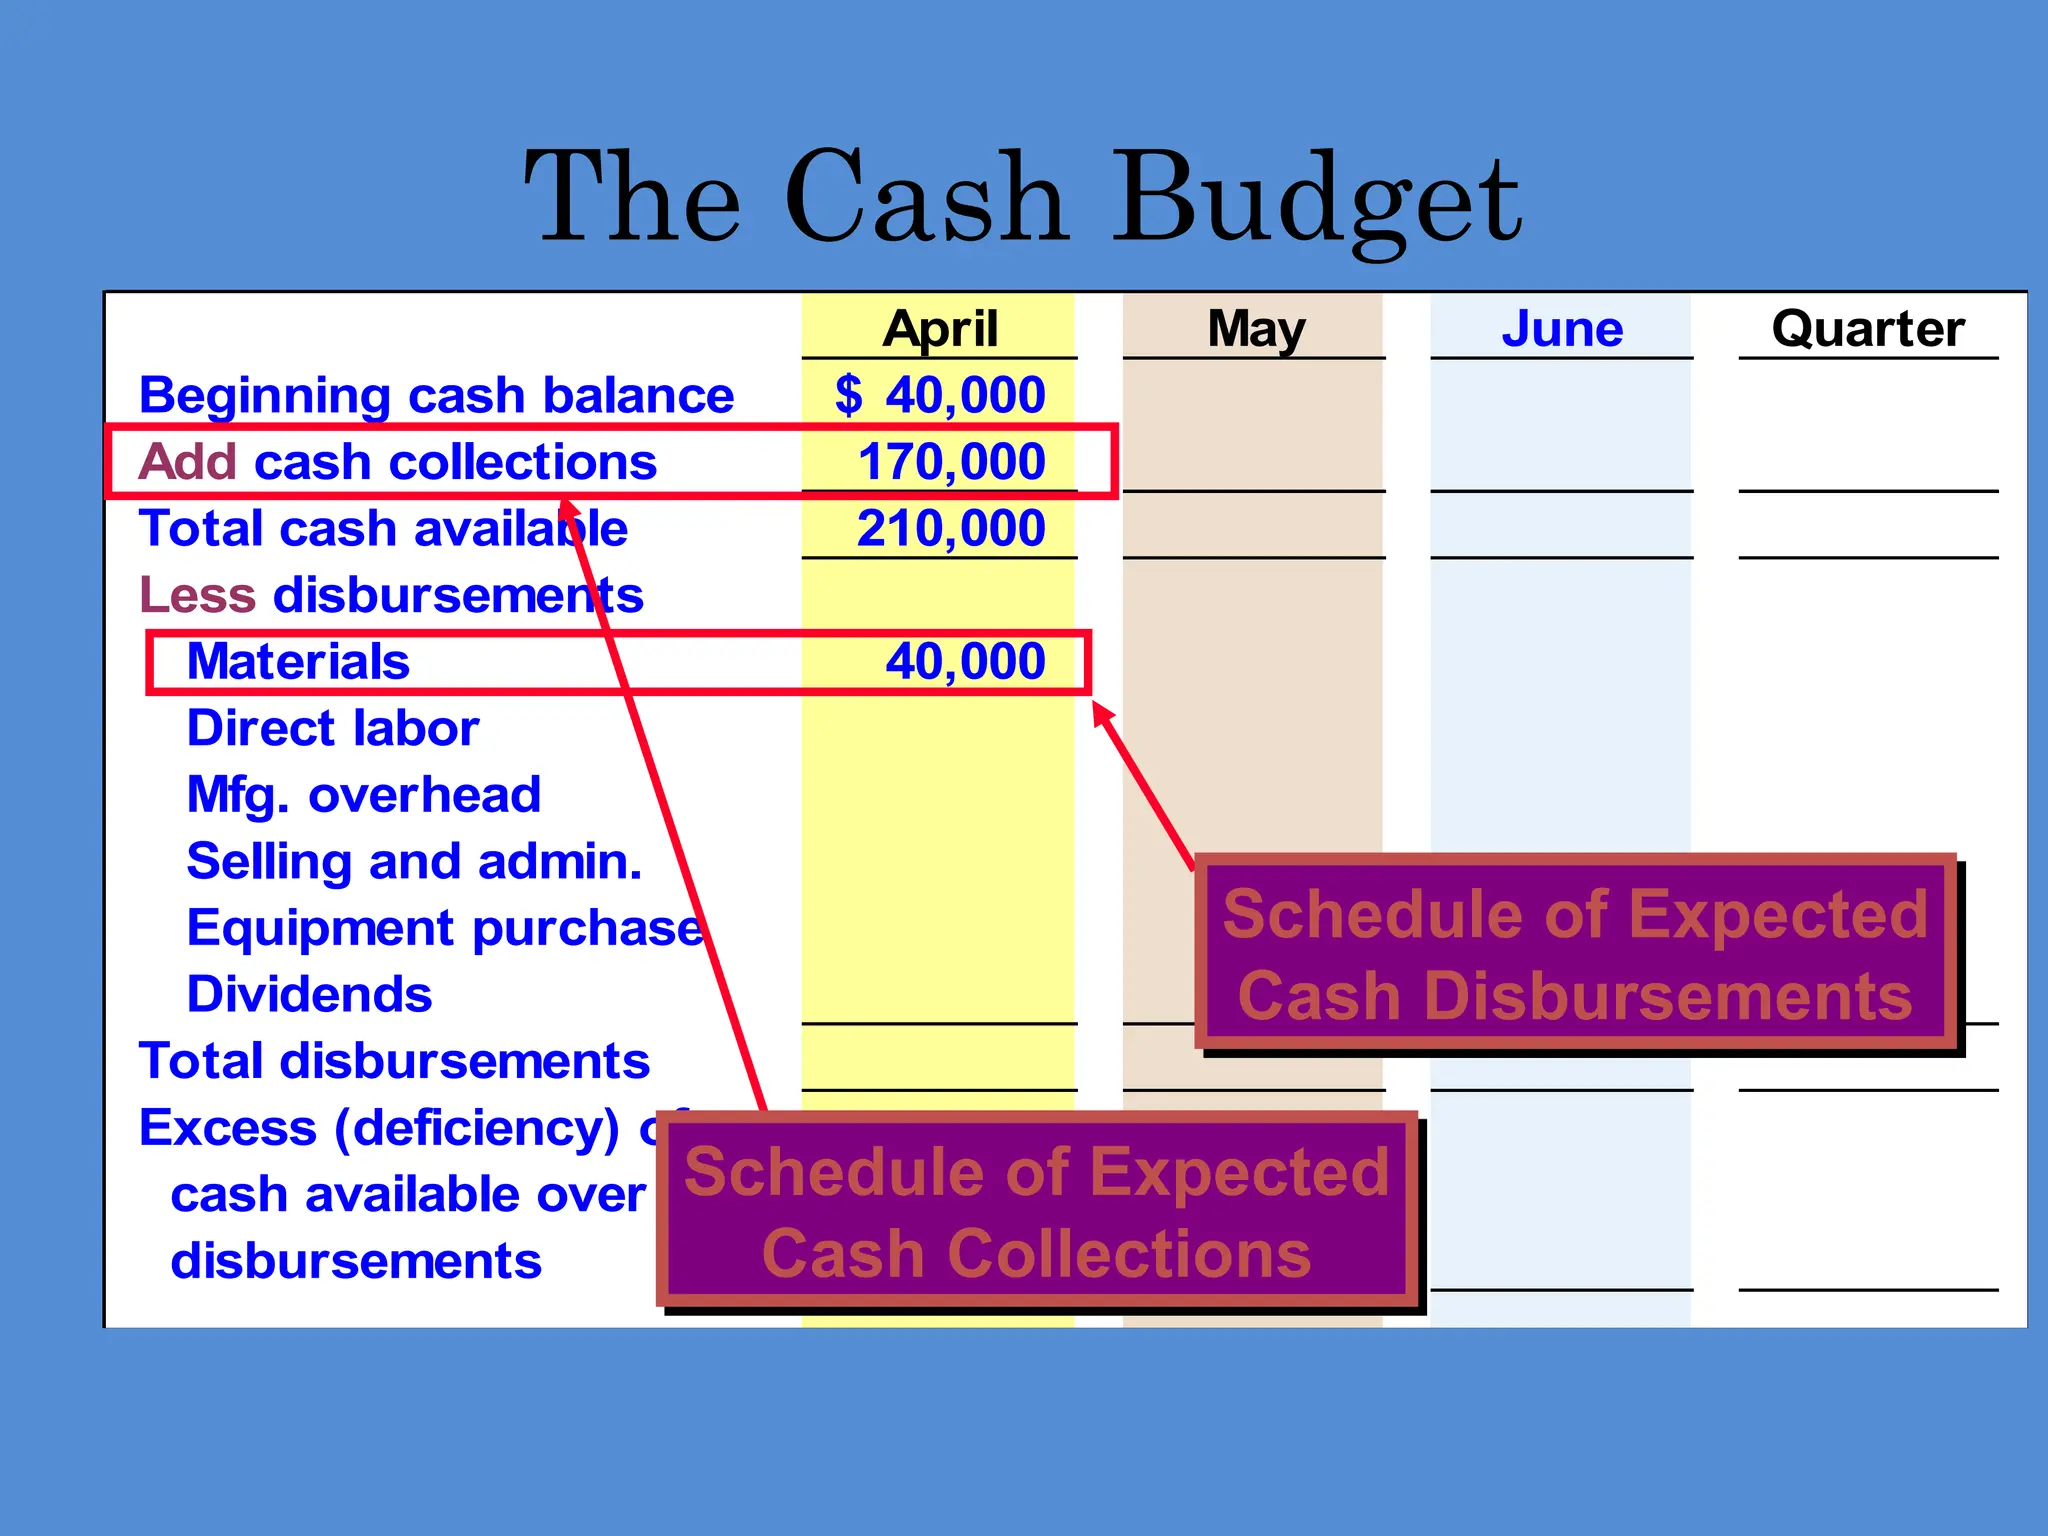
April May JuneQuarter
Beginning cash balance 40,000
$
Add cash collections 170,000
Total cash available 210,000
Less disbursements
Materials 40,000
Direct labor
Mfg. overhead
Selling and admin.
Equipment purchase
Dividends
Total disbursements
Excess (deficiency) of
cash available over
disbursements
The Cash Budget
Schedule of Expected
Cash Collections
71.
April May JuneQuarter
Beginning cash balance 40,000
$
Add cash collections 170,000
Total cash available 210,000
Less disbursements
Materials 40,000
Direct labor
Mfg. overhead
Selling and admin.
Equipment purchase
Dividends
Total disbursements
Excess (deficiency) of
cash available over
disbursements
The Cash Budget
Schedule of Expected
Cash Collections
Schedule of Expected
Cash Disbursements
72.
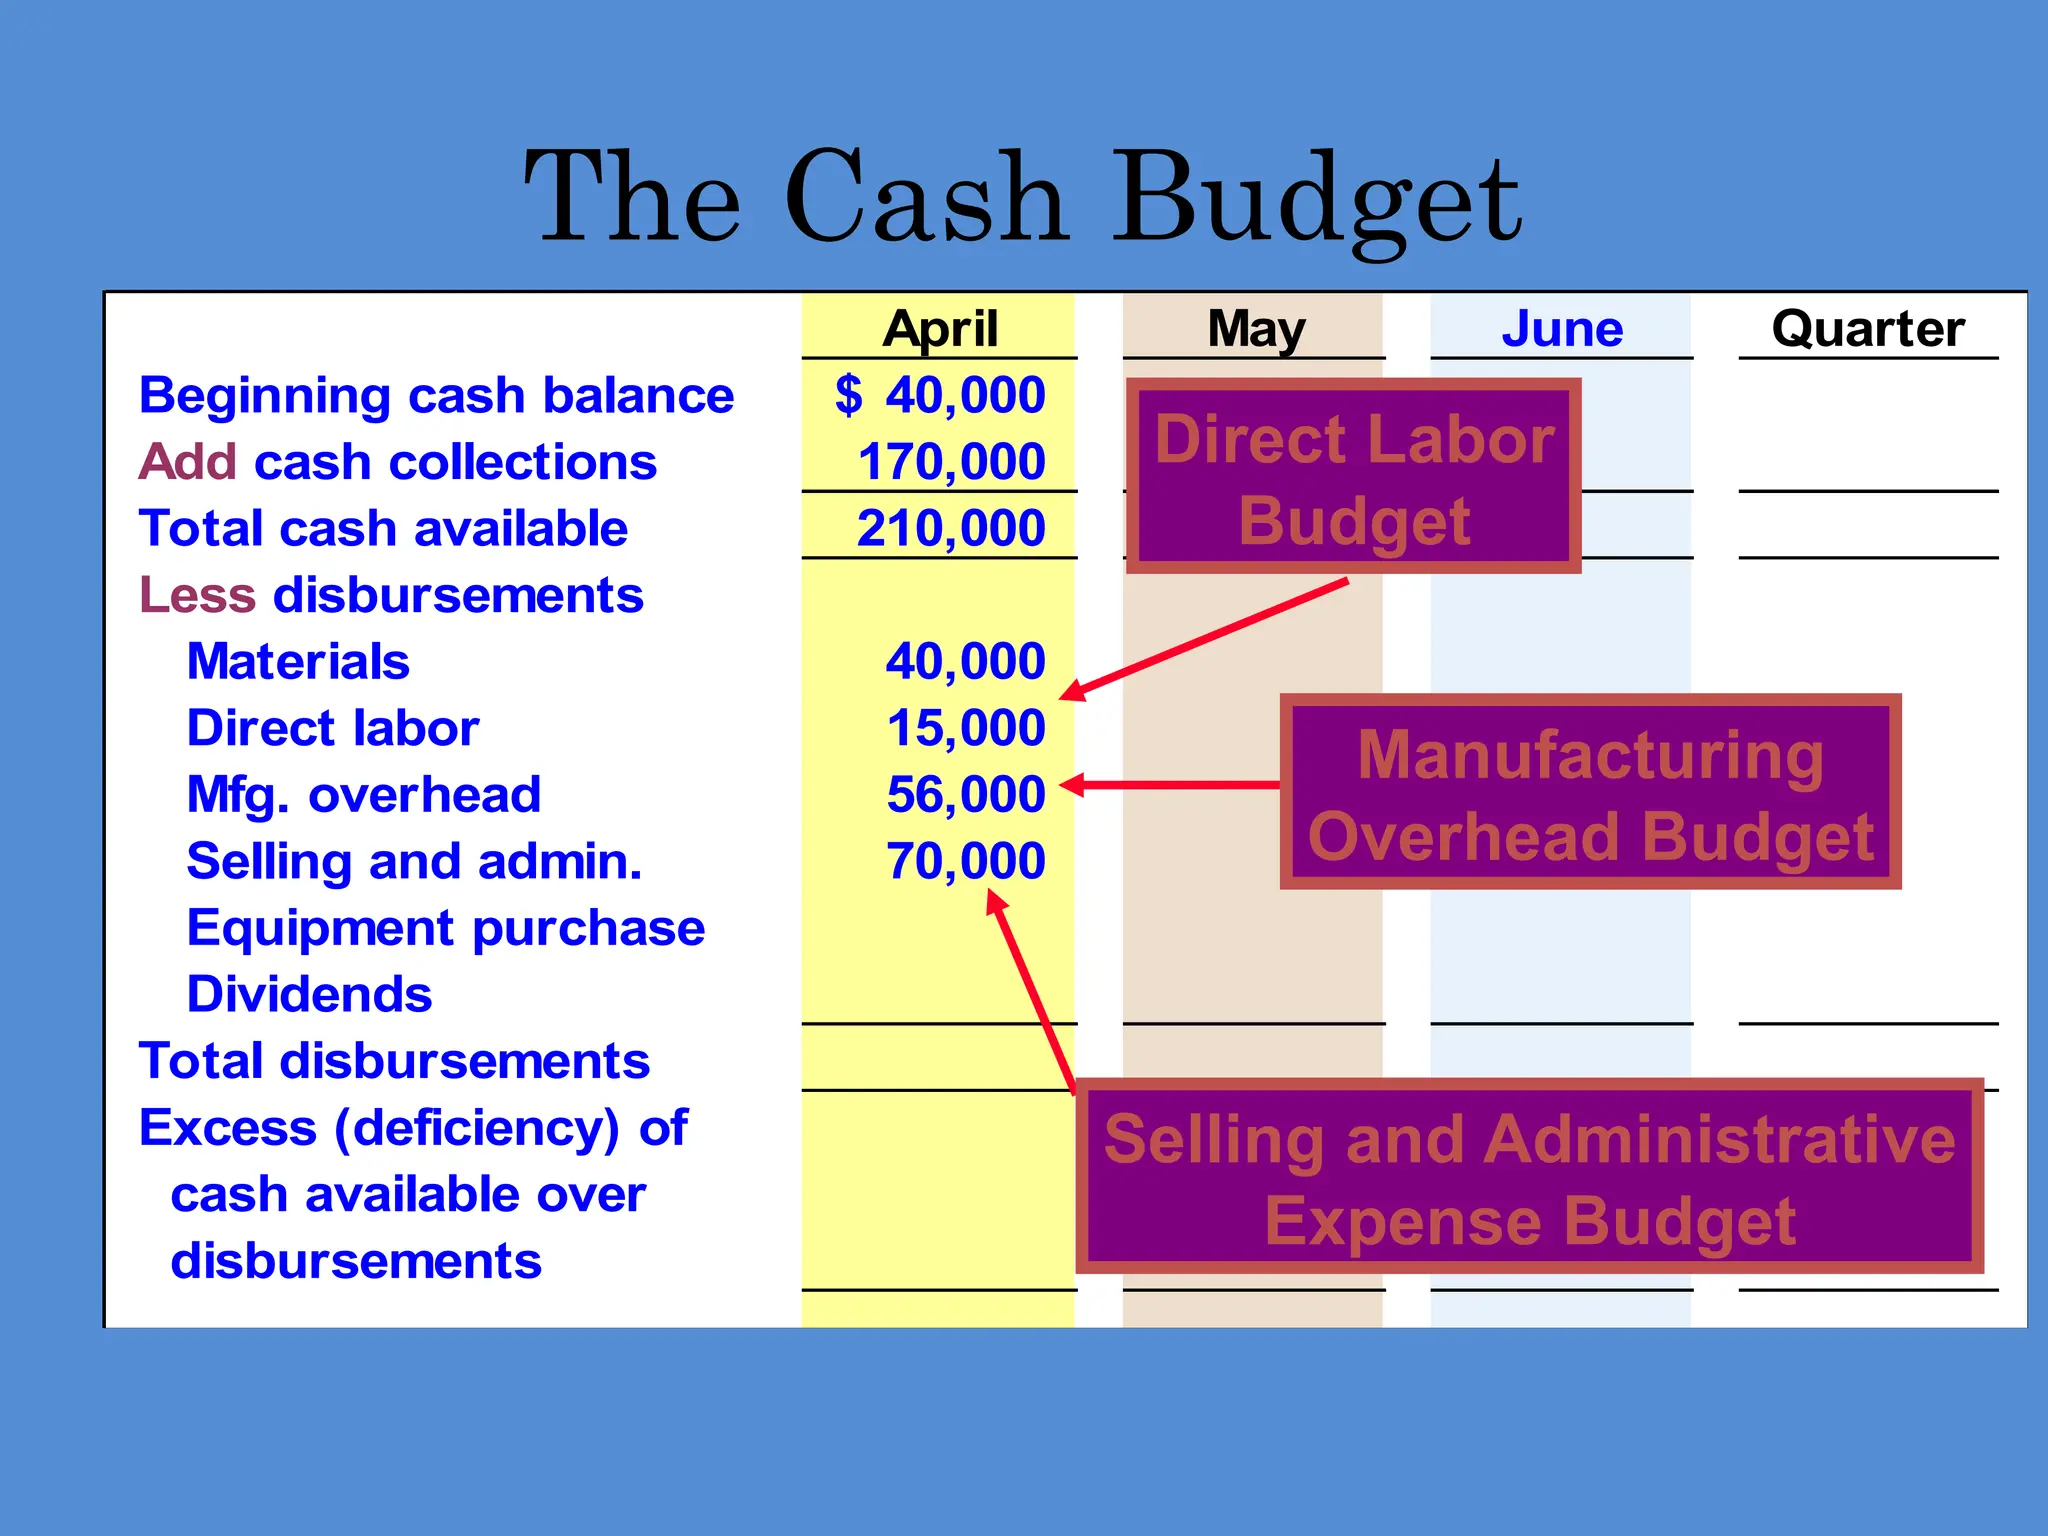
April May JuneQuarter
Beginning cash balance 40,000
$
Add cash collections 170,000
Total cash available 210,000
Less disbursements
Materials 40,000
Direct labor 15,000
Mfg. overhead 56,000
Selling and admin. 70,000
Equipment purchase
Dividends
Total disbursements
Excess (deficiency) of
cash available over
disbursements
The Cash Budget
Direct Labor
Budget
Manufacturing
Overhead Budget
Selling and Administrative
Expense Budget
73.
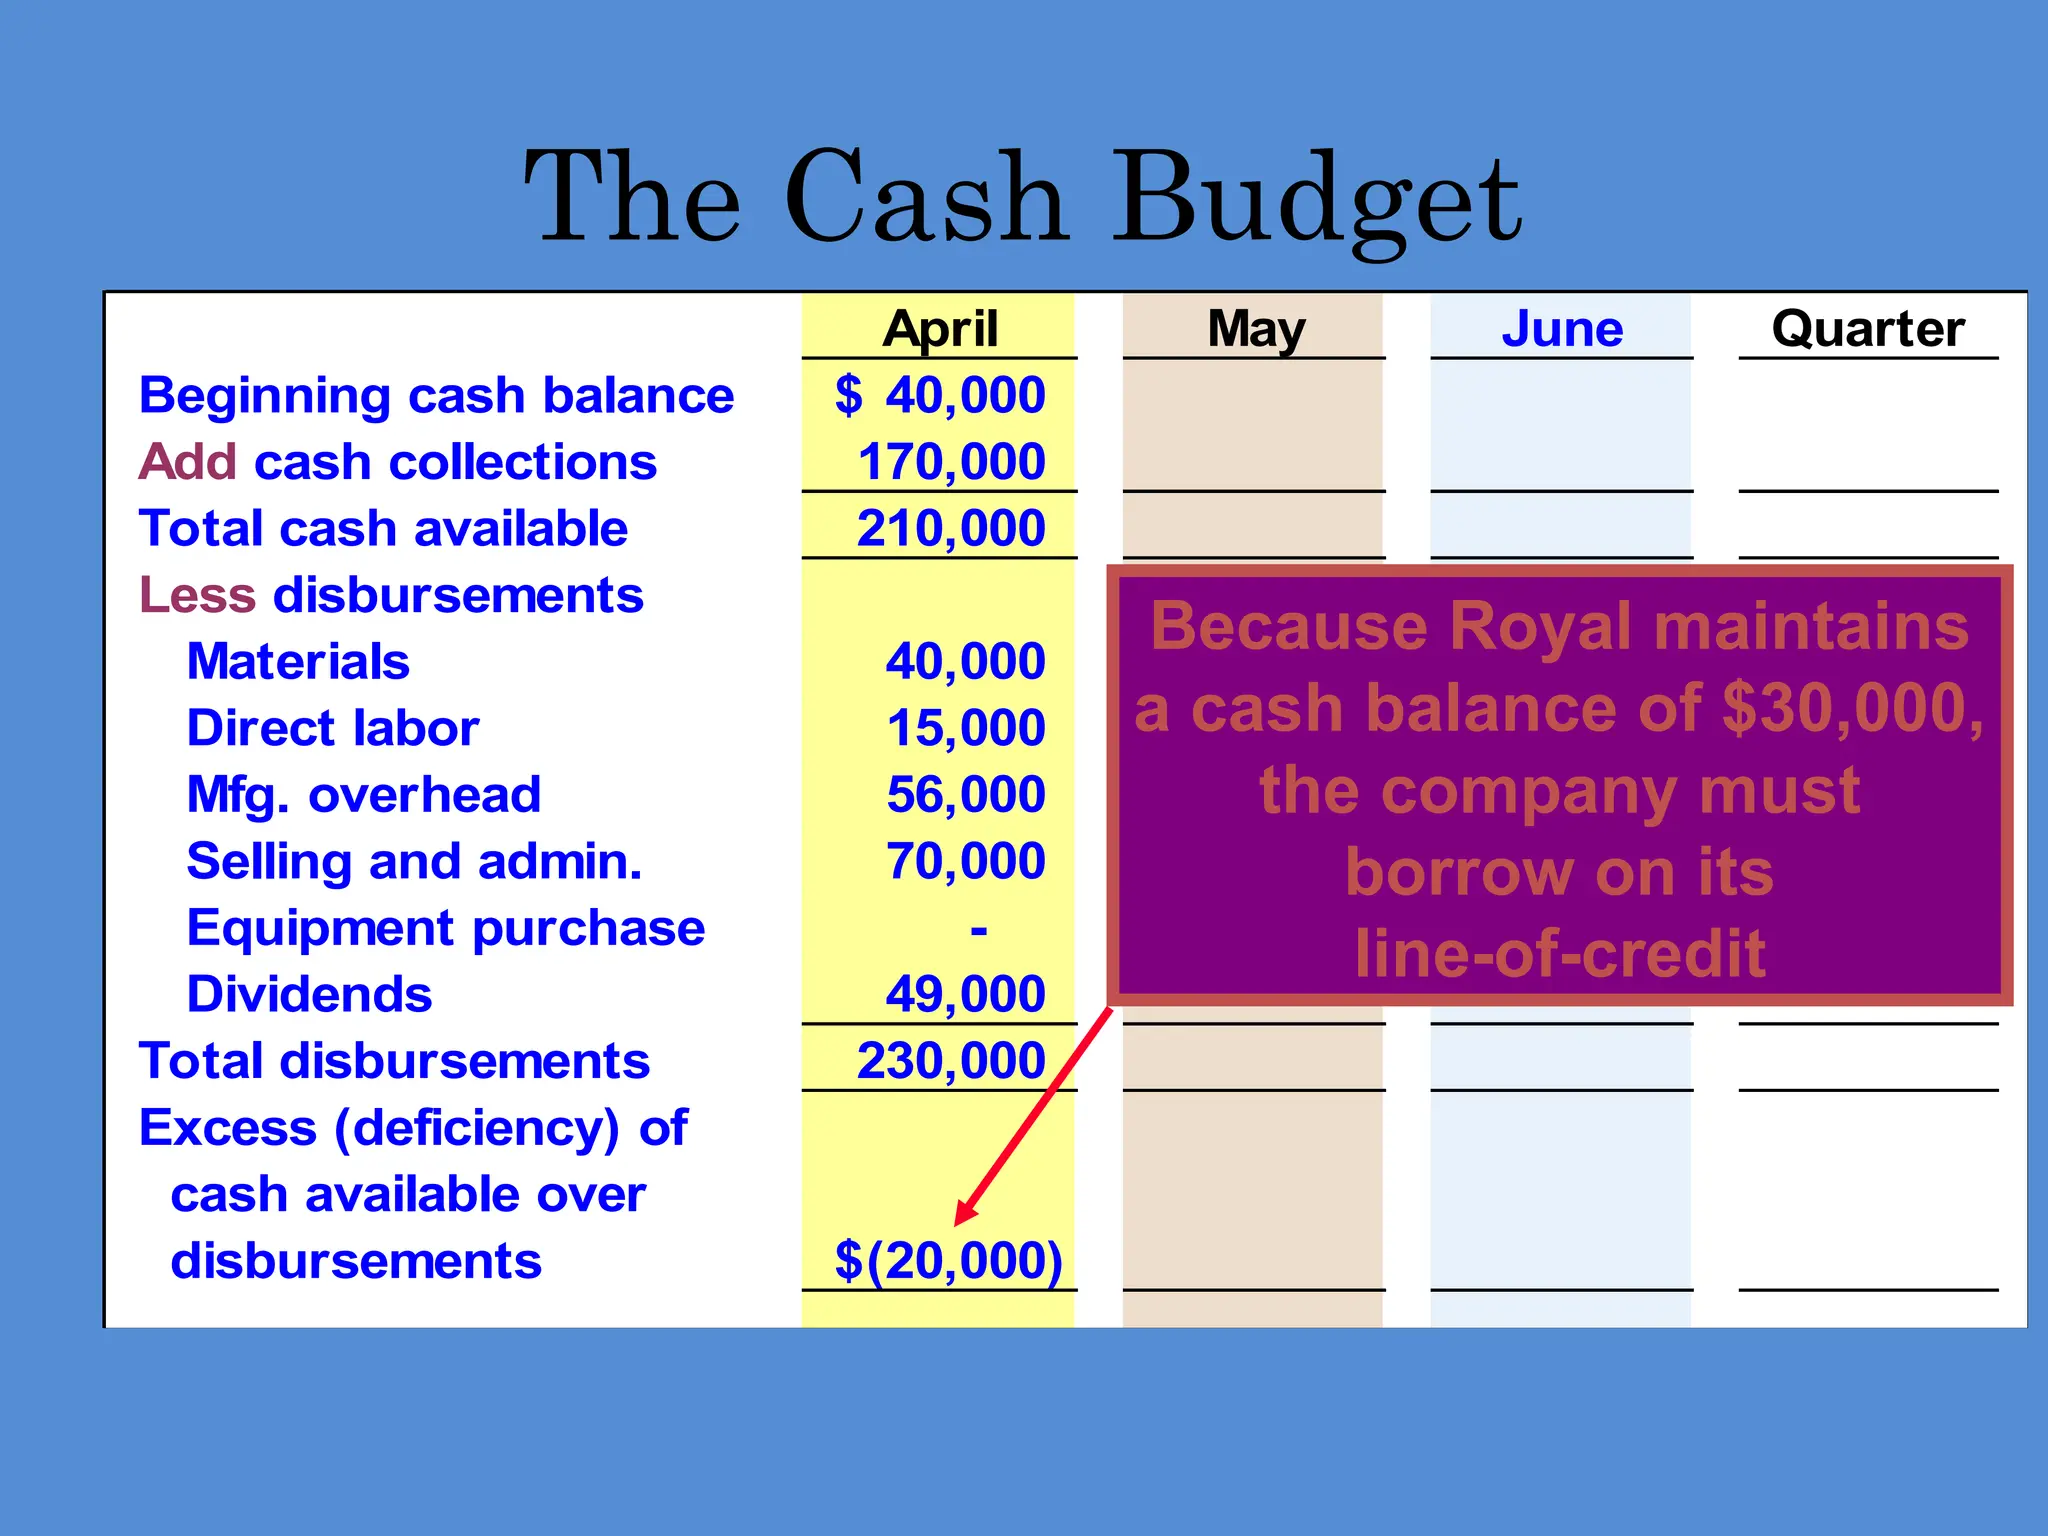
April May JuneQuarter
Beginning cash balance 40,000
$
Add cash collections 170,000
Total cash available 210,000
Less disbursements
Materials 40,000
Direct labor 15,000
Mfg. overhead 56,000
Selling and admin. 70,000
Equipment purchase -
Dividends 49,000
Total disbursements 230,000
Excess (deficiency) of
cash available over
disbursements (20,000)
$
The Cash Budget
Because Royal maintains
a cash balance of $30,000,
the company must
borrow on its
line-of-credit
74.
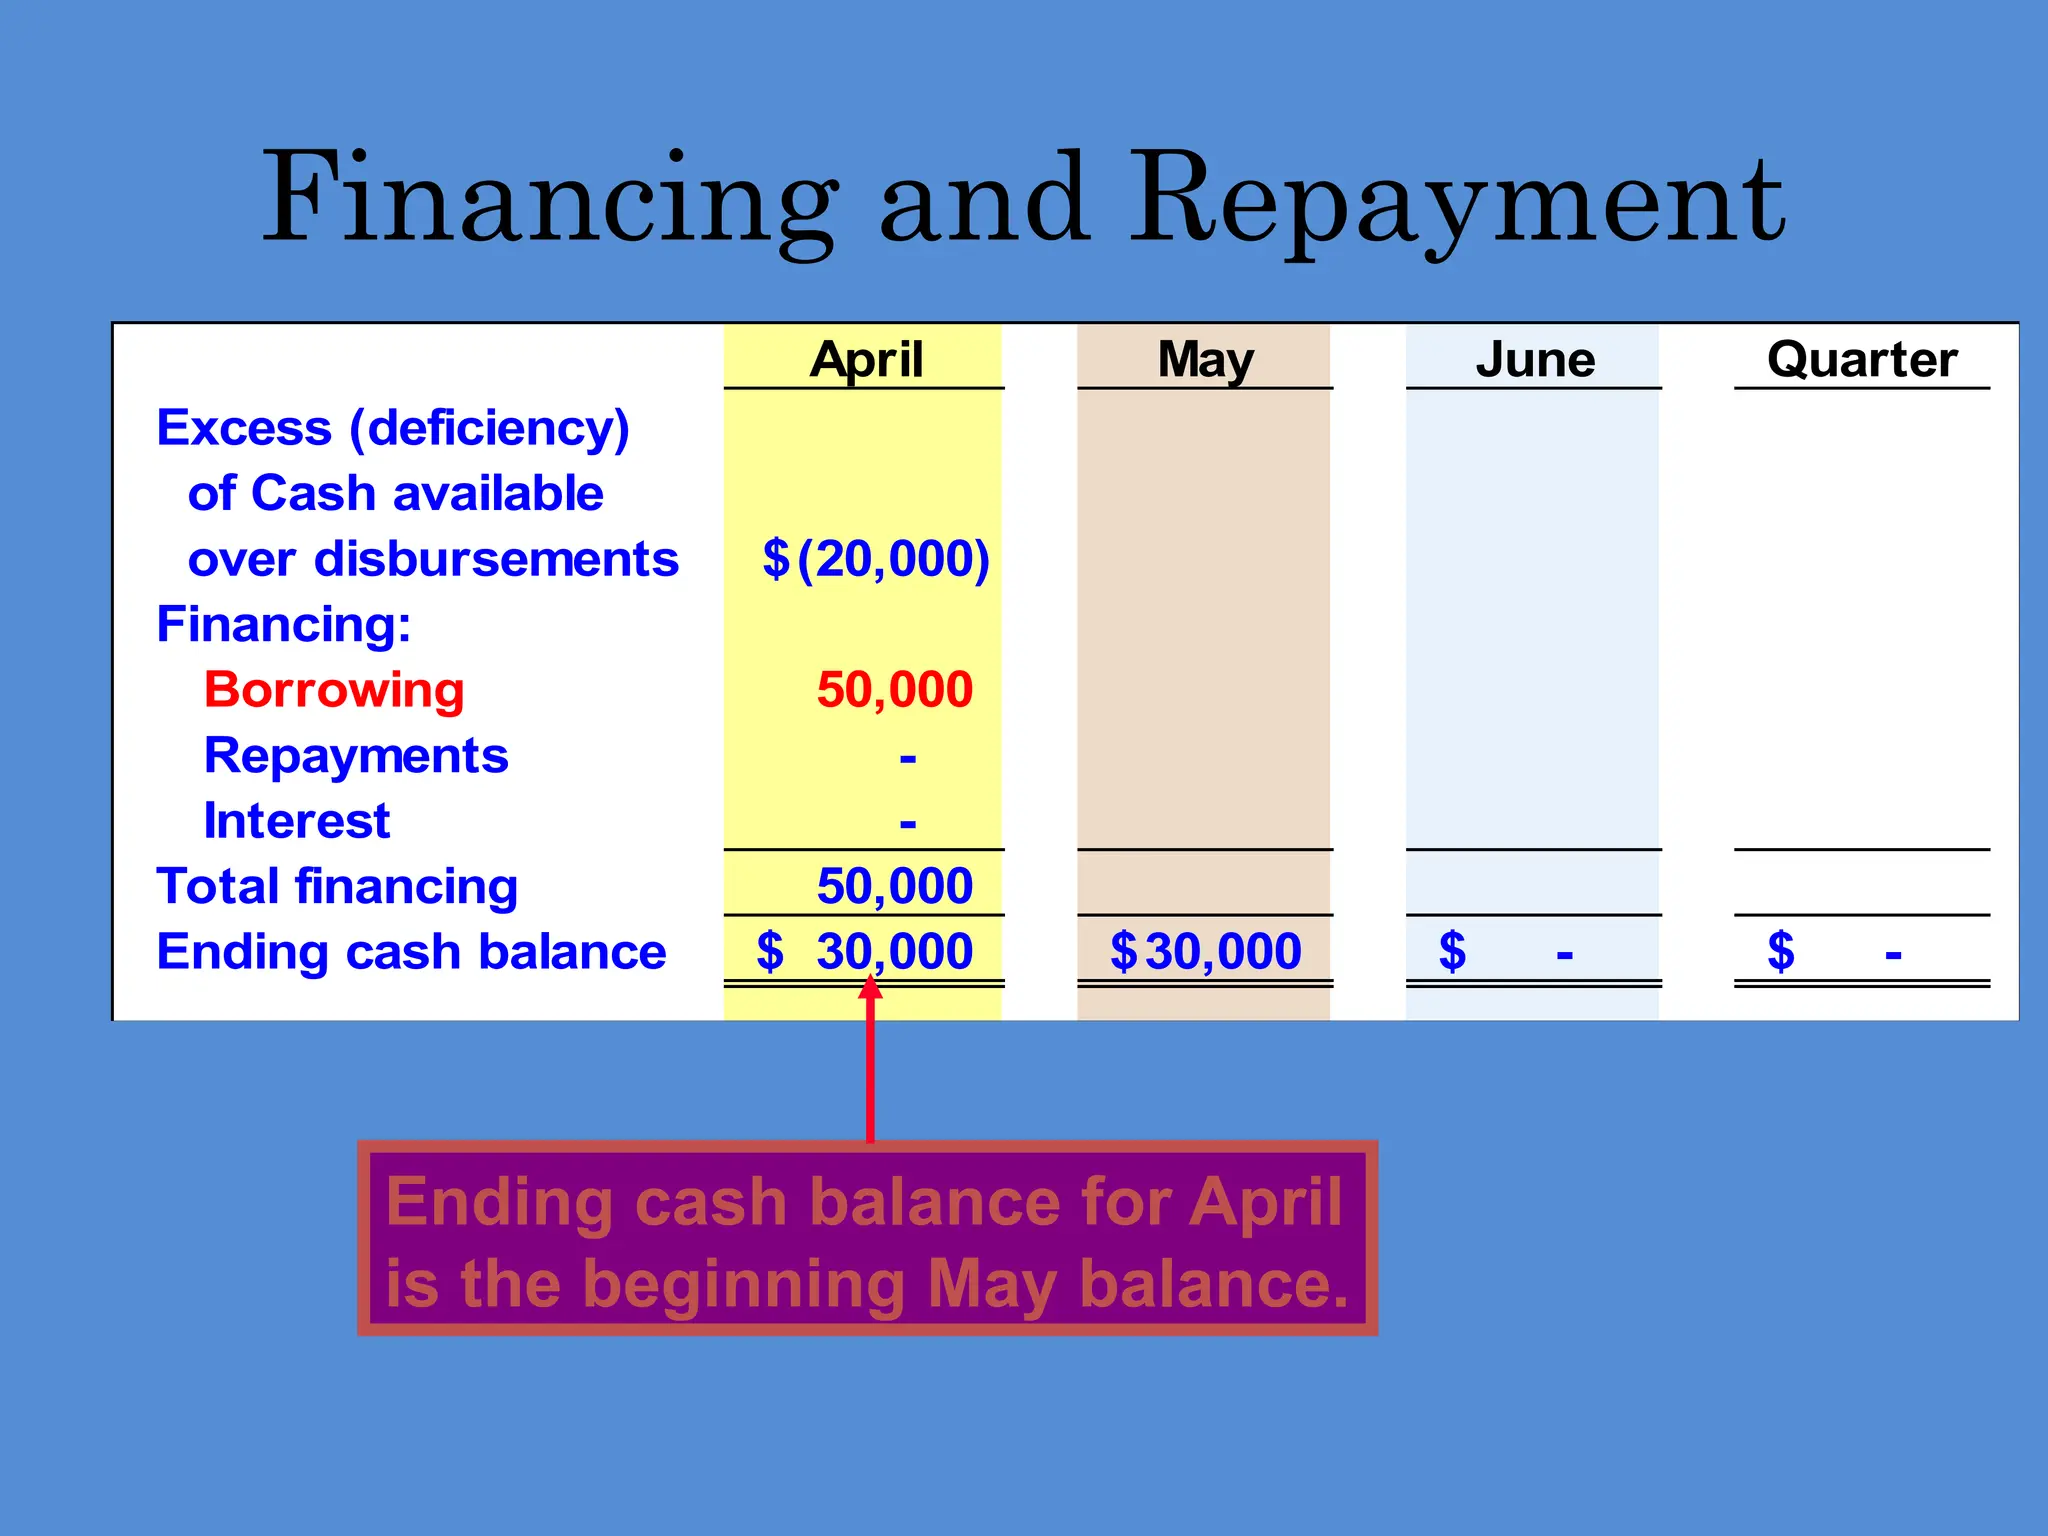
April May JuneQuarter
Excess (deficiency)
of Cash available
over disbursements (20,000)
$
Financing:
Borrowing 50,000
Repayments -
Interest -
Total financing 50,000
Ending cash balance 30,000
$ 30,000
$ -
$ -
$
Financing and Repayment
Ending cash balance for April
is the beginning May balance.
75.
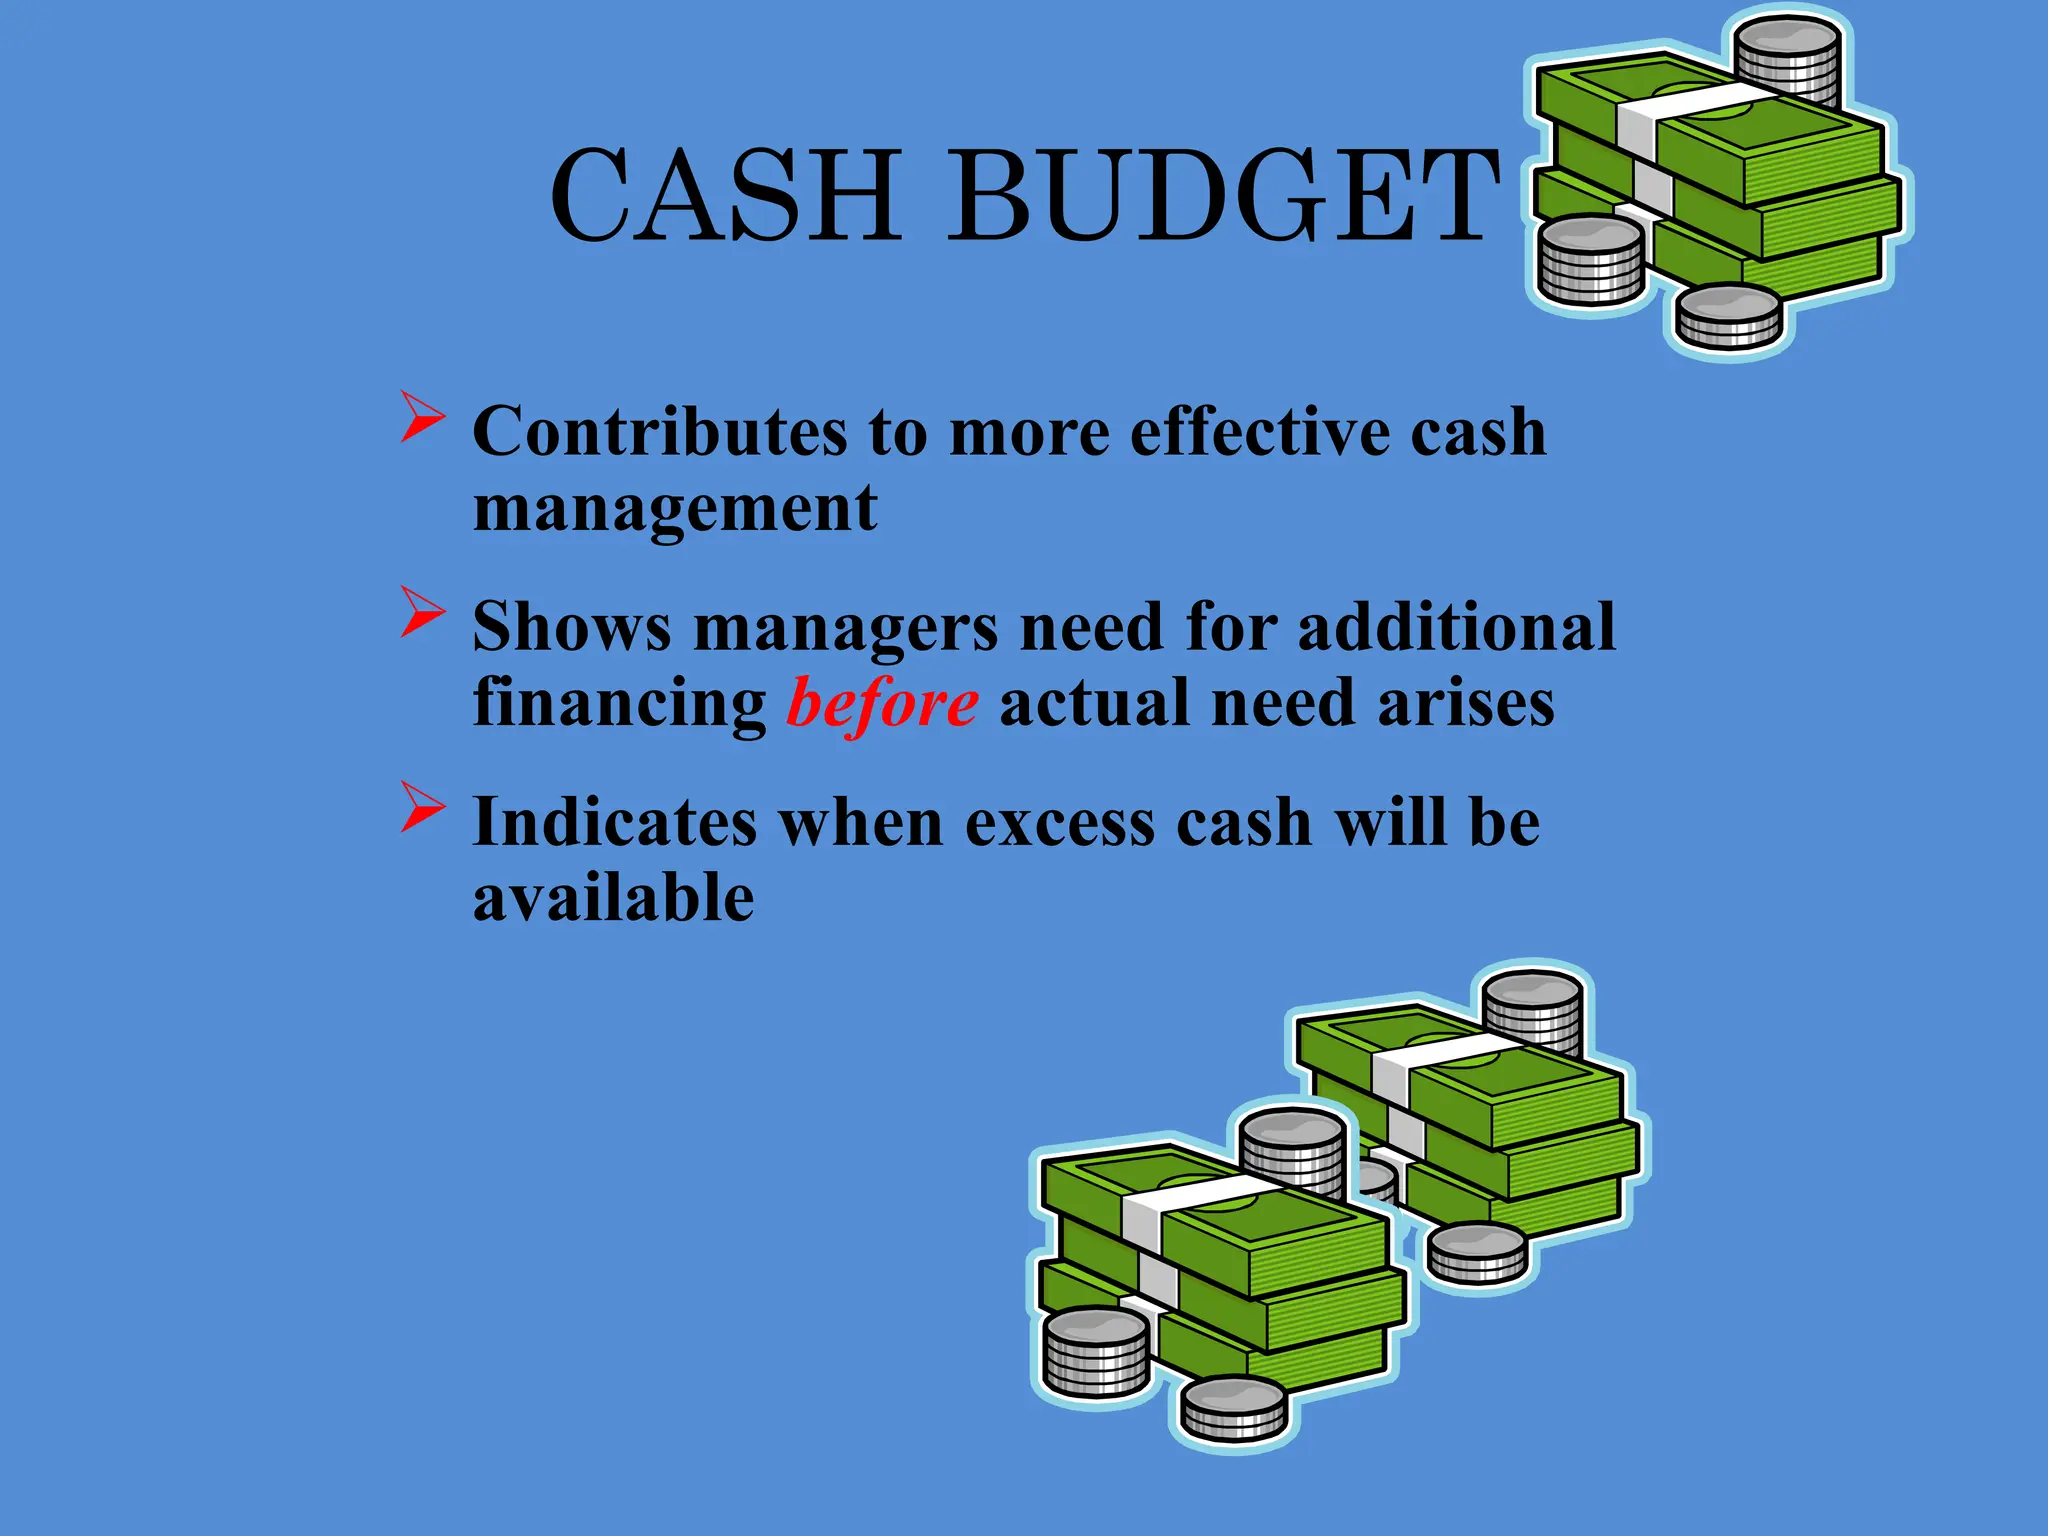
CASH BUDGET
Contributesto more effective cash
management
Shows managers need for additional
financing before actual need arises
Indicates when excess cash will be
available
76.
The Cash Budget
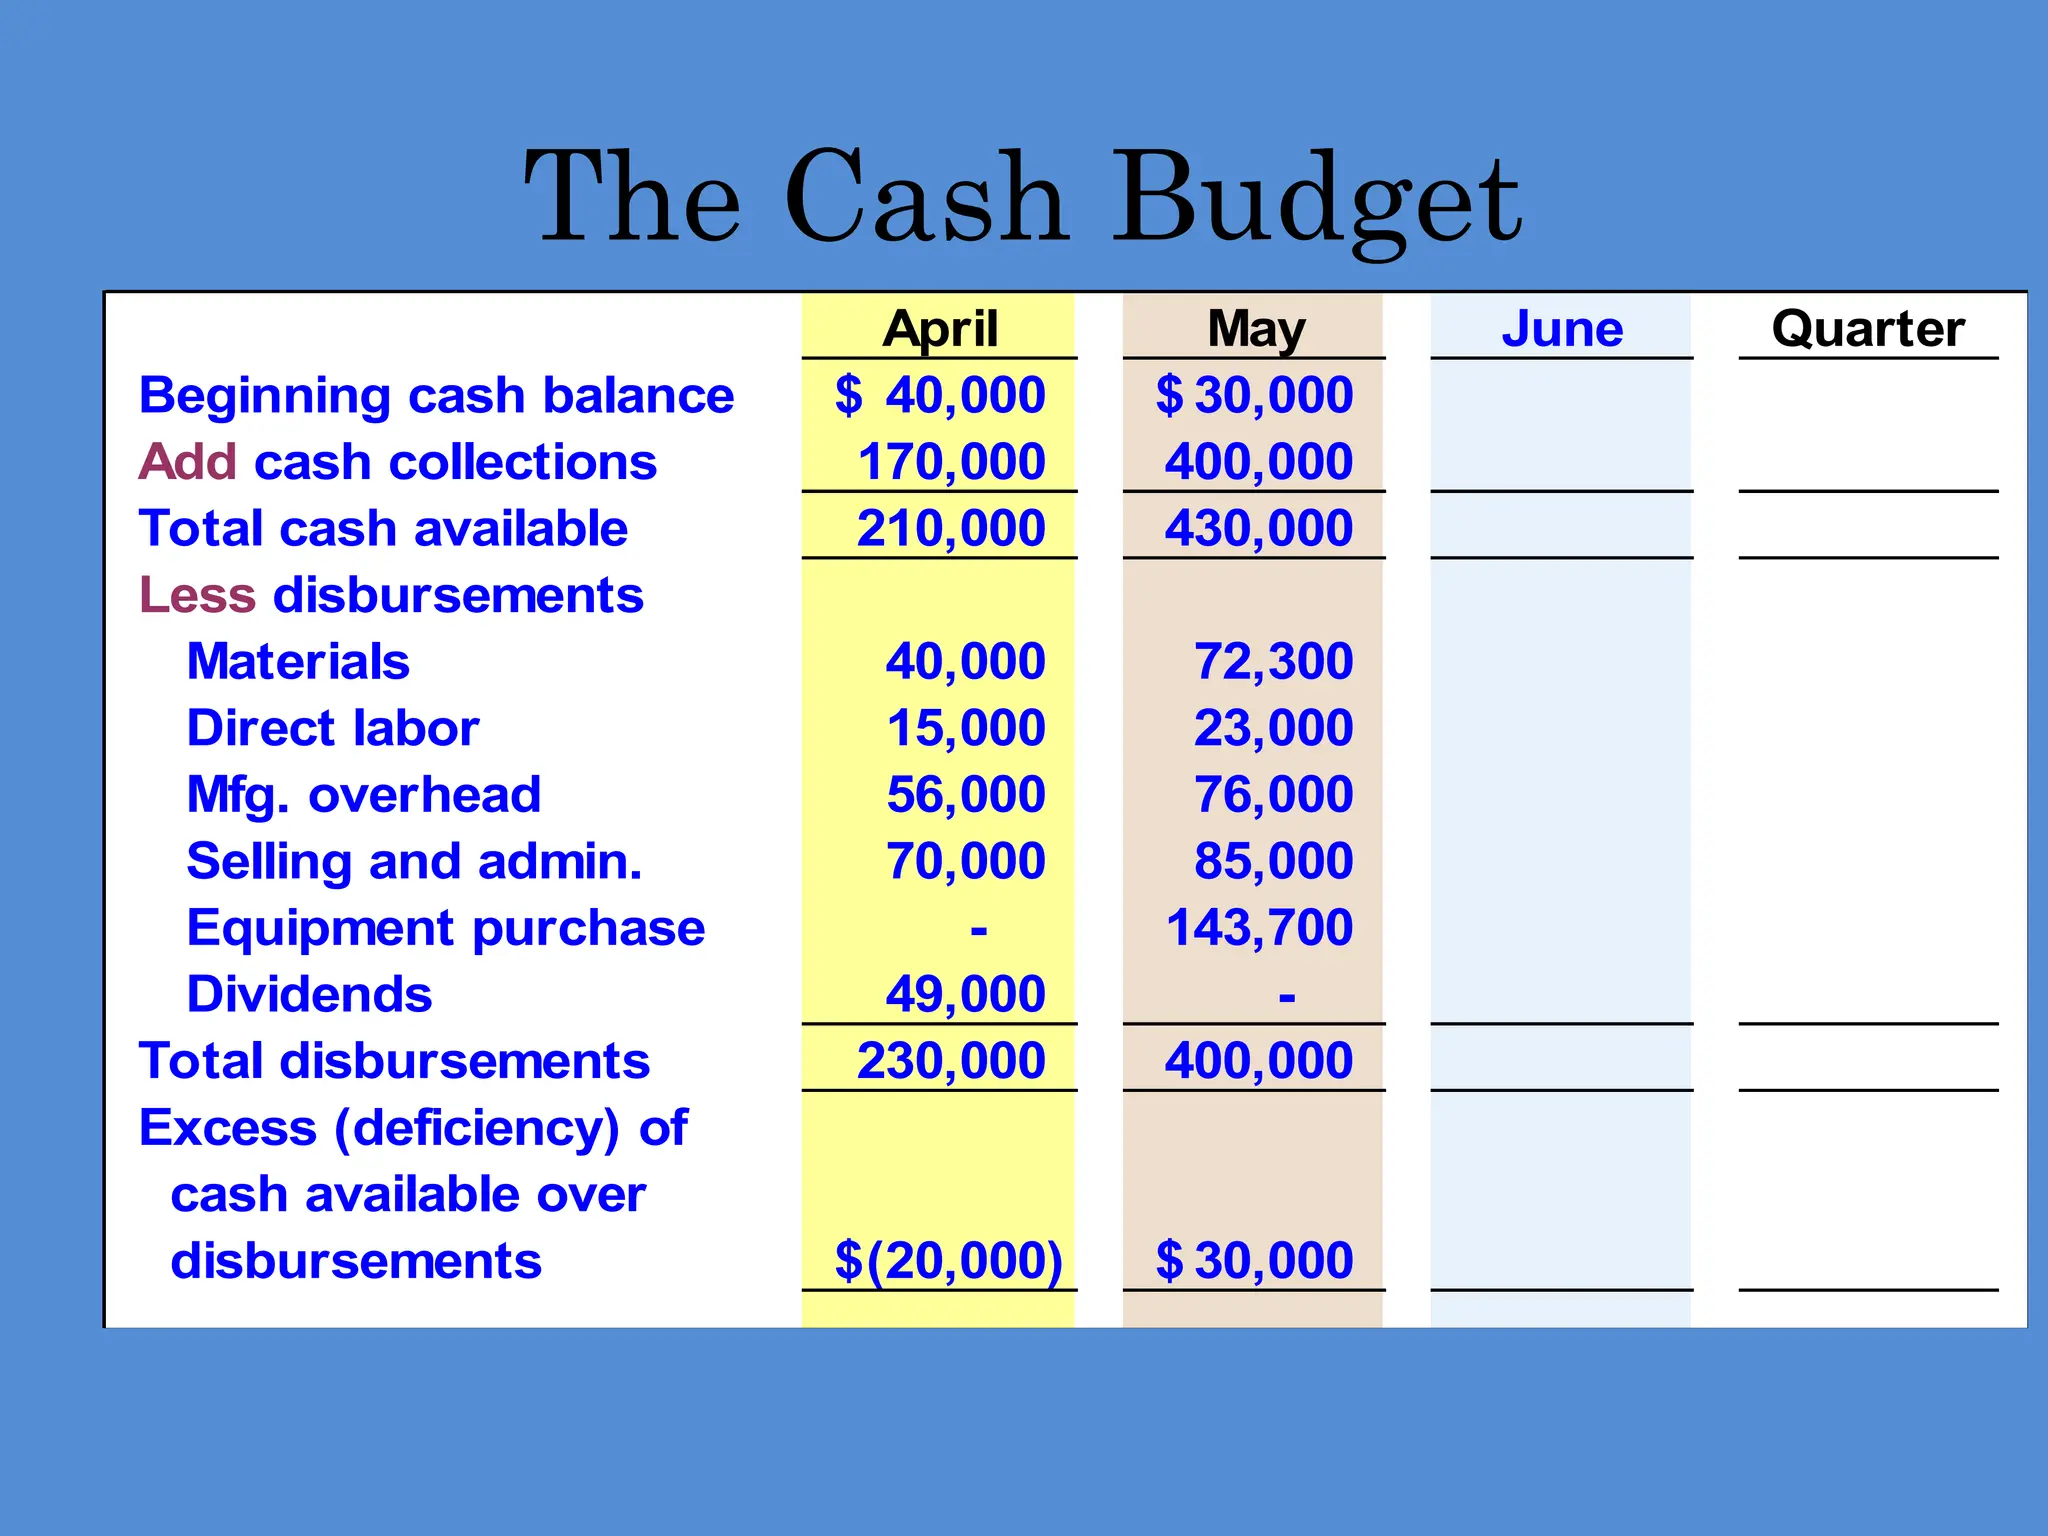
AprilMay June Quarter
Beginning cash balance 40,000
$ 30,000
$
Add cash collections 170,000 400,000
Total cash available 210,000 430,000
Less disbursements
Materials 40,000 72,300
Direct labor 15,000 23,000
Mfg. overhead 56,000 76,000
Selling and admin. 70,000 85,000
Equipment purchase - 143,700
Dividends 49,000 -
Total disbursements 230,000 400,000
Excess (deficiency) of
cash available over
disbursements (20,000)
$ 30,000
$
77.
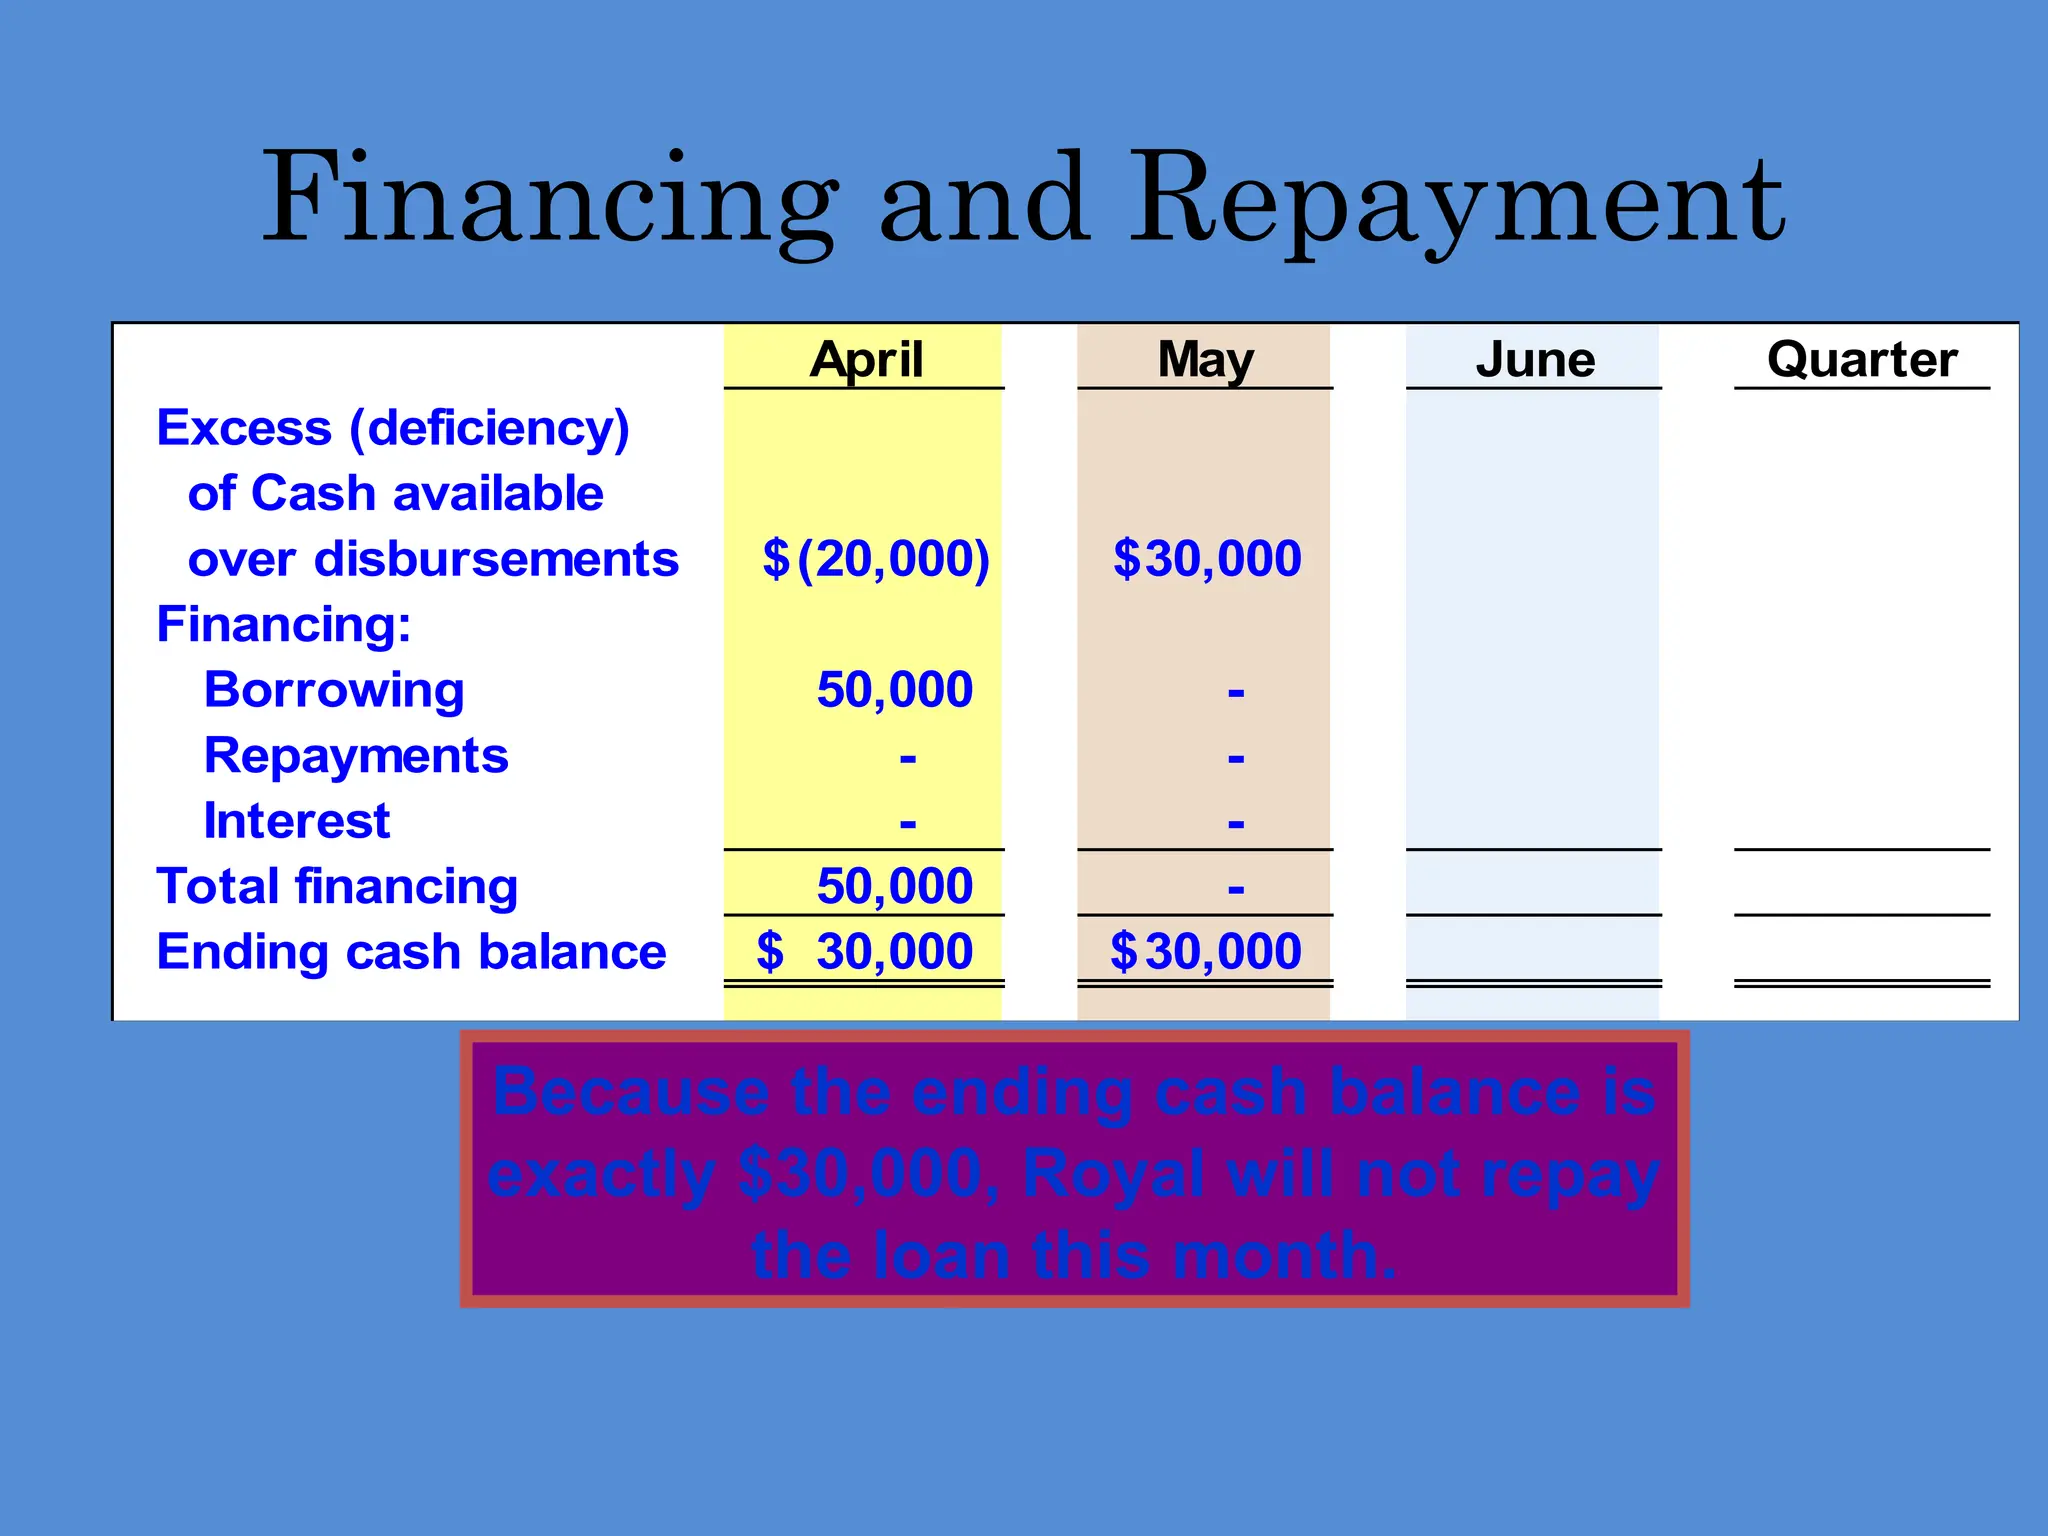
Financing and Repayment
Becausethe ending cash balance is
exactly $30,000, Royal will not repay
the loan this month.
April May June Quarter
Excess (deficiency)
of Cash available
over disbursements (20,000)
$ 30,000
$
Financing:
Borrowing 50,000 -
Repayments - -
Interest - -
Total financing 50,000 -
Ending cash balance 30,000
$ 30,000
$
78.
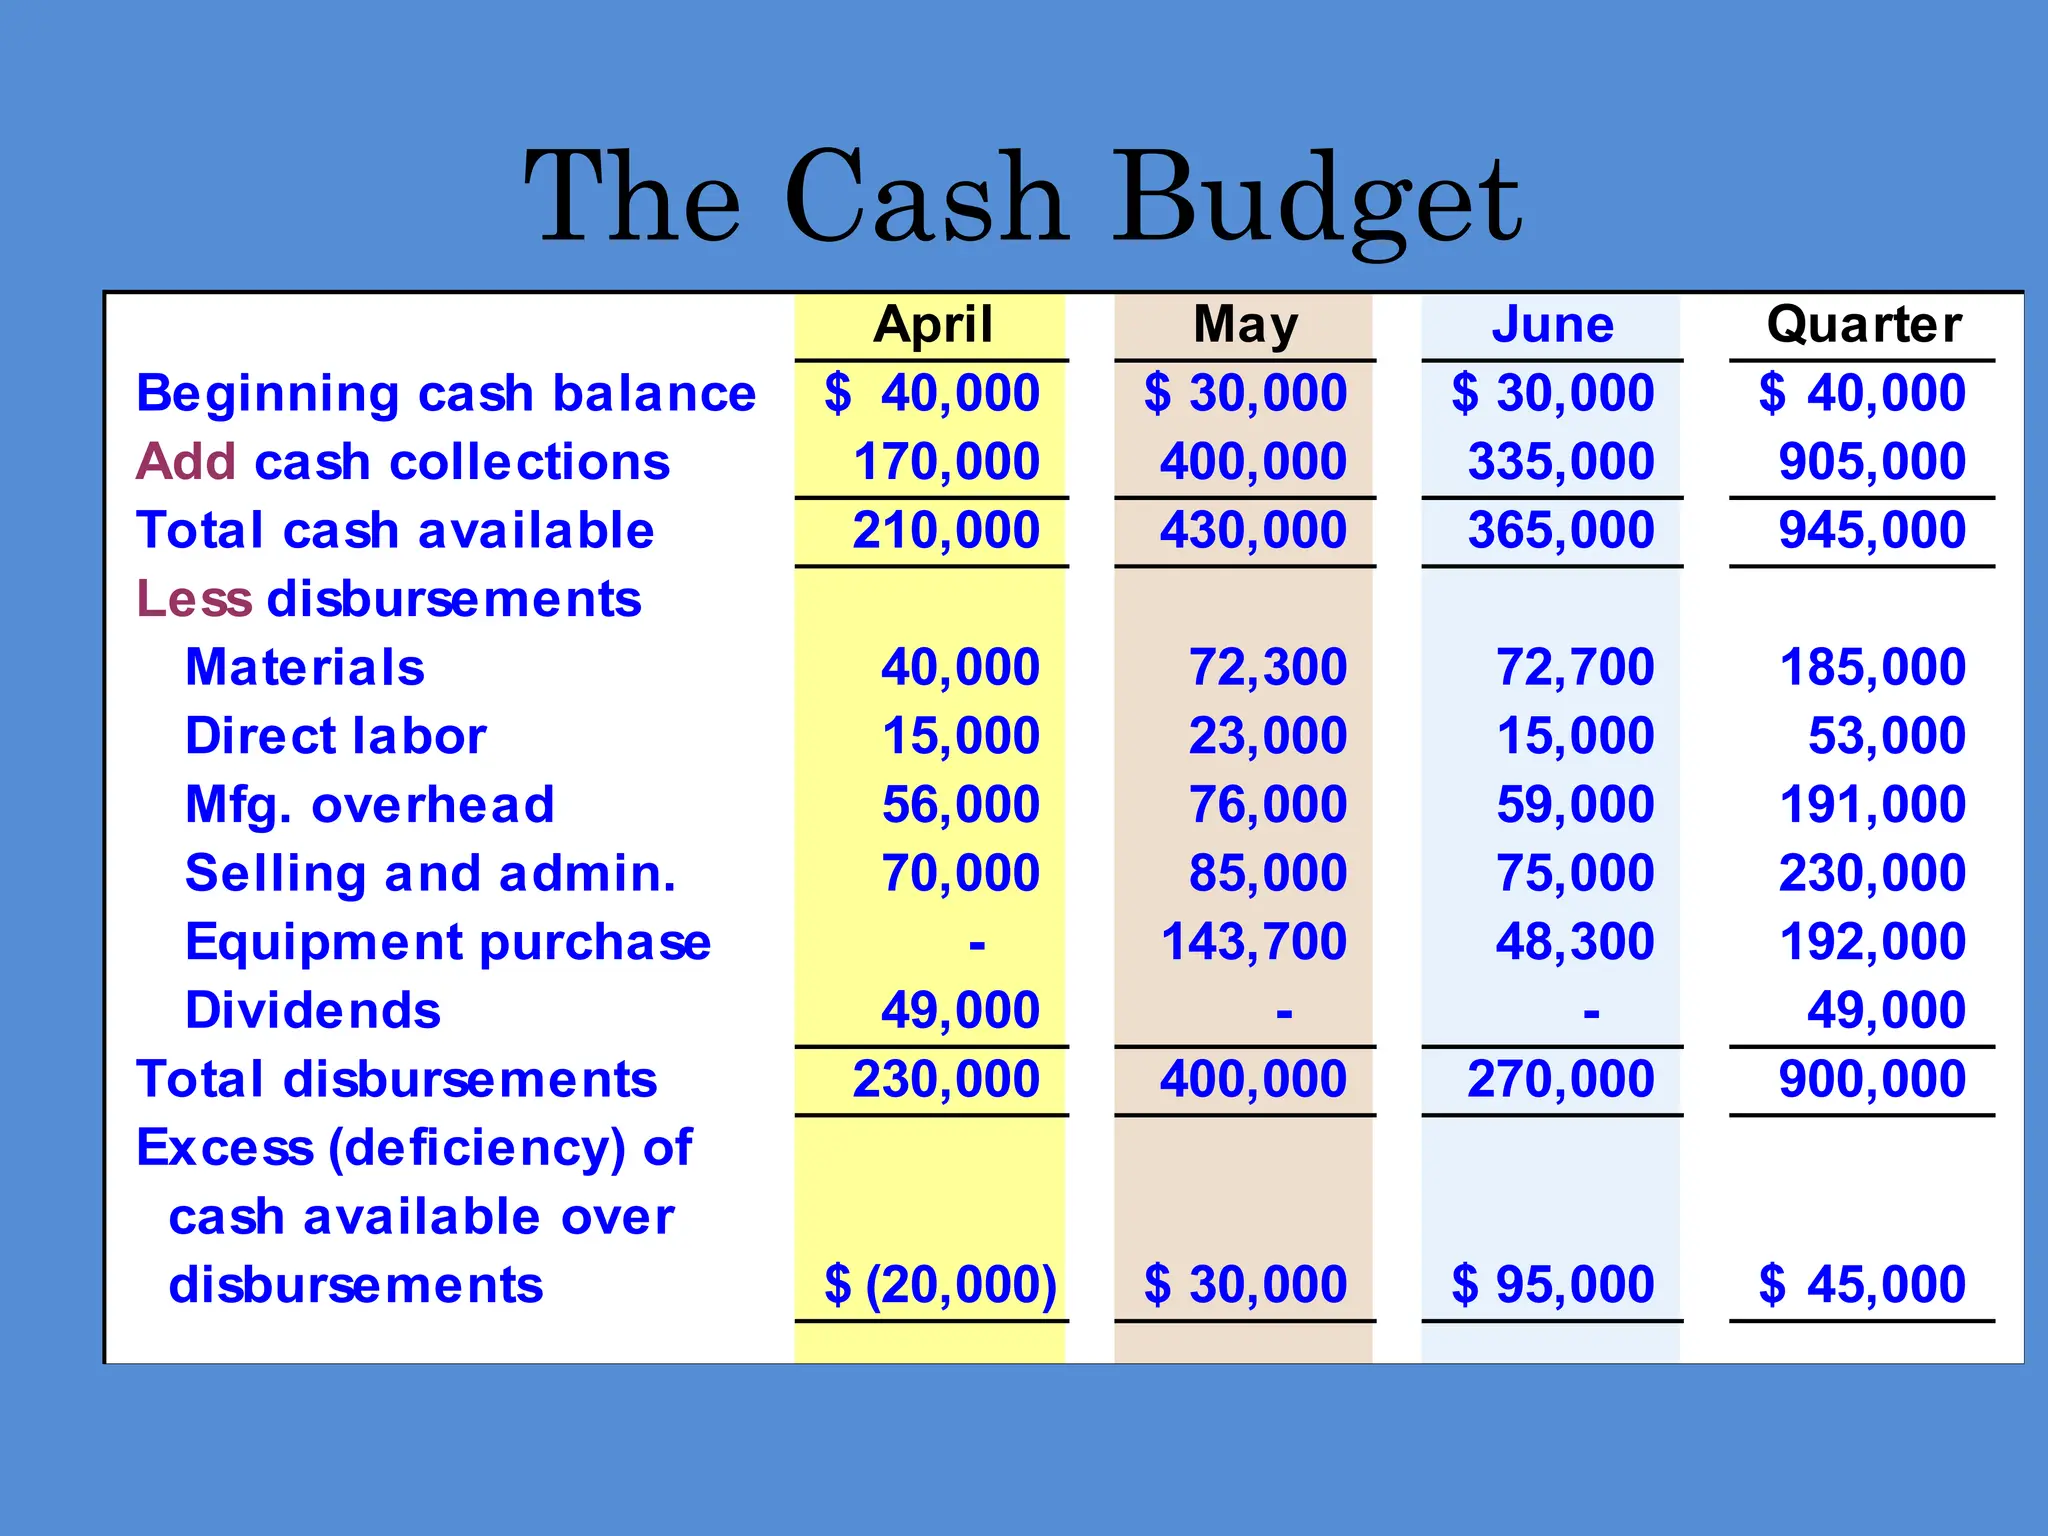
April May JuneQuarter
Beginning cash balance 40,000
$ 30,000
$ 30,000
$ 40,000
$
Add cash collections 170,000 400,000 335,000 905,000
Total cash available 210,000 430,000 365,000 945,000
Less disbursements
Materials 40,000 72,300 72,700 185,000
Direct labor 15,000 23,000 15,000 53,000
Mfg. overhead 56,000 76,000 59,000 191,000
Selling and admin. 70,000 85,000 75,000 230,000
Equipment purchase - 143,700 48,300 192,000
Dividends 49,000 - - 49,000
Total disbursements 230,000 400,000 270,000 900,000
Excess (deficiency) of
cash available over
disbursements (20,000)
$ 30,000
$ 95,000
$ 45,000
$
The Cash Budget
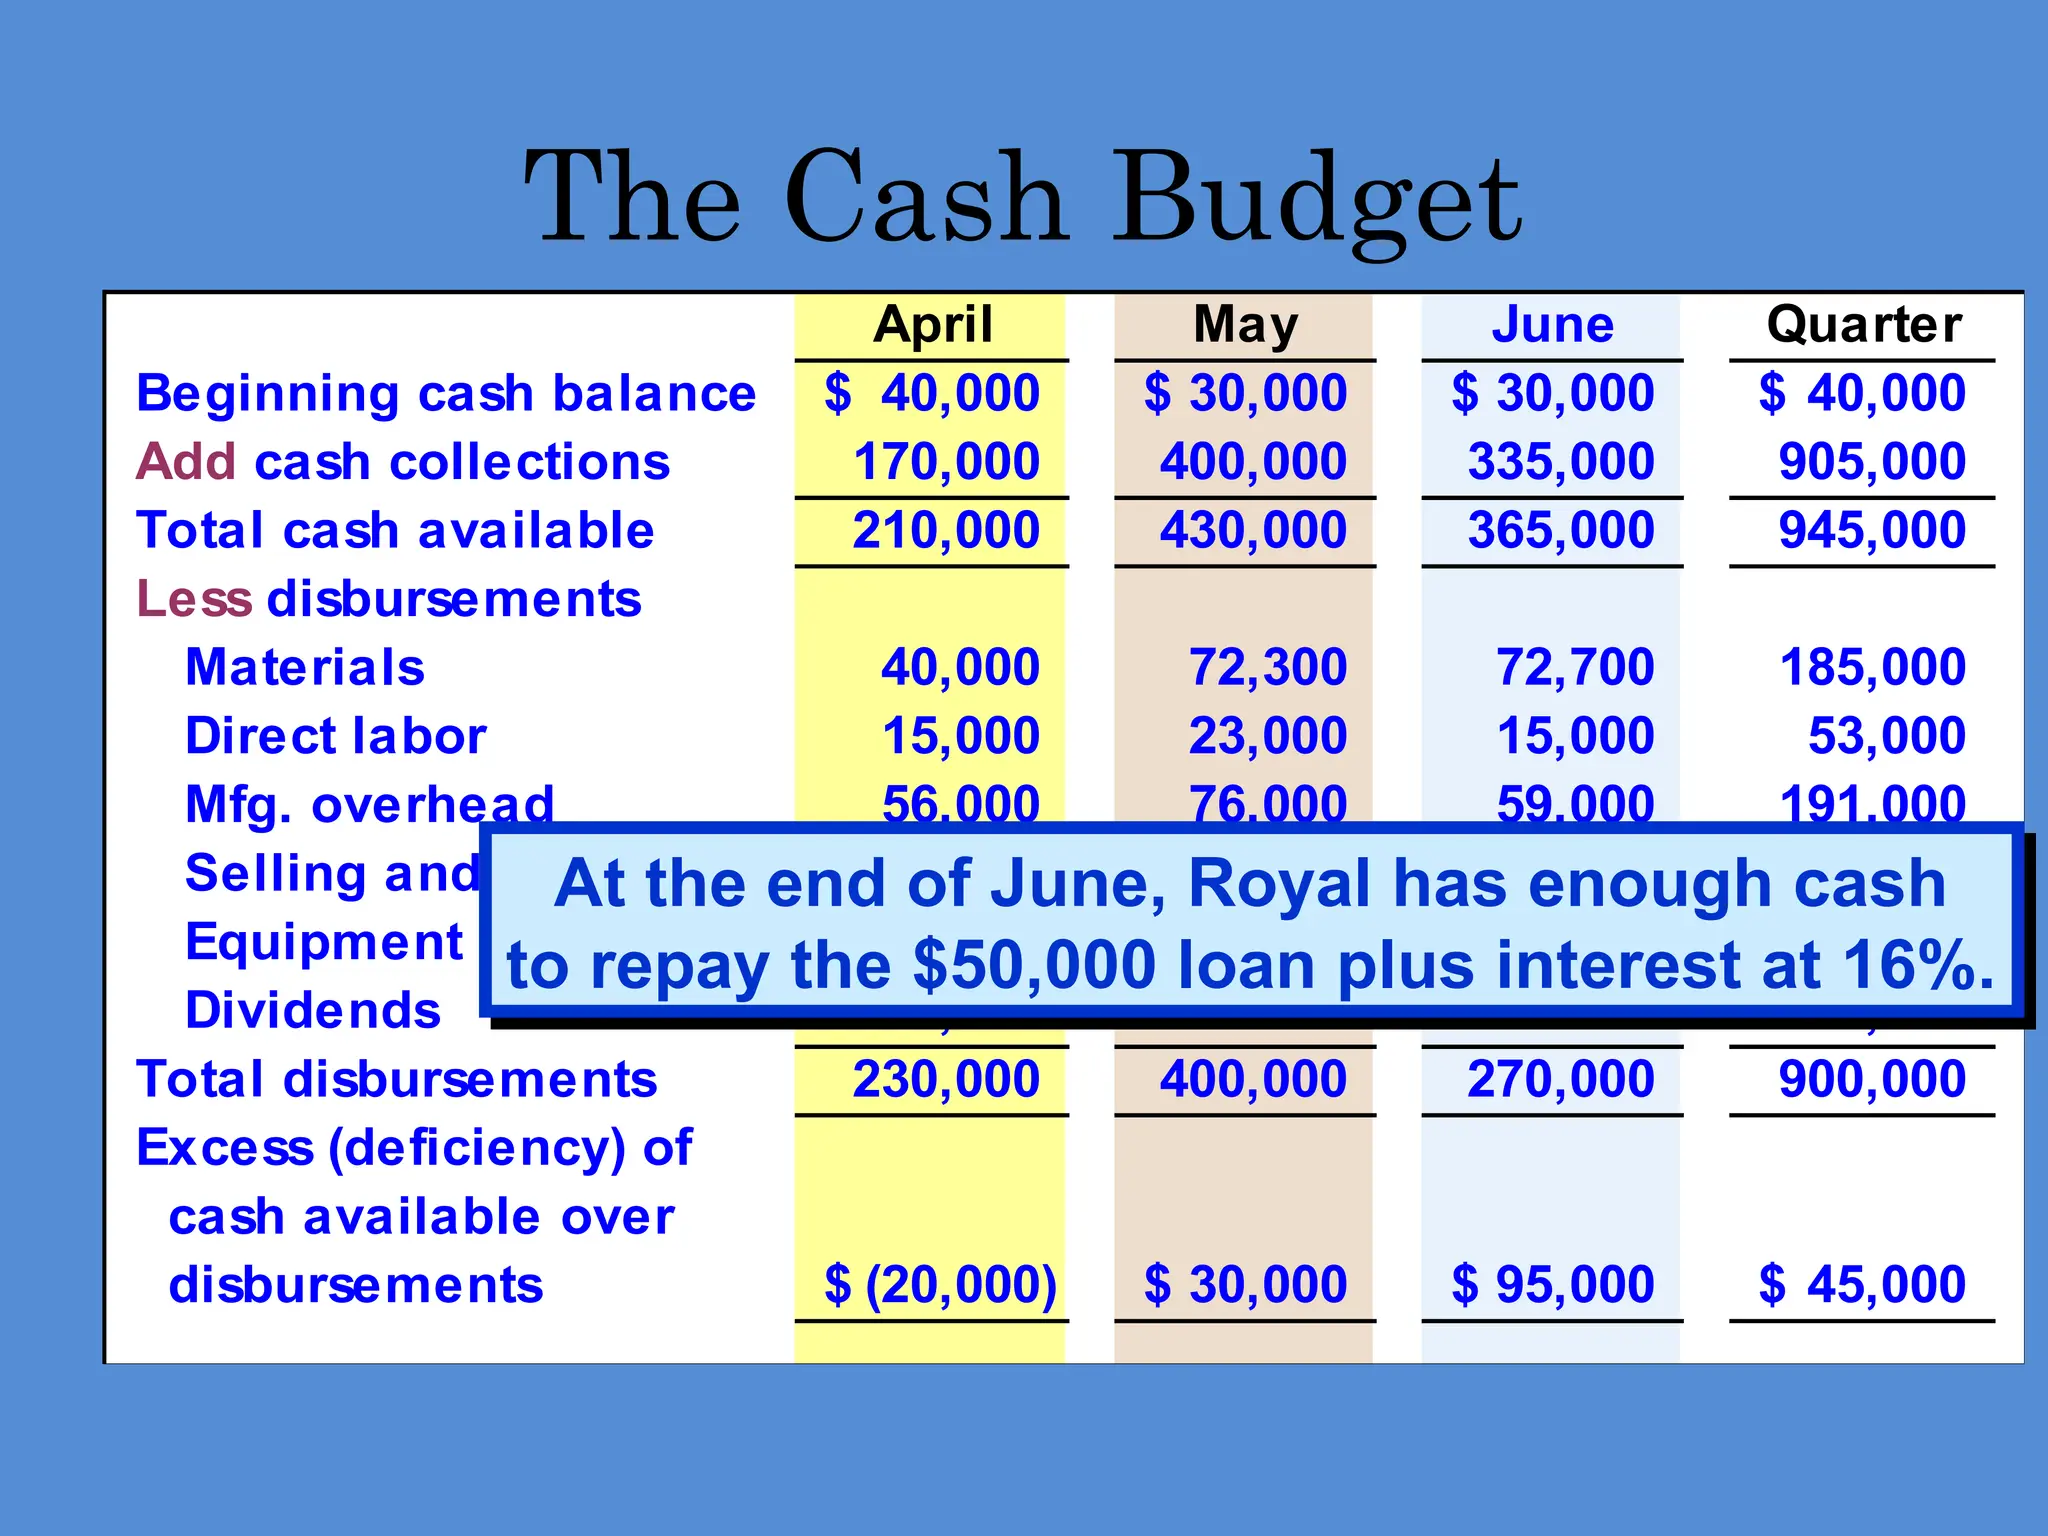
79.
April May JuneQuarter
Beginning cash balance 40,000
$ 30,000
$ 30,000
$ 40,000
$
Add cash collections 170,000 400,000 335,000 905,000
Total cash available 210,000 430,000 365,000 945,000
Less disbursements
Materials 40,000 72,300 72,700 185,000
Direct labor 15,000 23,000 15,000 53,000
Mfg. overhead 56,000 76,000 59,000 191,000
Selling and admin. 70,000 85,000 75,000 230,000
Equipment purchase - 143,700 48,300 192,000
Dividends 49,000 - - 49,000
Total disbursements 230,000 400,000 270,000 900,000
Excess (deficiency) of
cash available over
disbursements (20,000)
$ 30,000
$ 95,000
$ 45,000
$
The Cash Budget
At the end of June, Royal has enough cash
to repay the $50,000 loan plus interest at 16%.
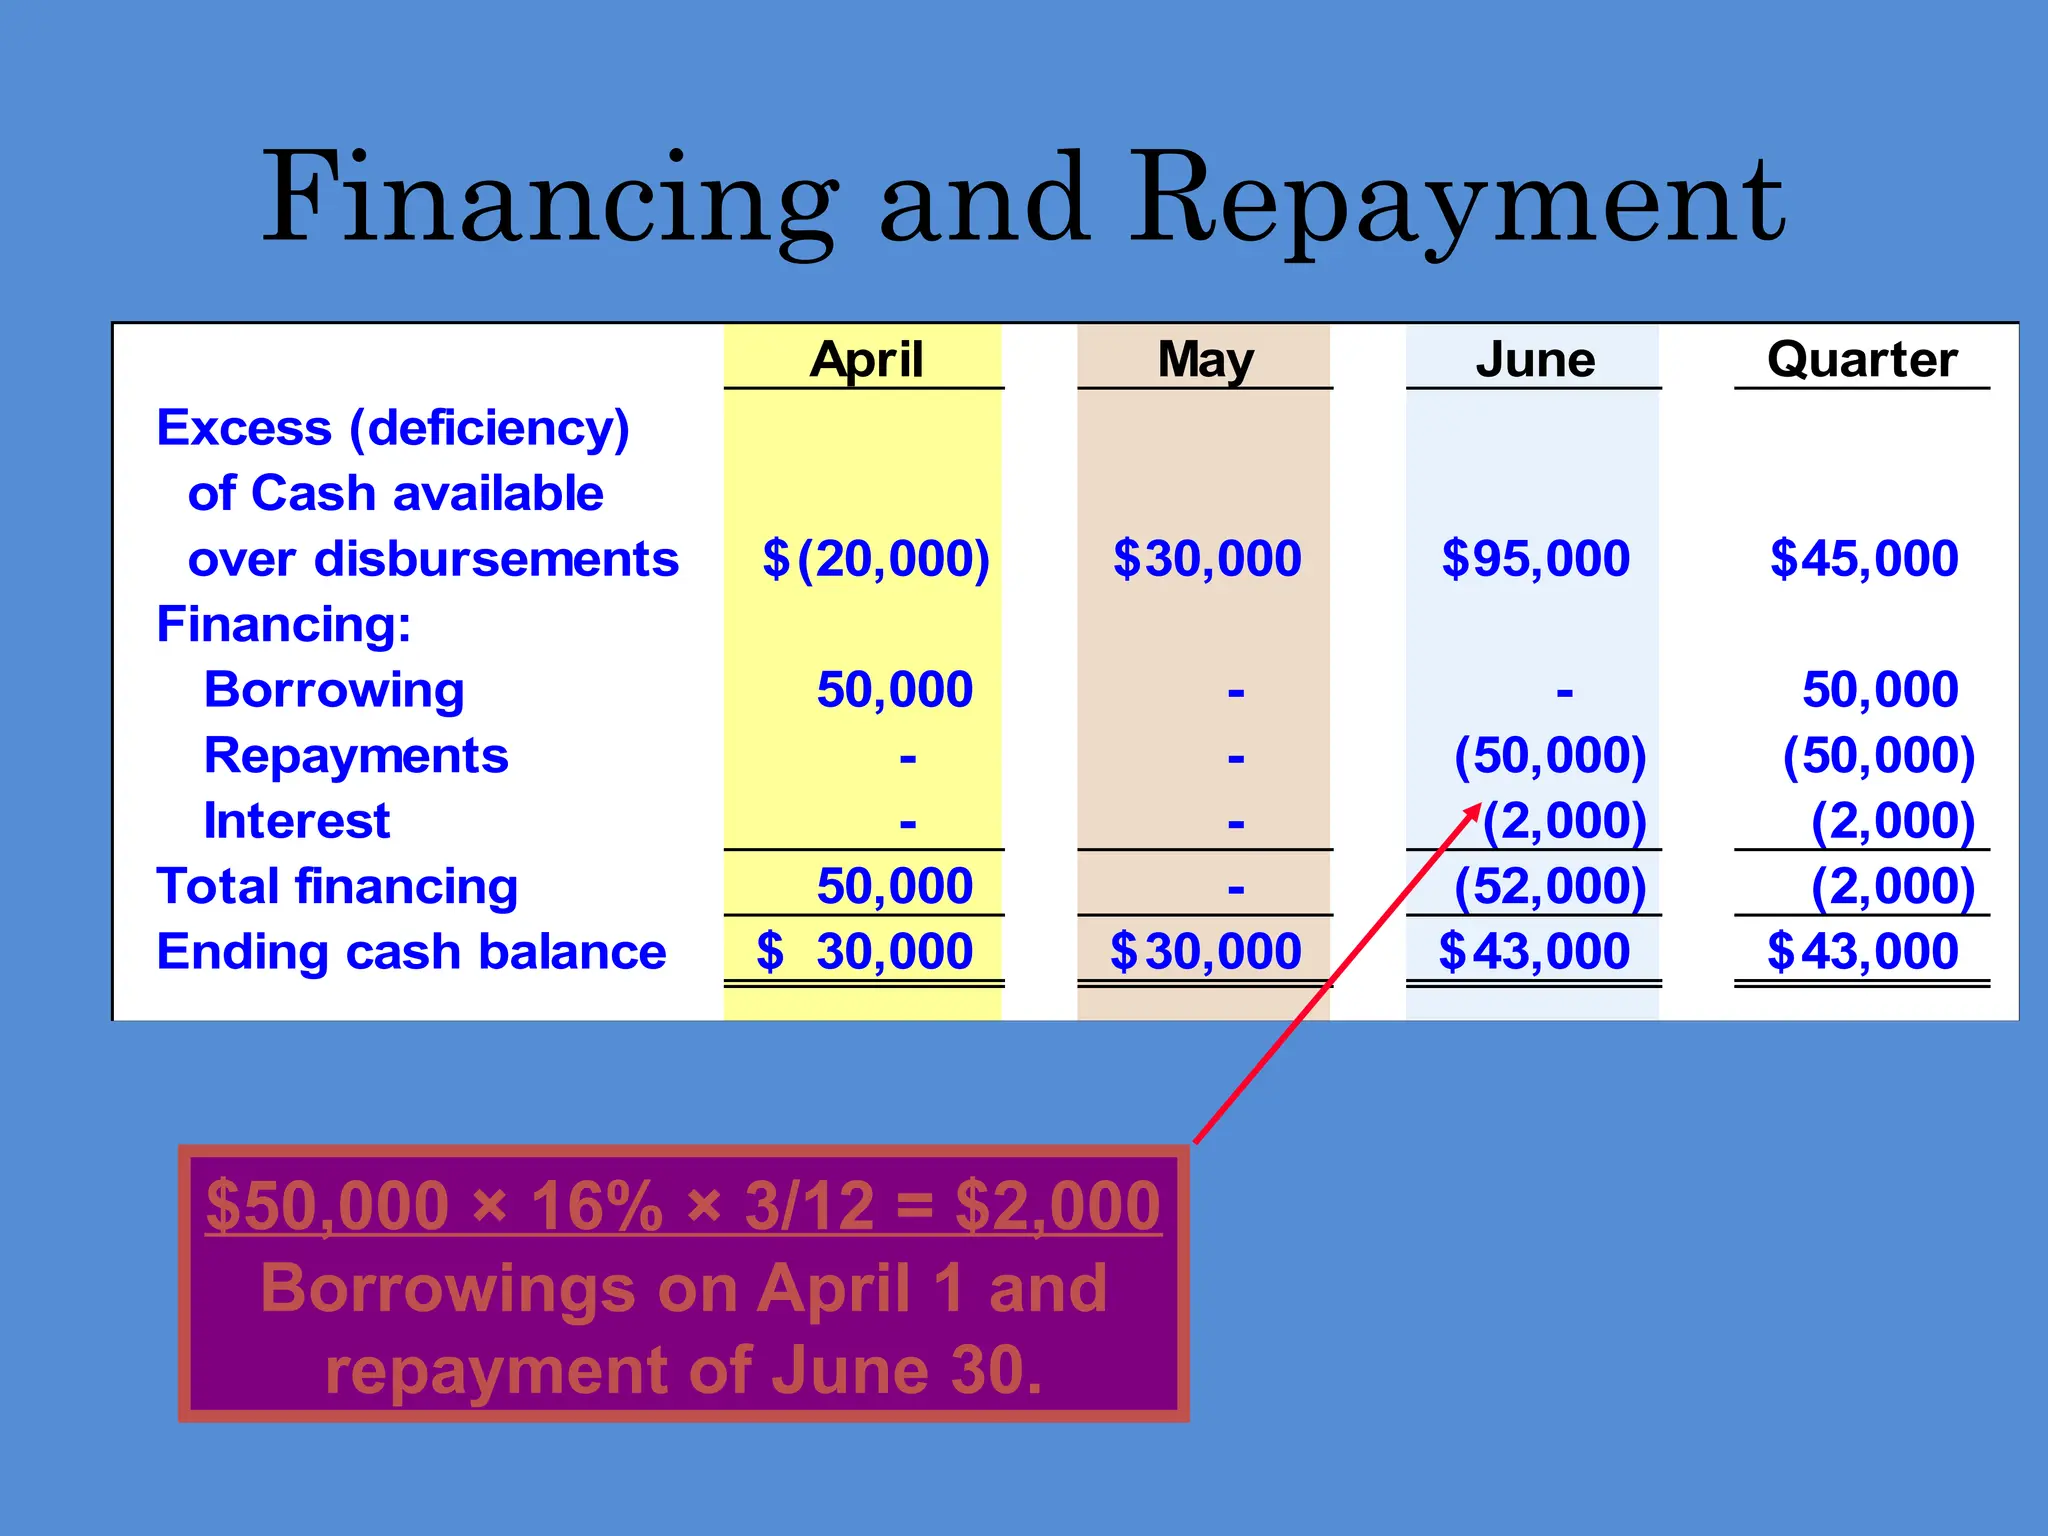
80.
April May JuneQuarter
Excess (deficiency)
of Cash available
over disbursements (20,000)
$ 30,000
$ 95,000
$ 45,000
$
Financing:
Borrowing 50,000 - - 50,000
Repayments - - (50,000) (50,000)
Interest - - (2,000) (2,000)
Total financing 50,000 - (52,000) (2,000)
Ending cash balance 30,000
$ 30,000
$ 43,000
$ 43,000
$
Financing and Repayment
$50,000 × 16% × 3/12 = $2,000
Borrowings on April 1 and
repayment of June 30.
81.
The Budgeted IncomeStatement
Cash
Budget
Budgeted
Income
Statement
Com
pleted
After we complete the cash budget, we can prepare the
budgeted income statement for Royal.
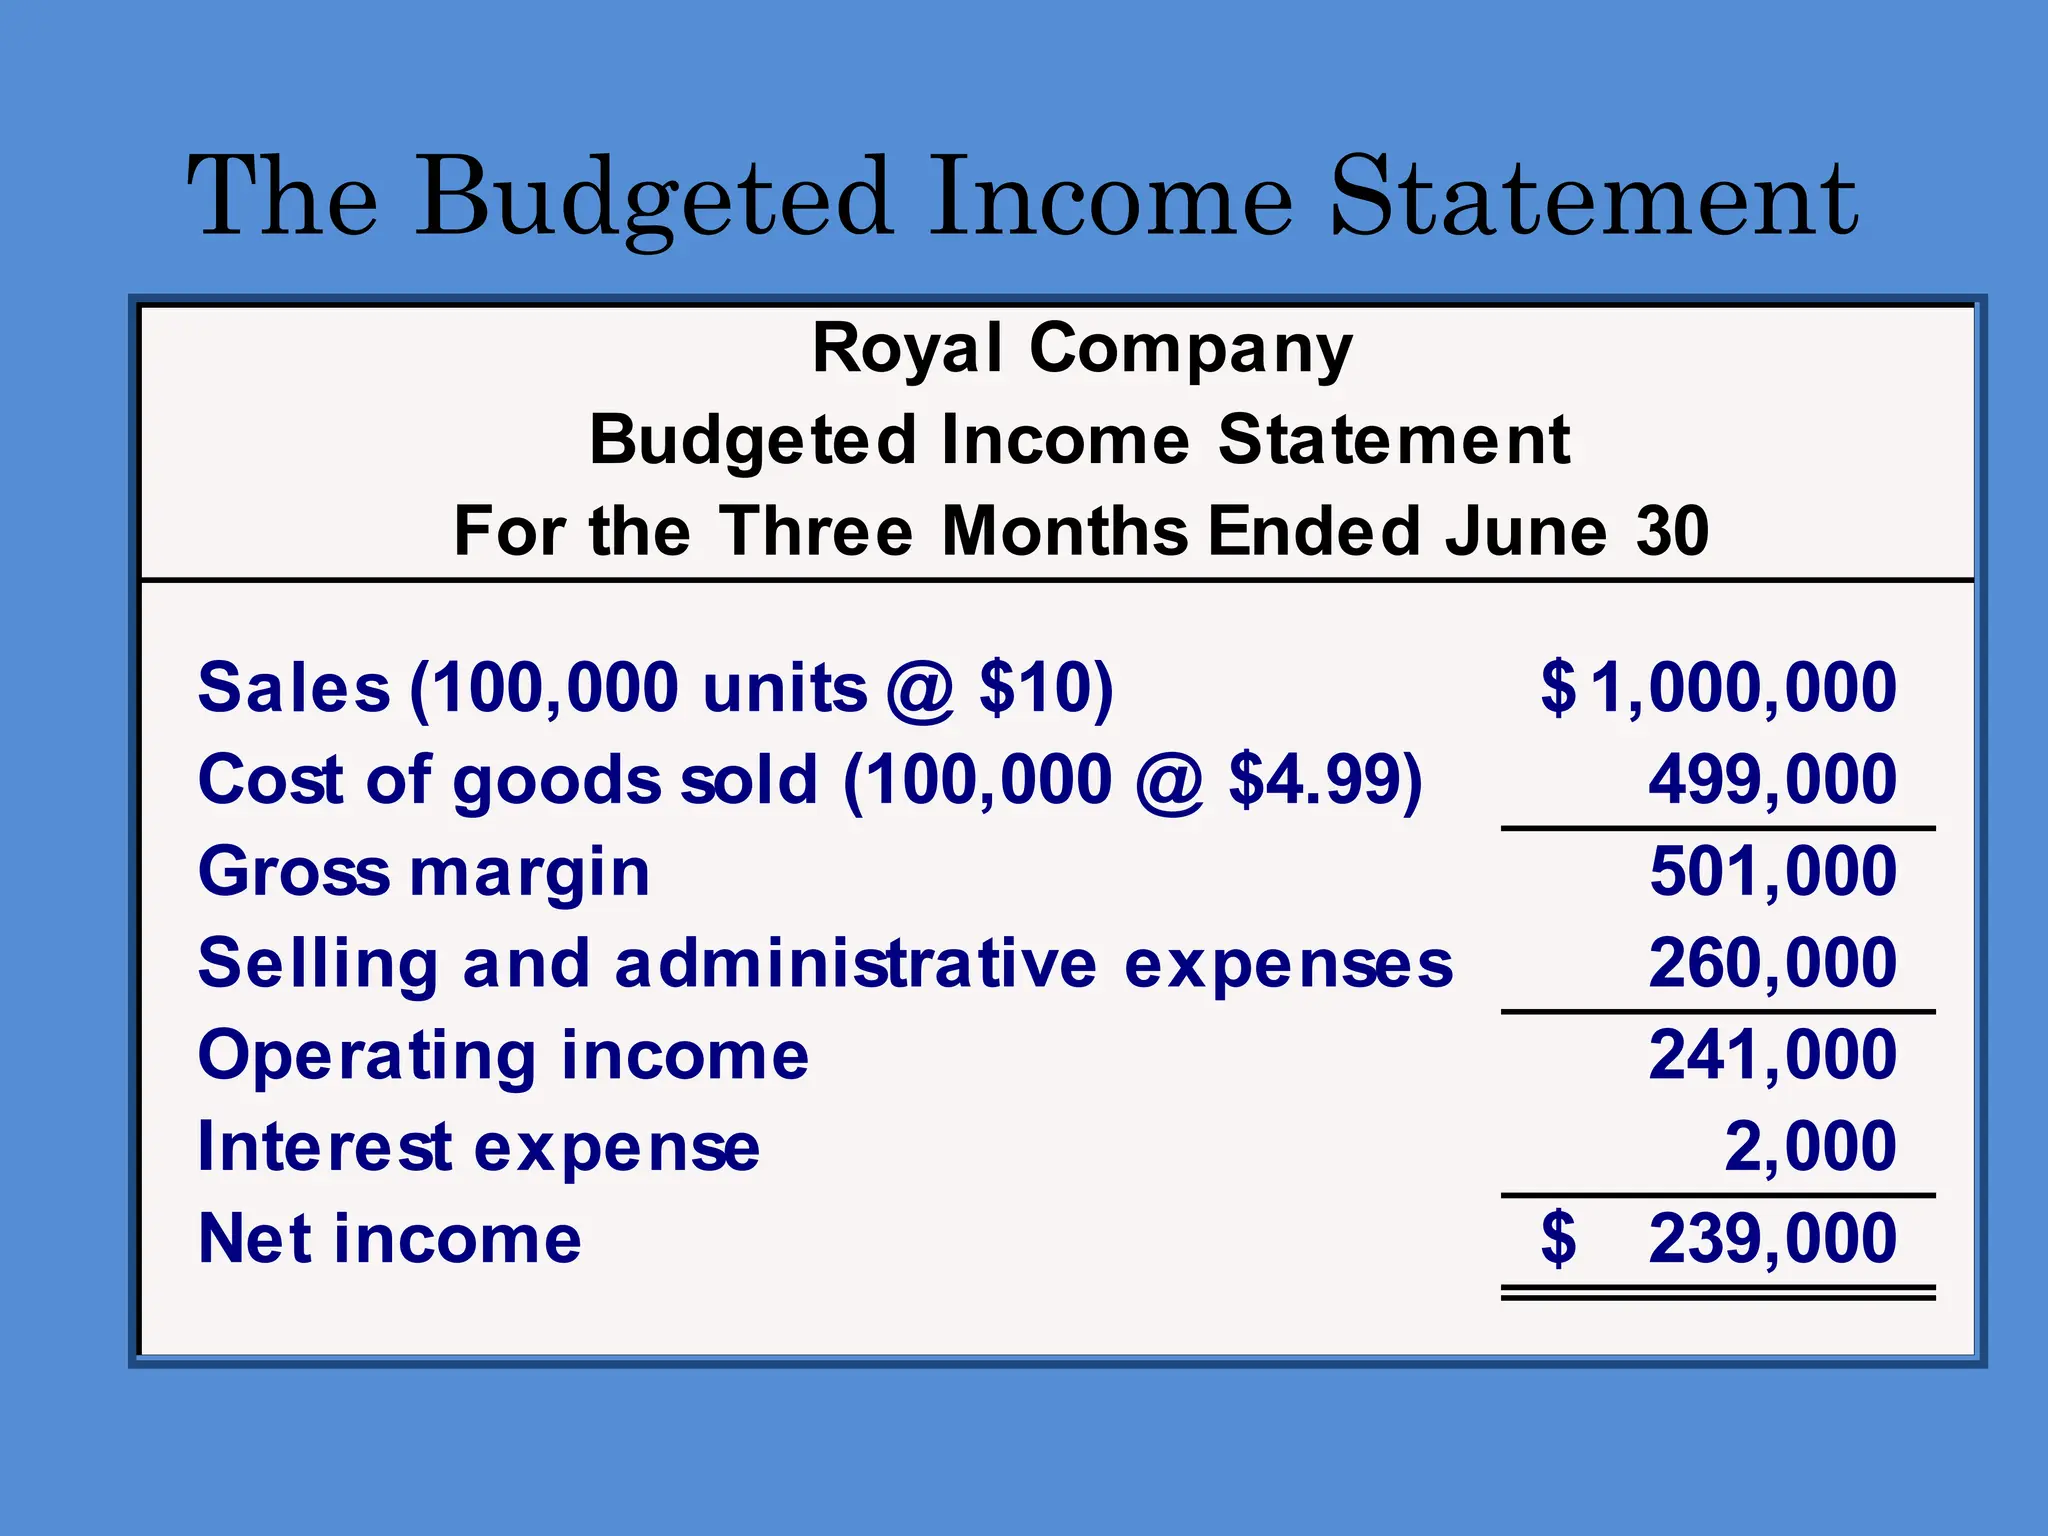
82.
The Budgeted IncomeStatement
Royal Company
Budgeted Income Statement
For the Three Months Ended June 30
Sales (100,000 units @ $10) 1,000,000
$
Cost of goods sold (100,000 @ $4.99) 499,000
Gross margin 501,000
Selling and administrative expenses 260,000
Operating income 241,000
Interest expense 2,000
Net income 239,000
$
83.
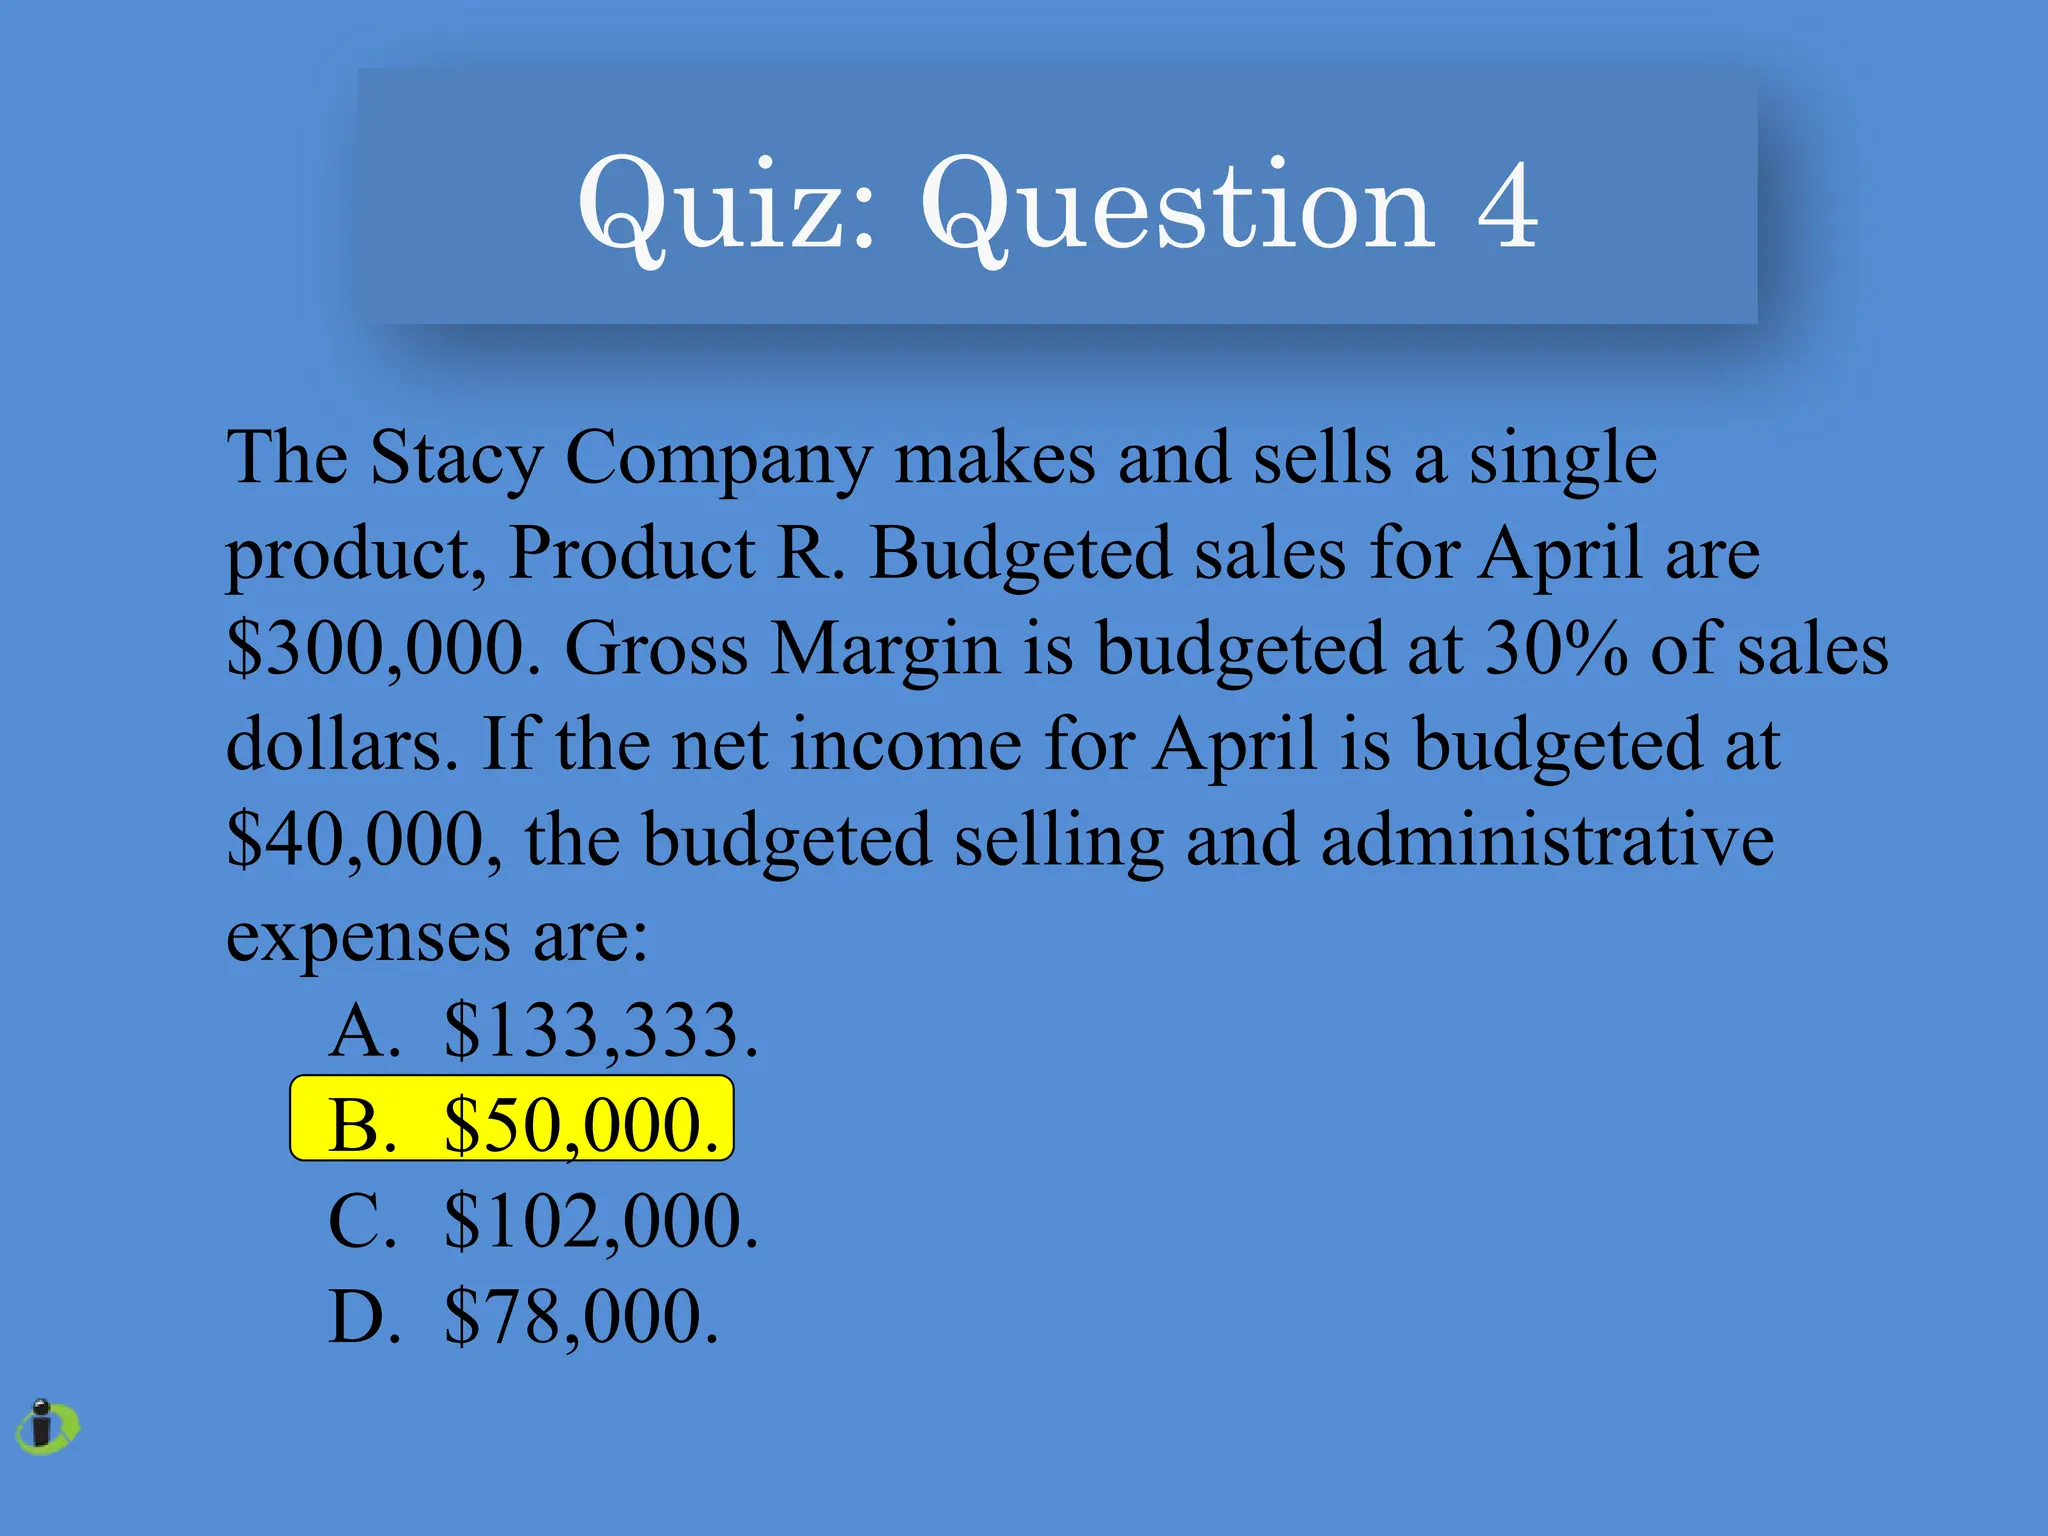
The Stacy Companymakes and sells a single
product, Product R. Budgeted sales for April are
$300,000. Gross Margin is budgeted at 30% of sales
dollars. If the net income for April is budgeted at
$40,000, the budgeted selling and administrative
expenses are:
A. $133,333.
B. $50,000.
C. $102,000.
D. $78,000.
Quiz: Question 4
84.
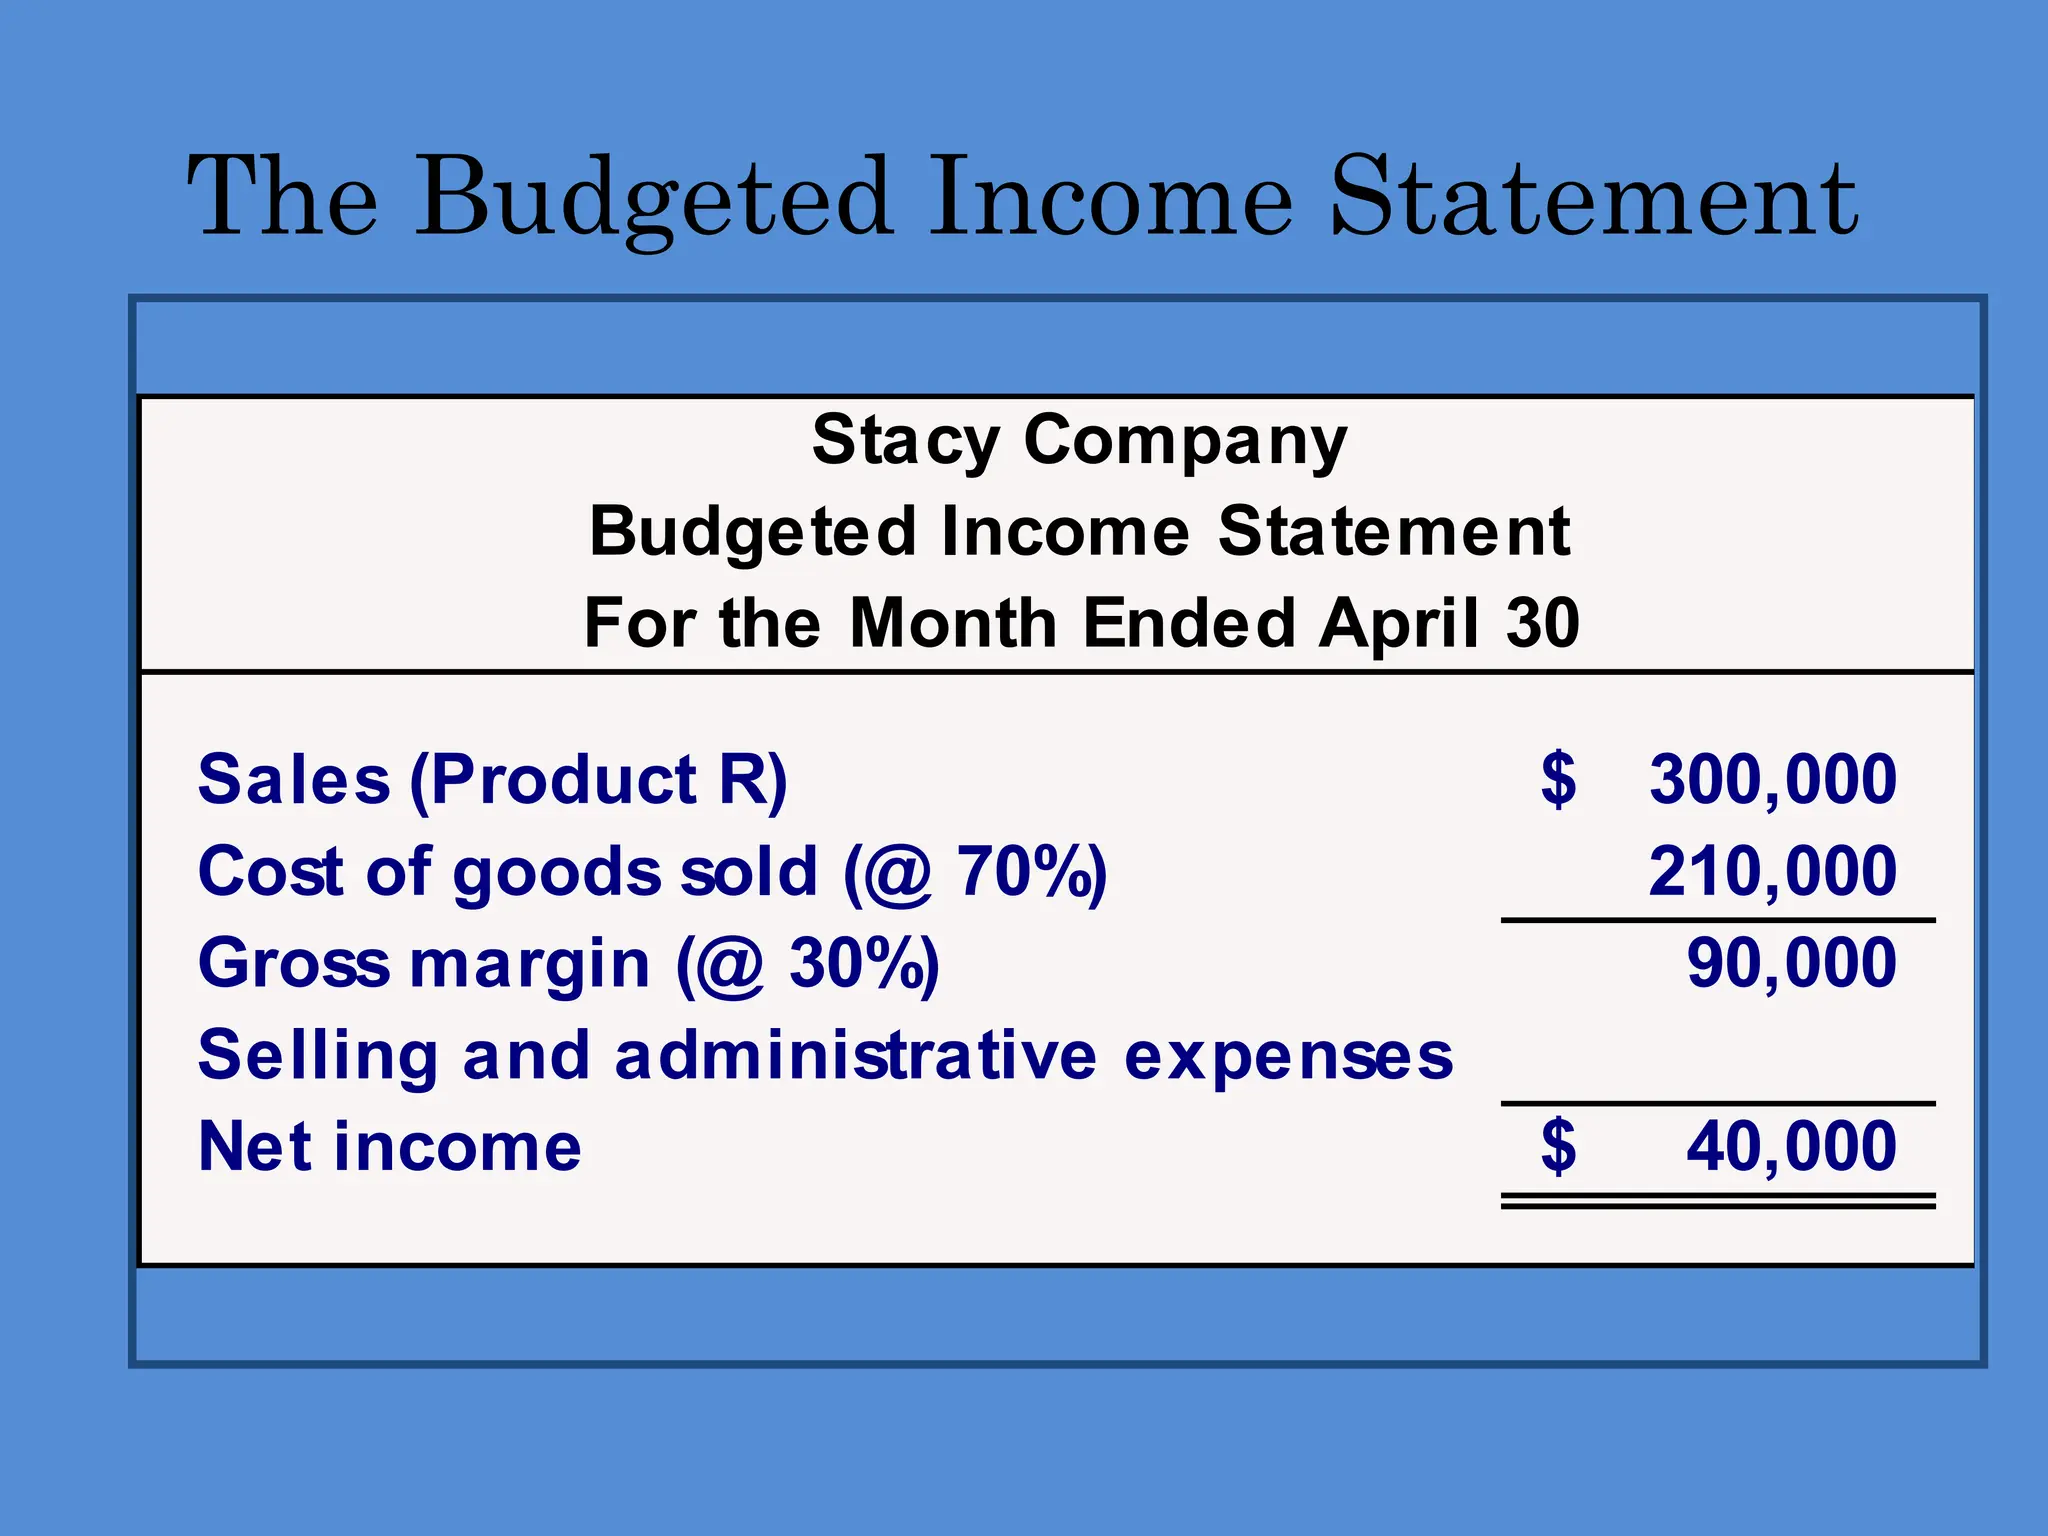
The Budgeted IncomeStatement
Stacy Company
Budgeted Income Statement
For the Month Ended April 30
Sales (Product R) 300,000
$
Cost of goods sold (@ 70%) 210,000
Gross margin (@ 30%) 90,000
Selling and administrative expenses
Net income 40,000
$
85.
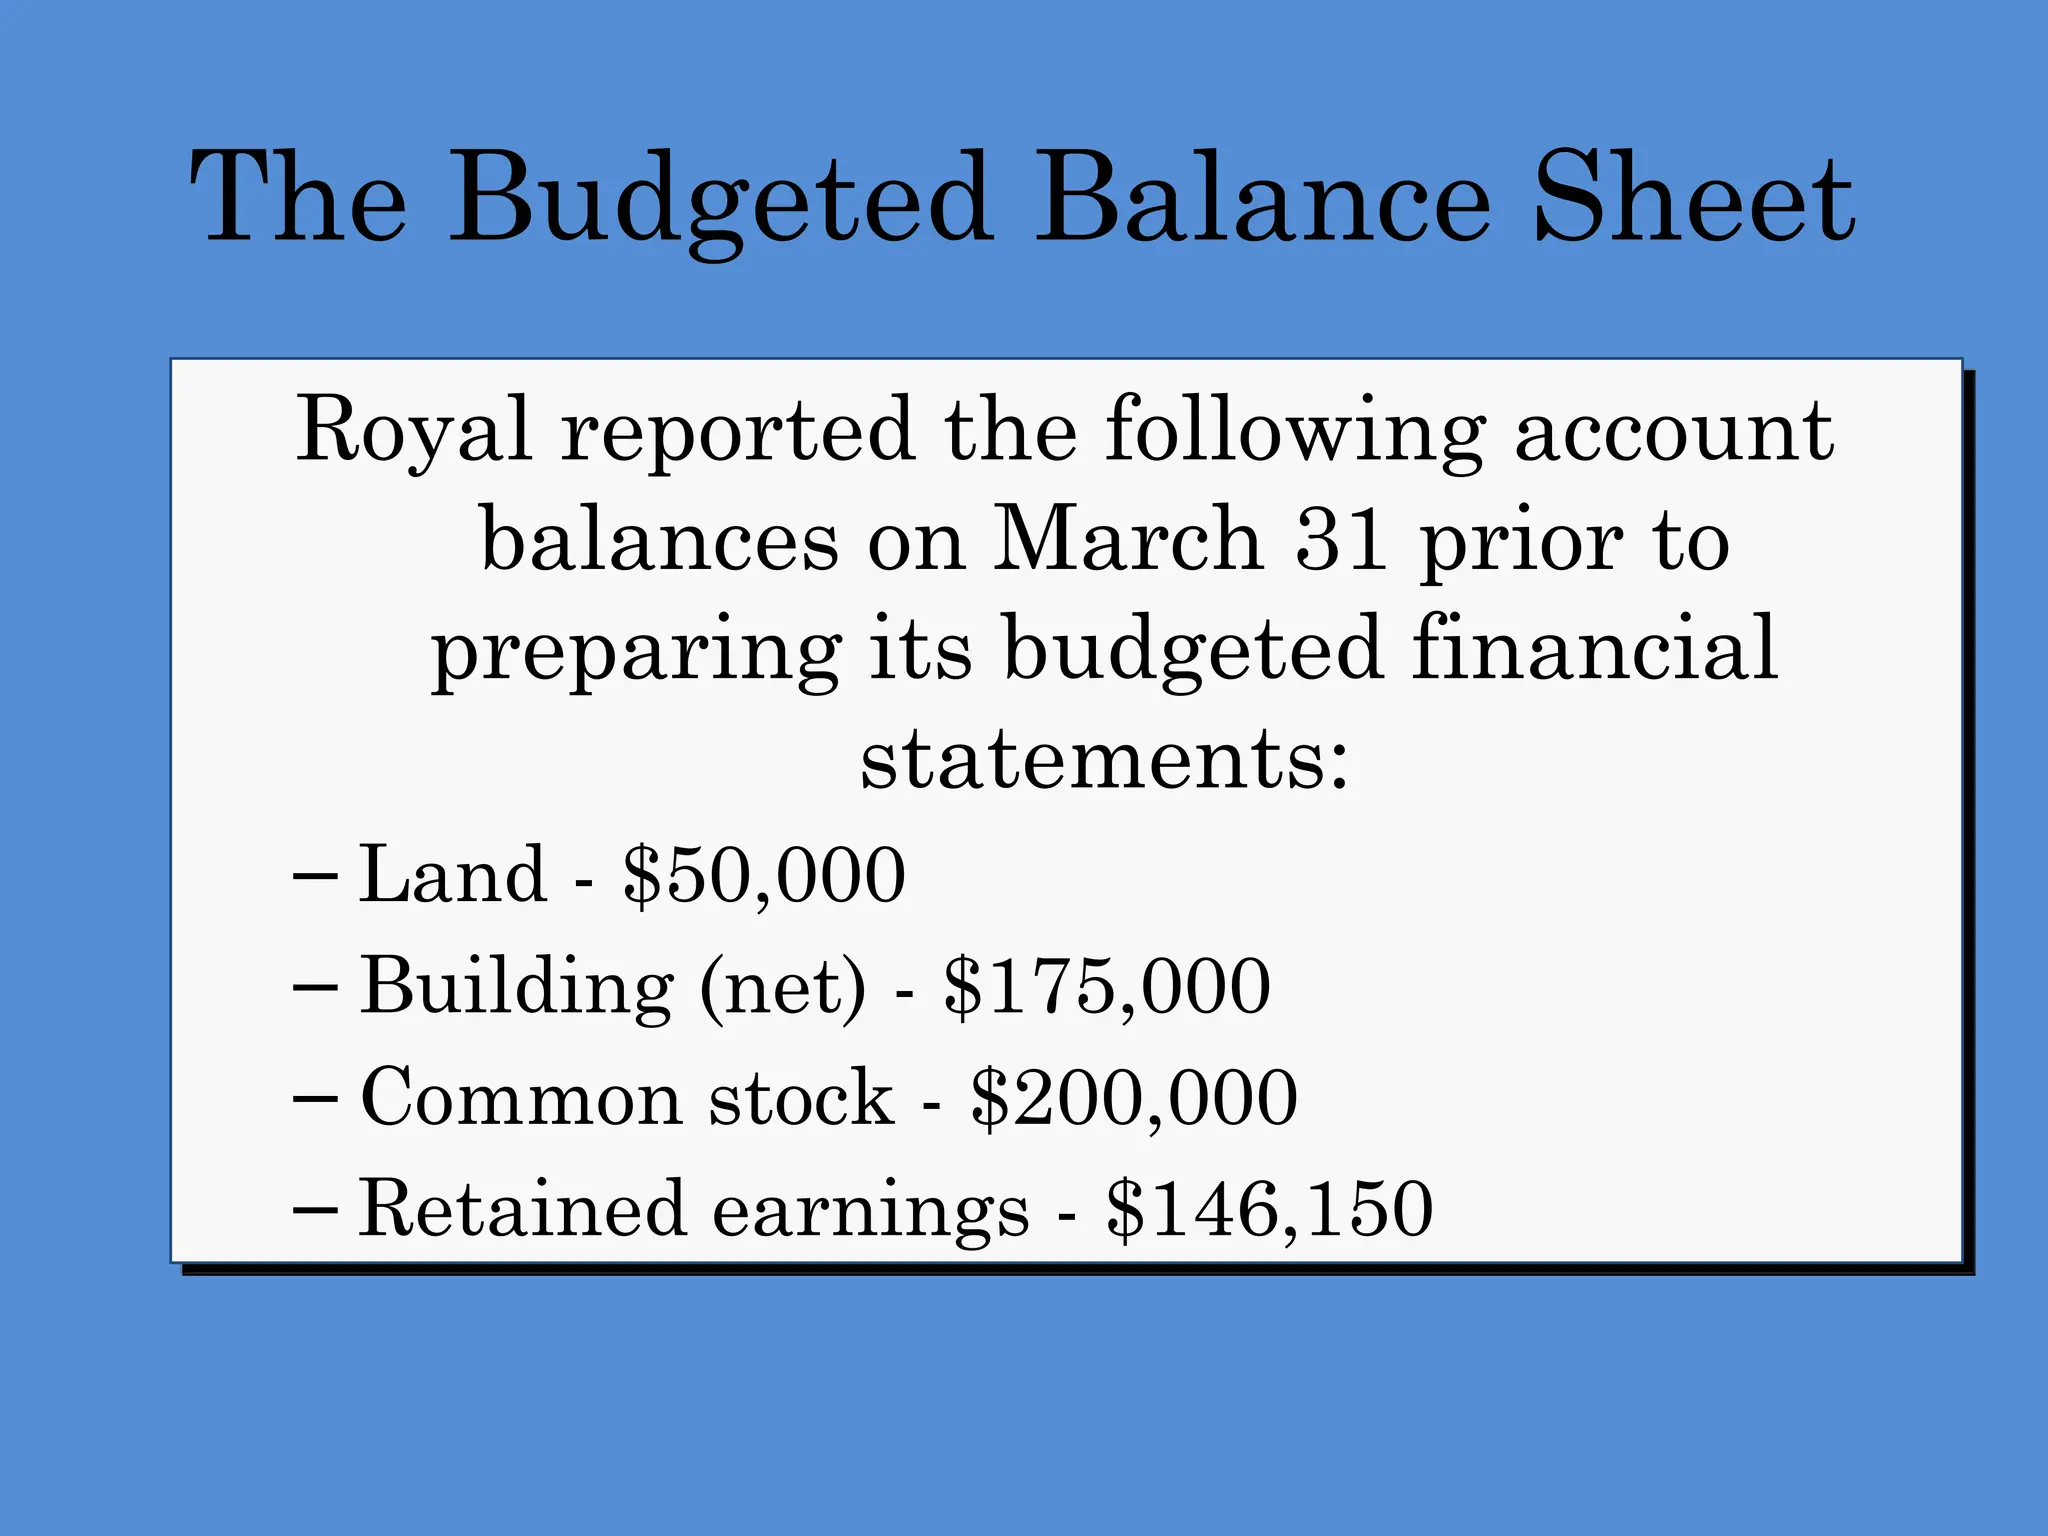
The Budgeted BalanceSheet
Royal reported the following account
balances on March 31 prior to
preparing its budgeted financial
statements:
– Land - $50,000
– Building (net) - $175,000
– Common stock - $200,000
– Retained earnings - $146,150
86.
Royal Company
Budgeted BalanceSheet
June 30
Current assets
Cash 43,000
$
Accounts receivable 75,000
Raw materials inventory 4,600
Finished goods inventory 24,950
Total current assets 147,550
Property and equipment
Land 50,000
Building 175,000
Equipment 192,000
Total property and equipment 417,000
Total assets 564,550
$
Accounts payable 28,400
$
Common stock 200,000
Retained earnings 336,150
Total liabilities and equities 564,550
$
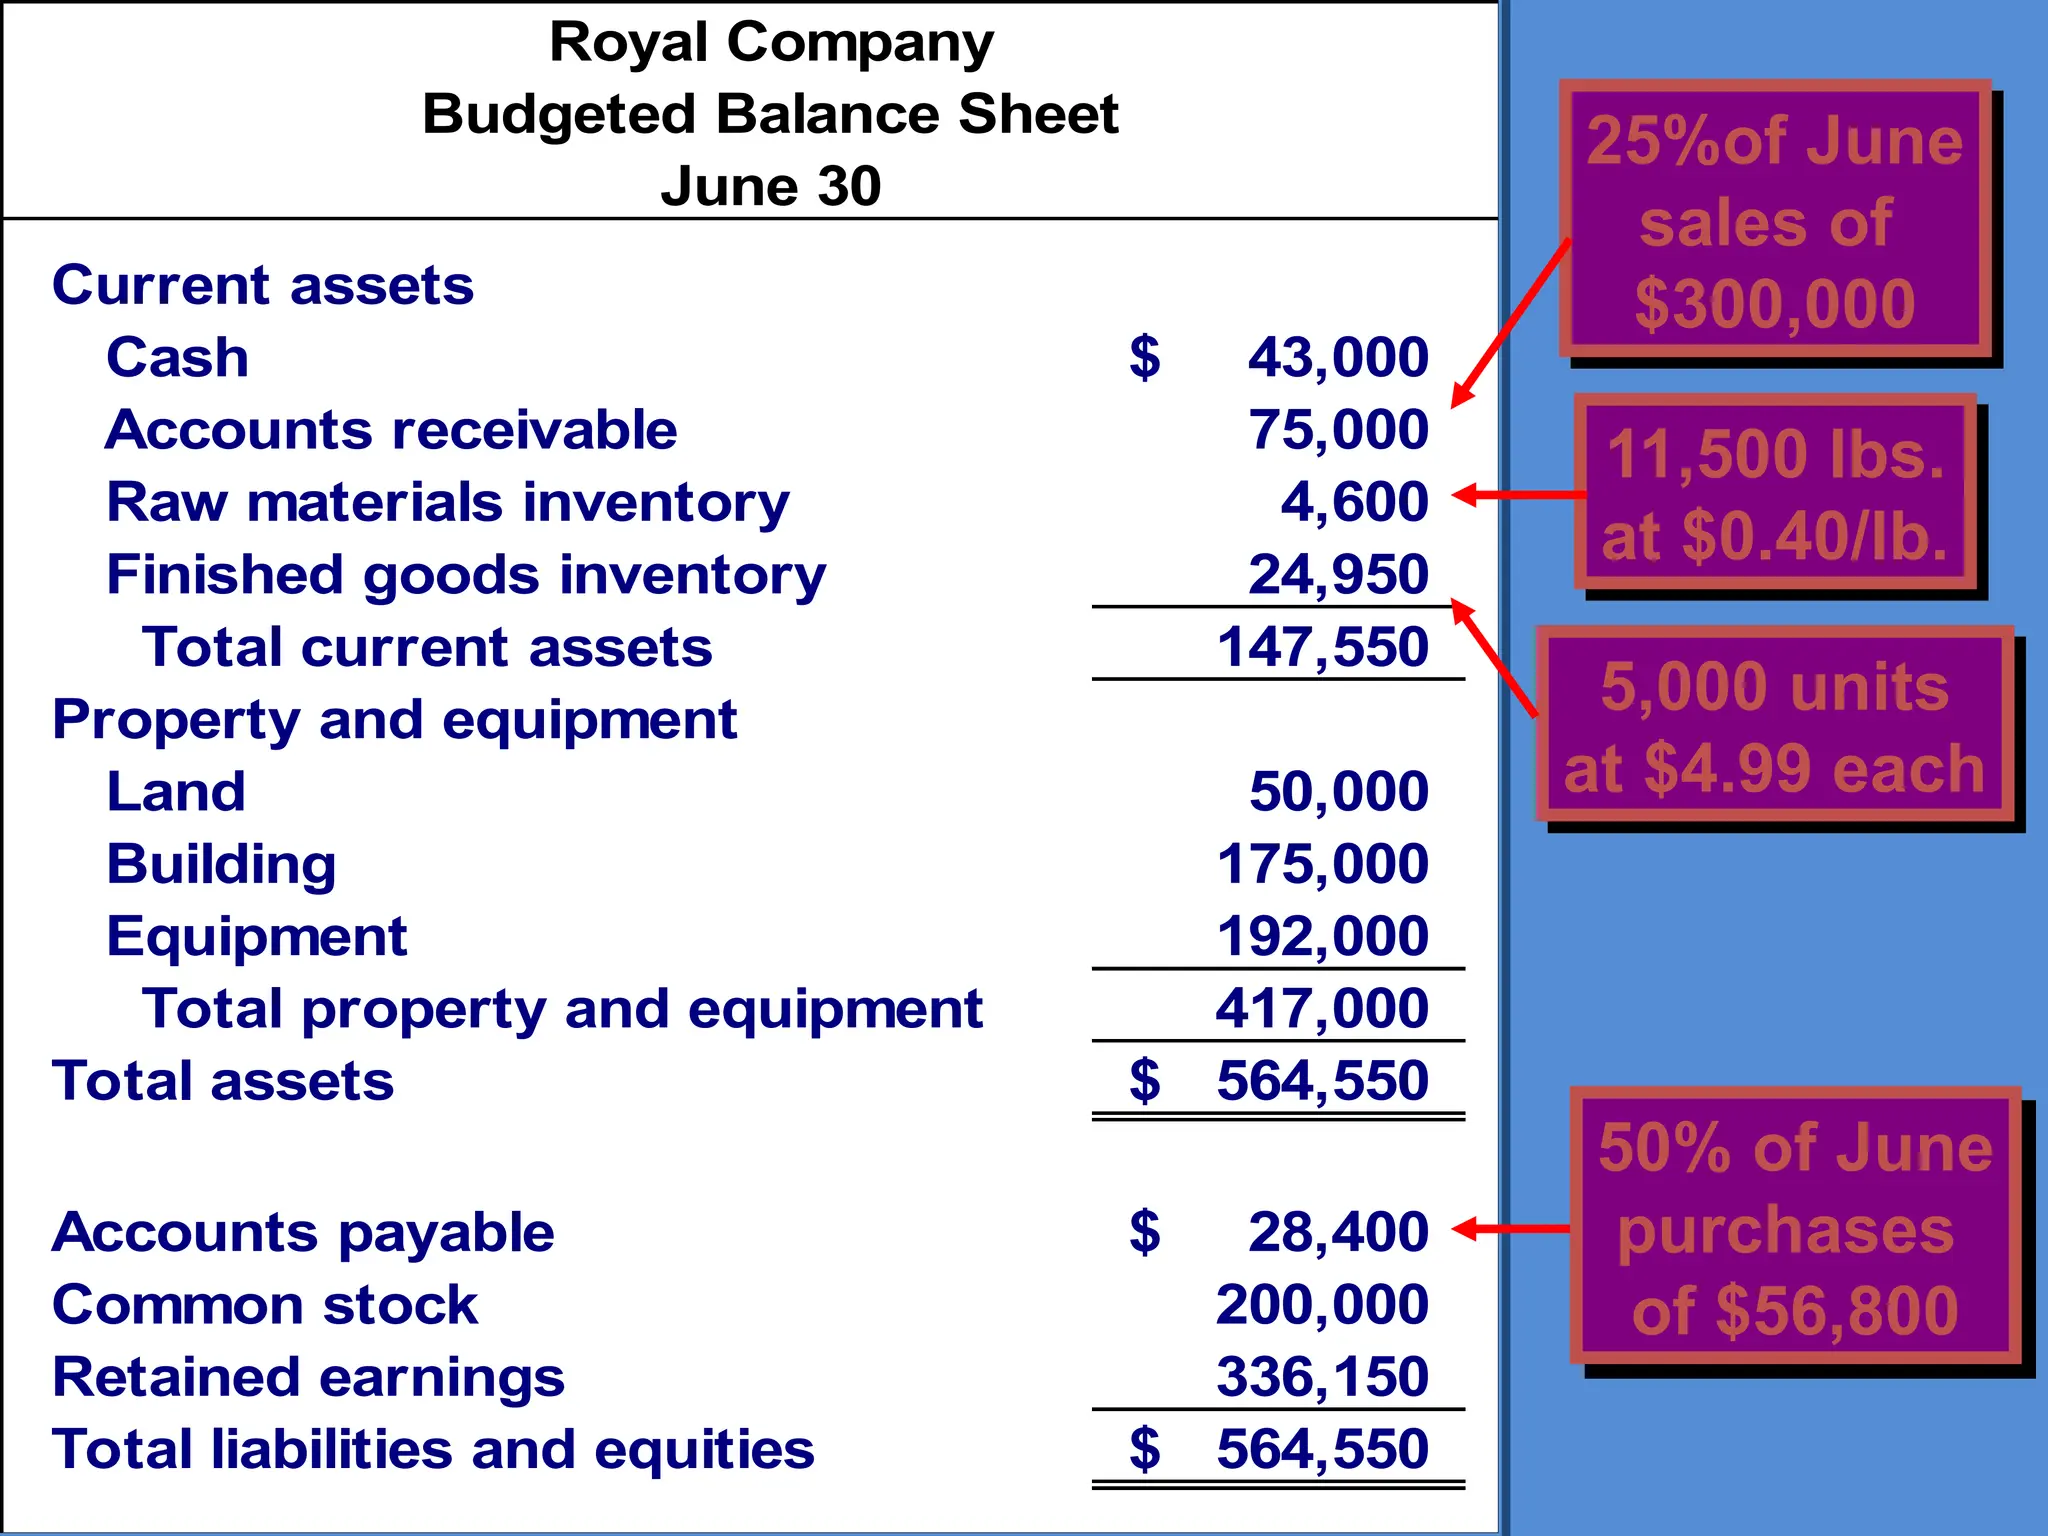
25%of June
sales of
$300,000
5,000 units
at $4.99 each
11,500 lbs.
at $0.40/lb.
50% of June
purchases
of $56,800
87.
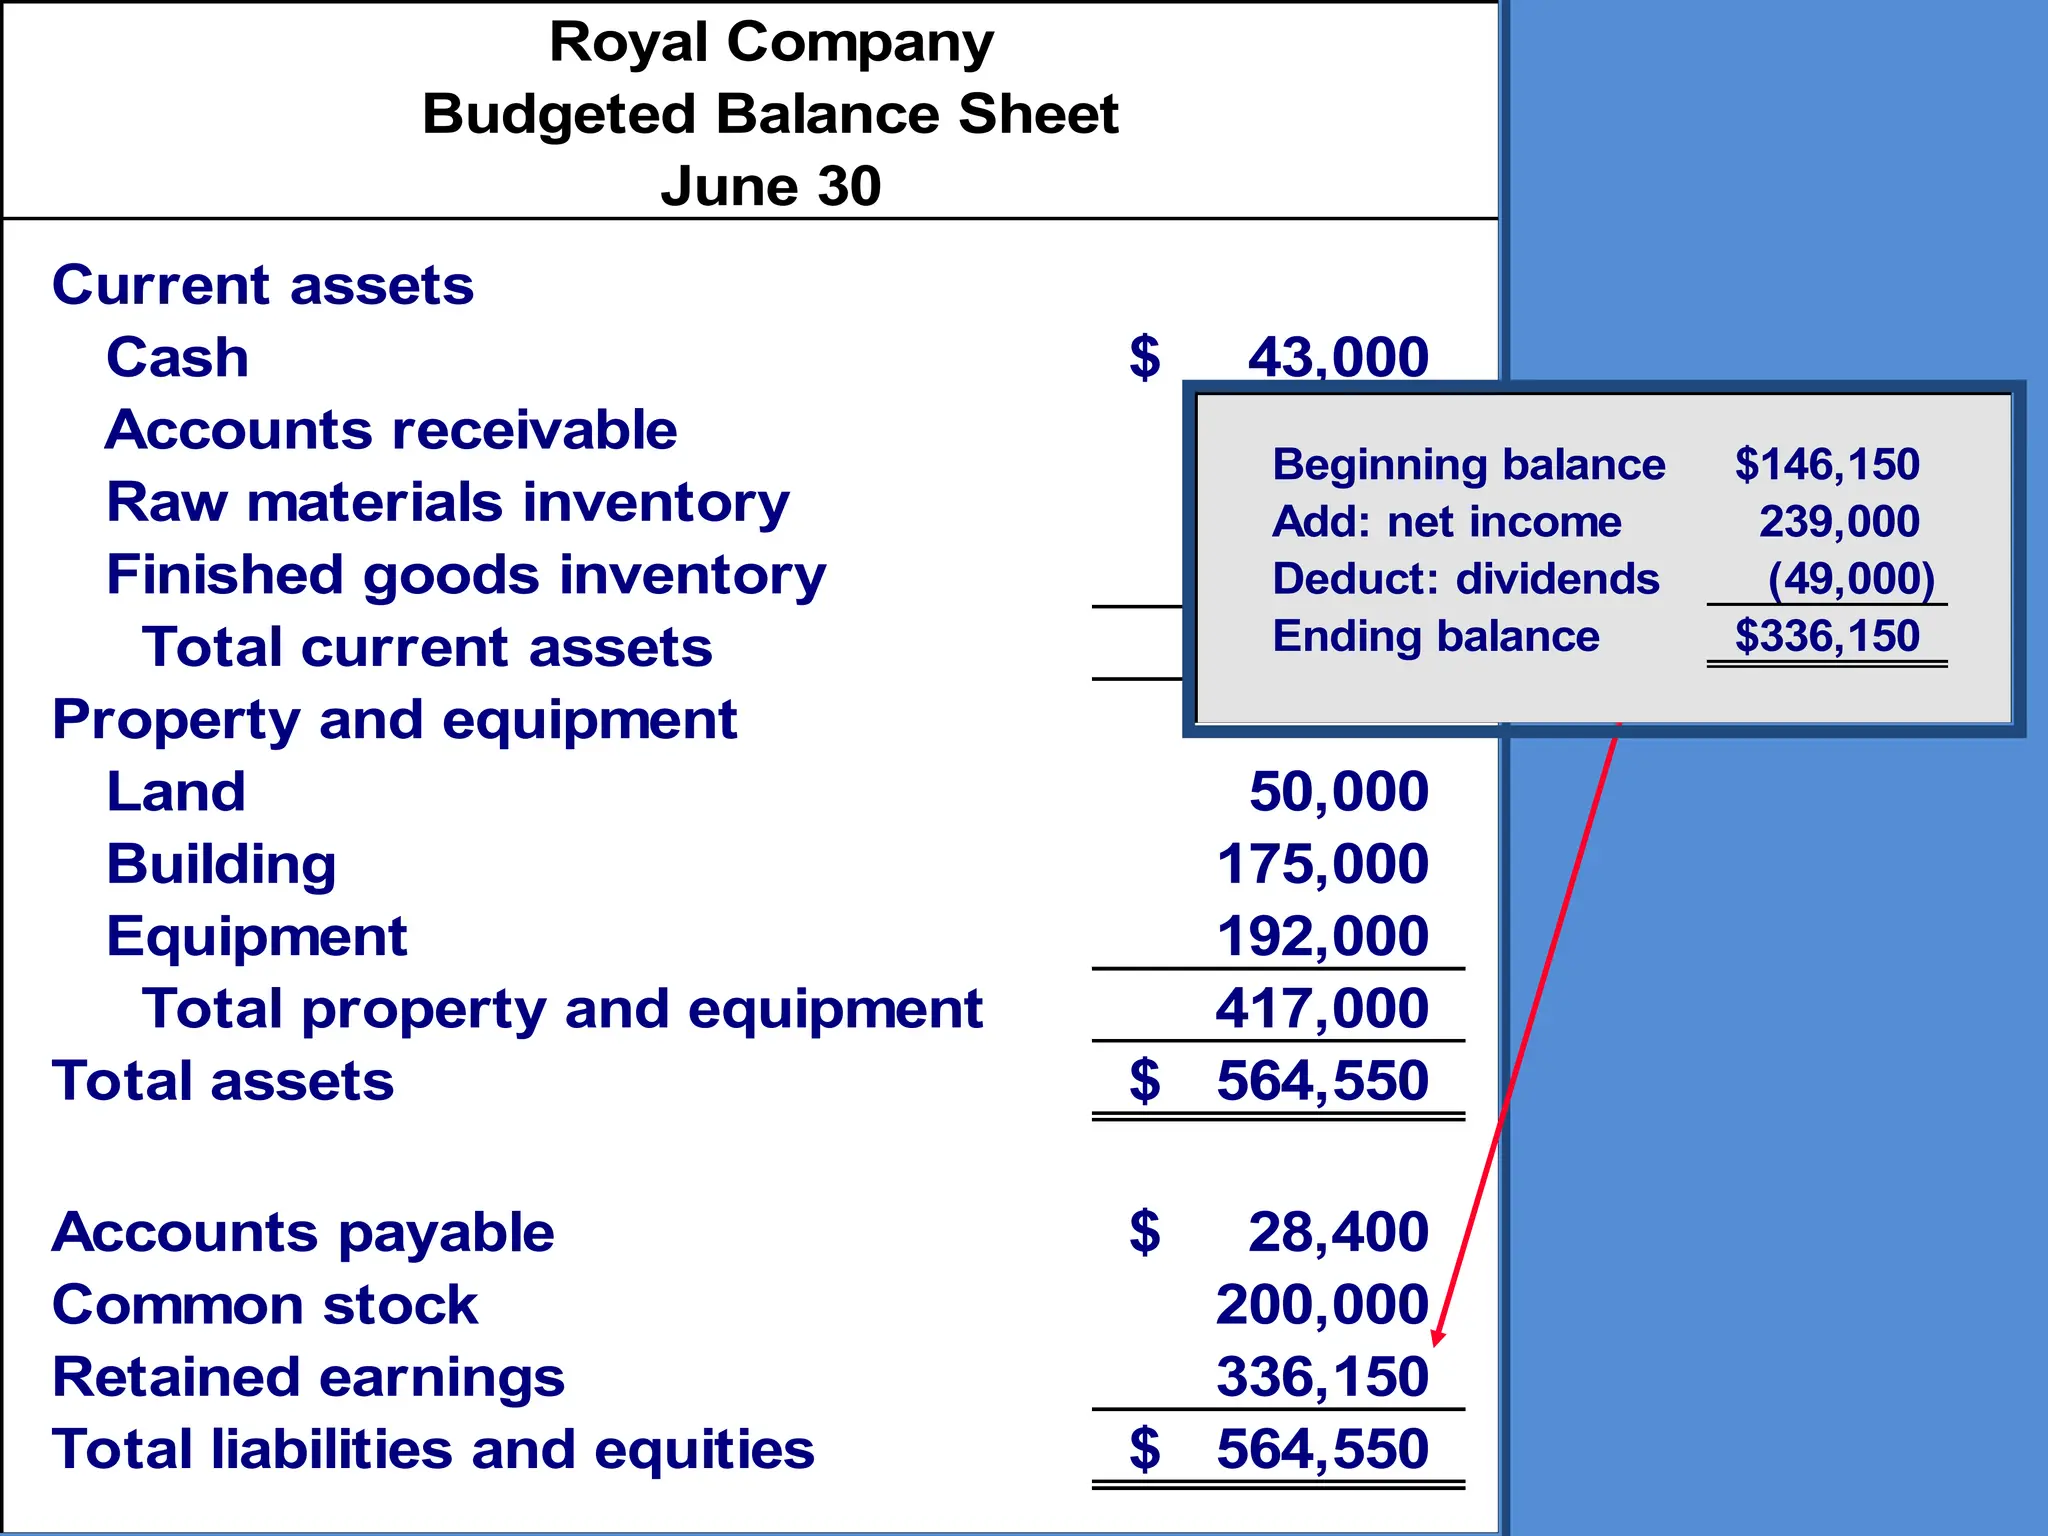
Royal Company
Budgeted BalanceSheet
June 30
Current assets
Cash 43,000
$
Accounts receivable 75,000
Raw materials inventory 4,600
Finished goods inventory 24,950
Total current assets 147,550
Property and equipment
Land 50,000
Building 175,000
Equipment 192,000
Total property and equipment 417,000
Total assets 564,550
$
Accounts payable 28,400
$
Common stock 200,000
Retained earnings 336,150
Total liabilities and equities 564,550
$
Beginning balance 146,150
$
Add: net income 239,000
Deduct: dividends (49,000)
Ending balance 336,150
$
88.
Zero-Base Budgeting
Managers arerequired to justify all budgeted
expenditures, not just changes in the budget
from the previous year. The baseline is zero
rather than last year’s budget.
89.
International Aspects ofBudgeting
Multinational companies face special
problems when preparing a budget.
– Fluctuations in foreign currency exchange rates.
– High inflation rates in some foreign countries.
– Differences in local economic conditions.
– Local governmental policies.