Download to read offline

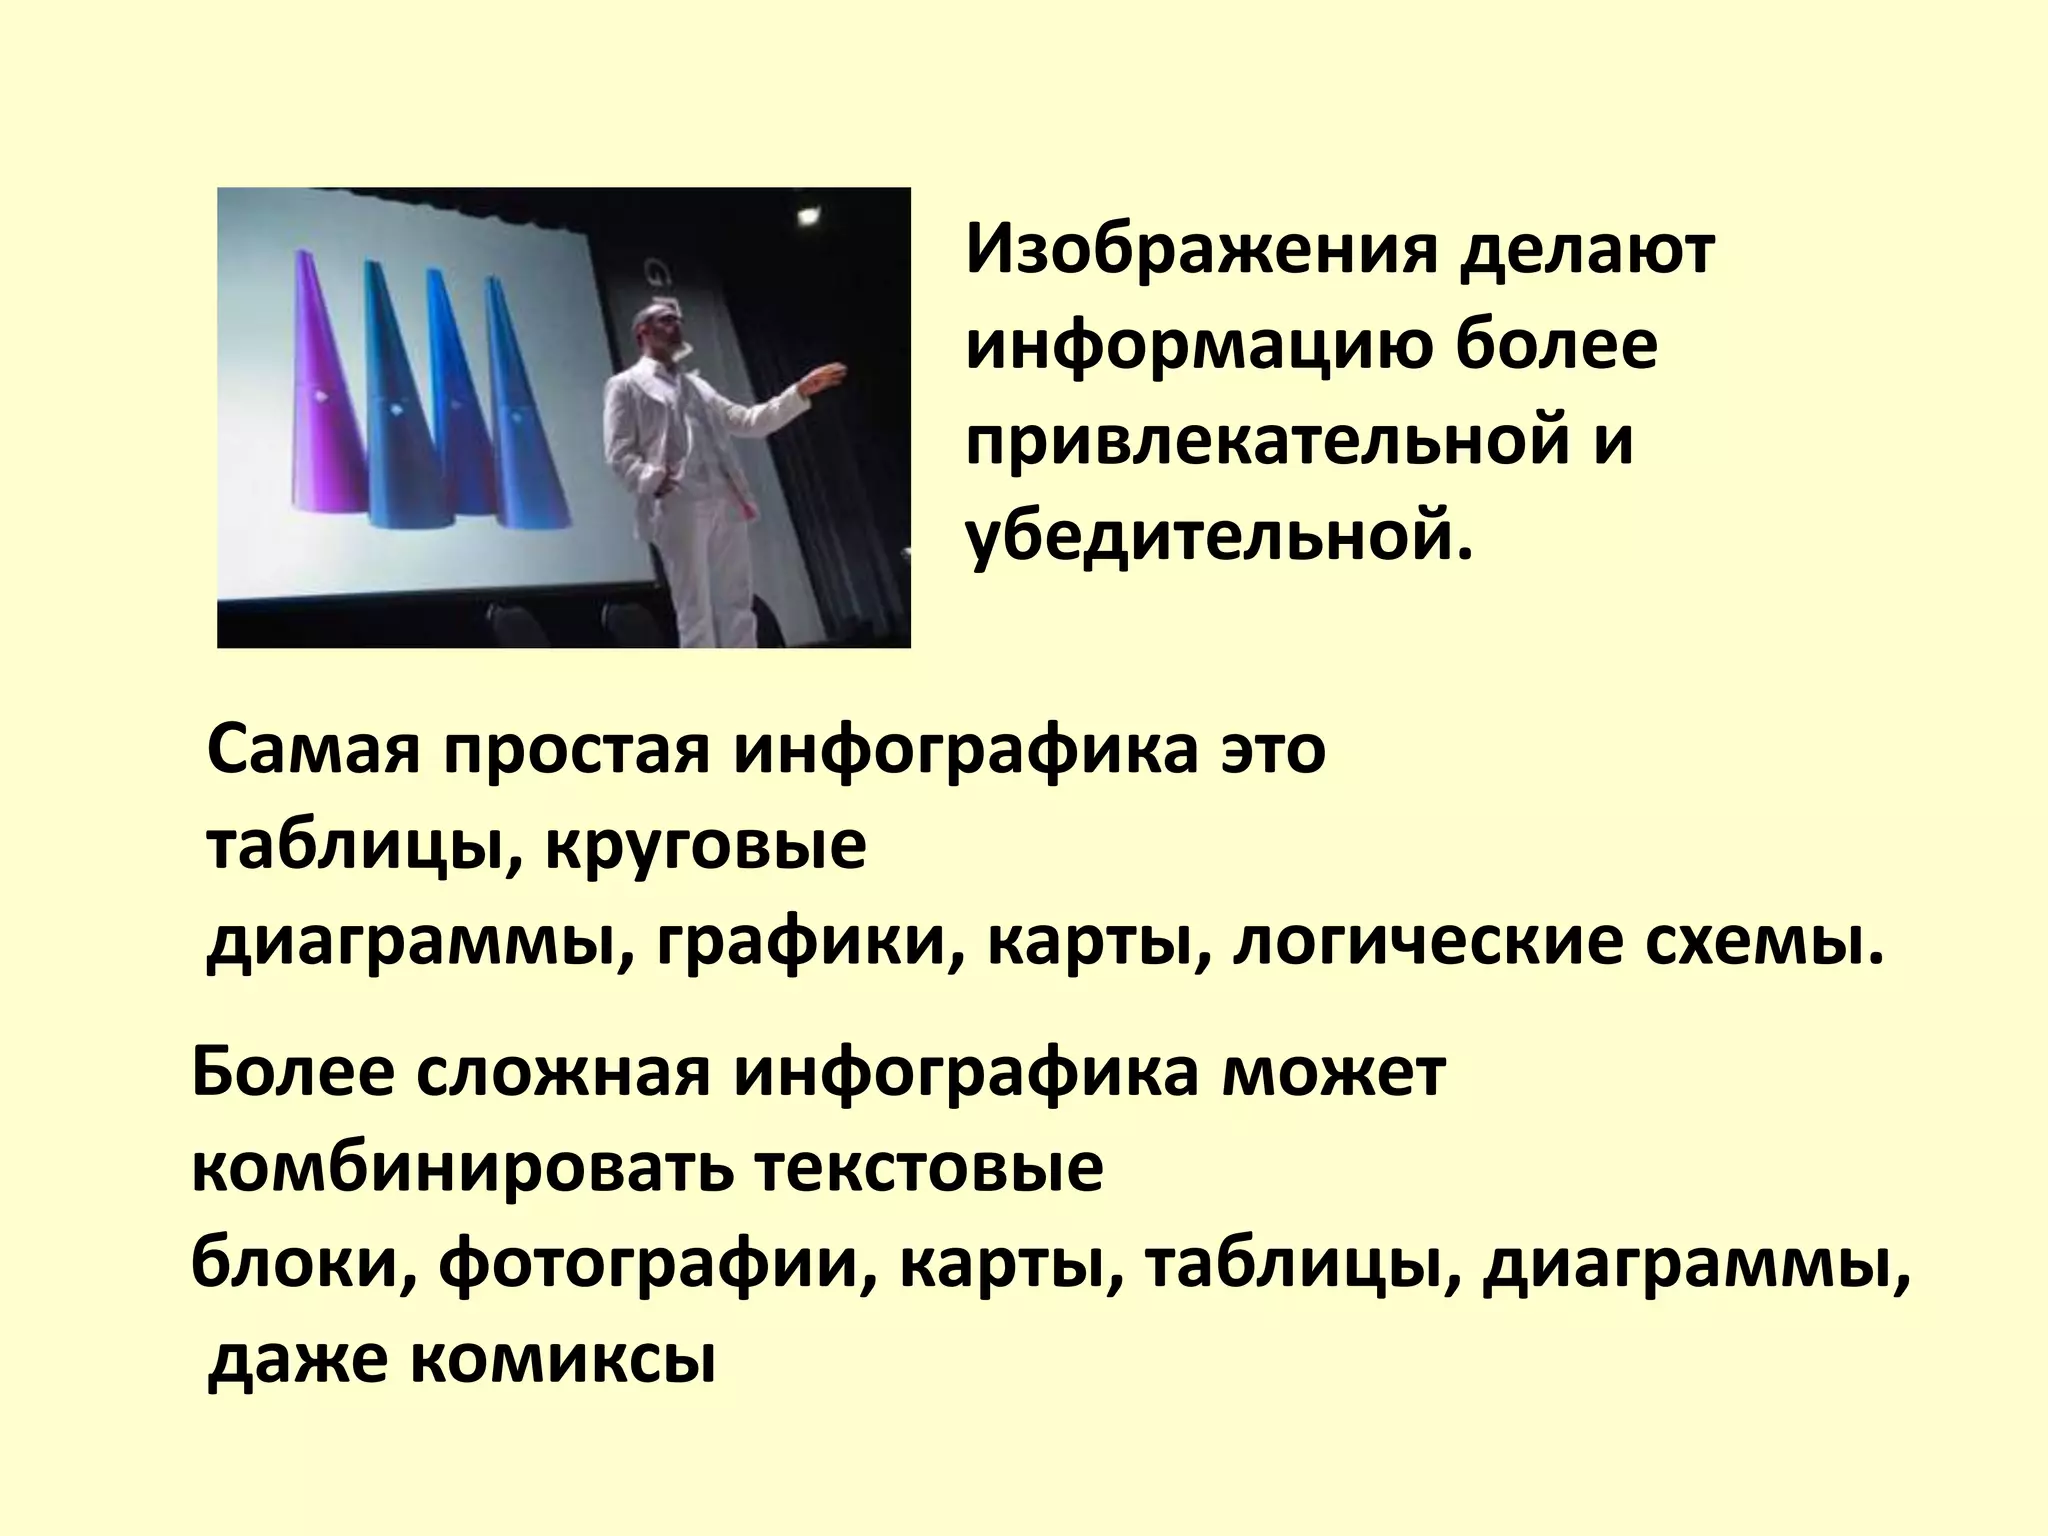
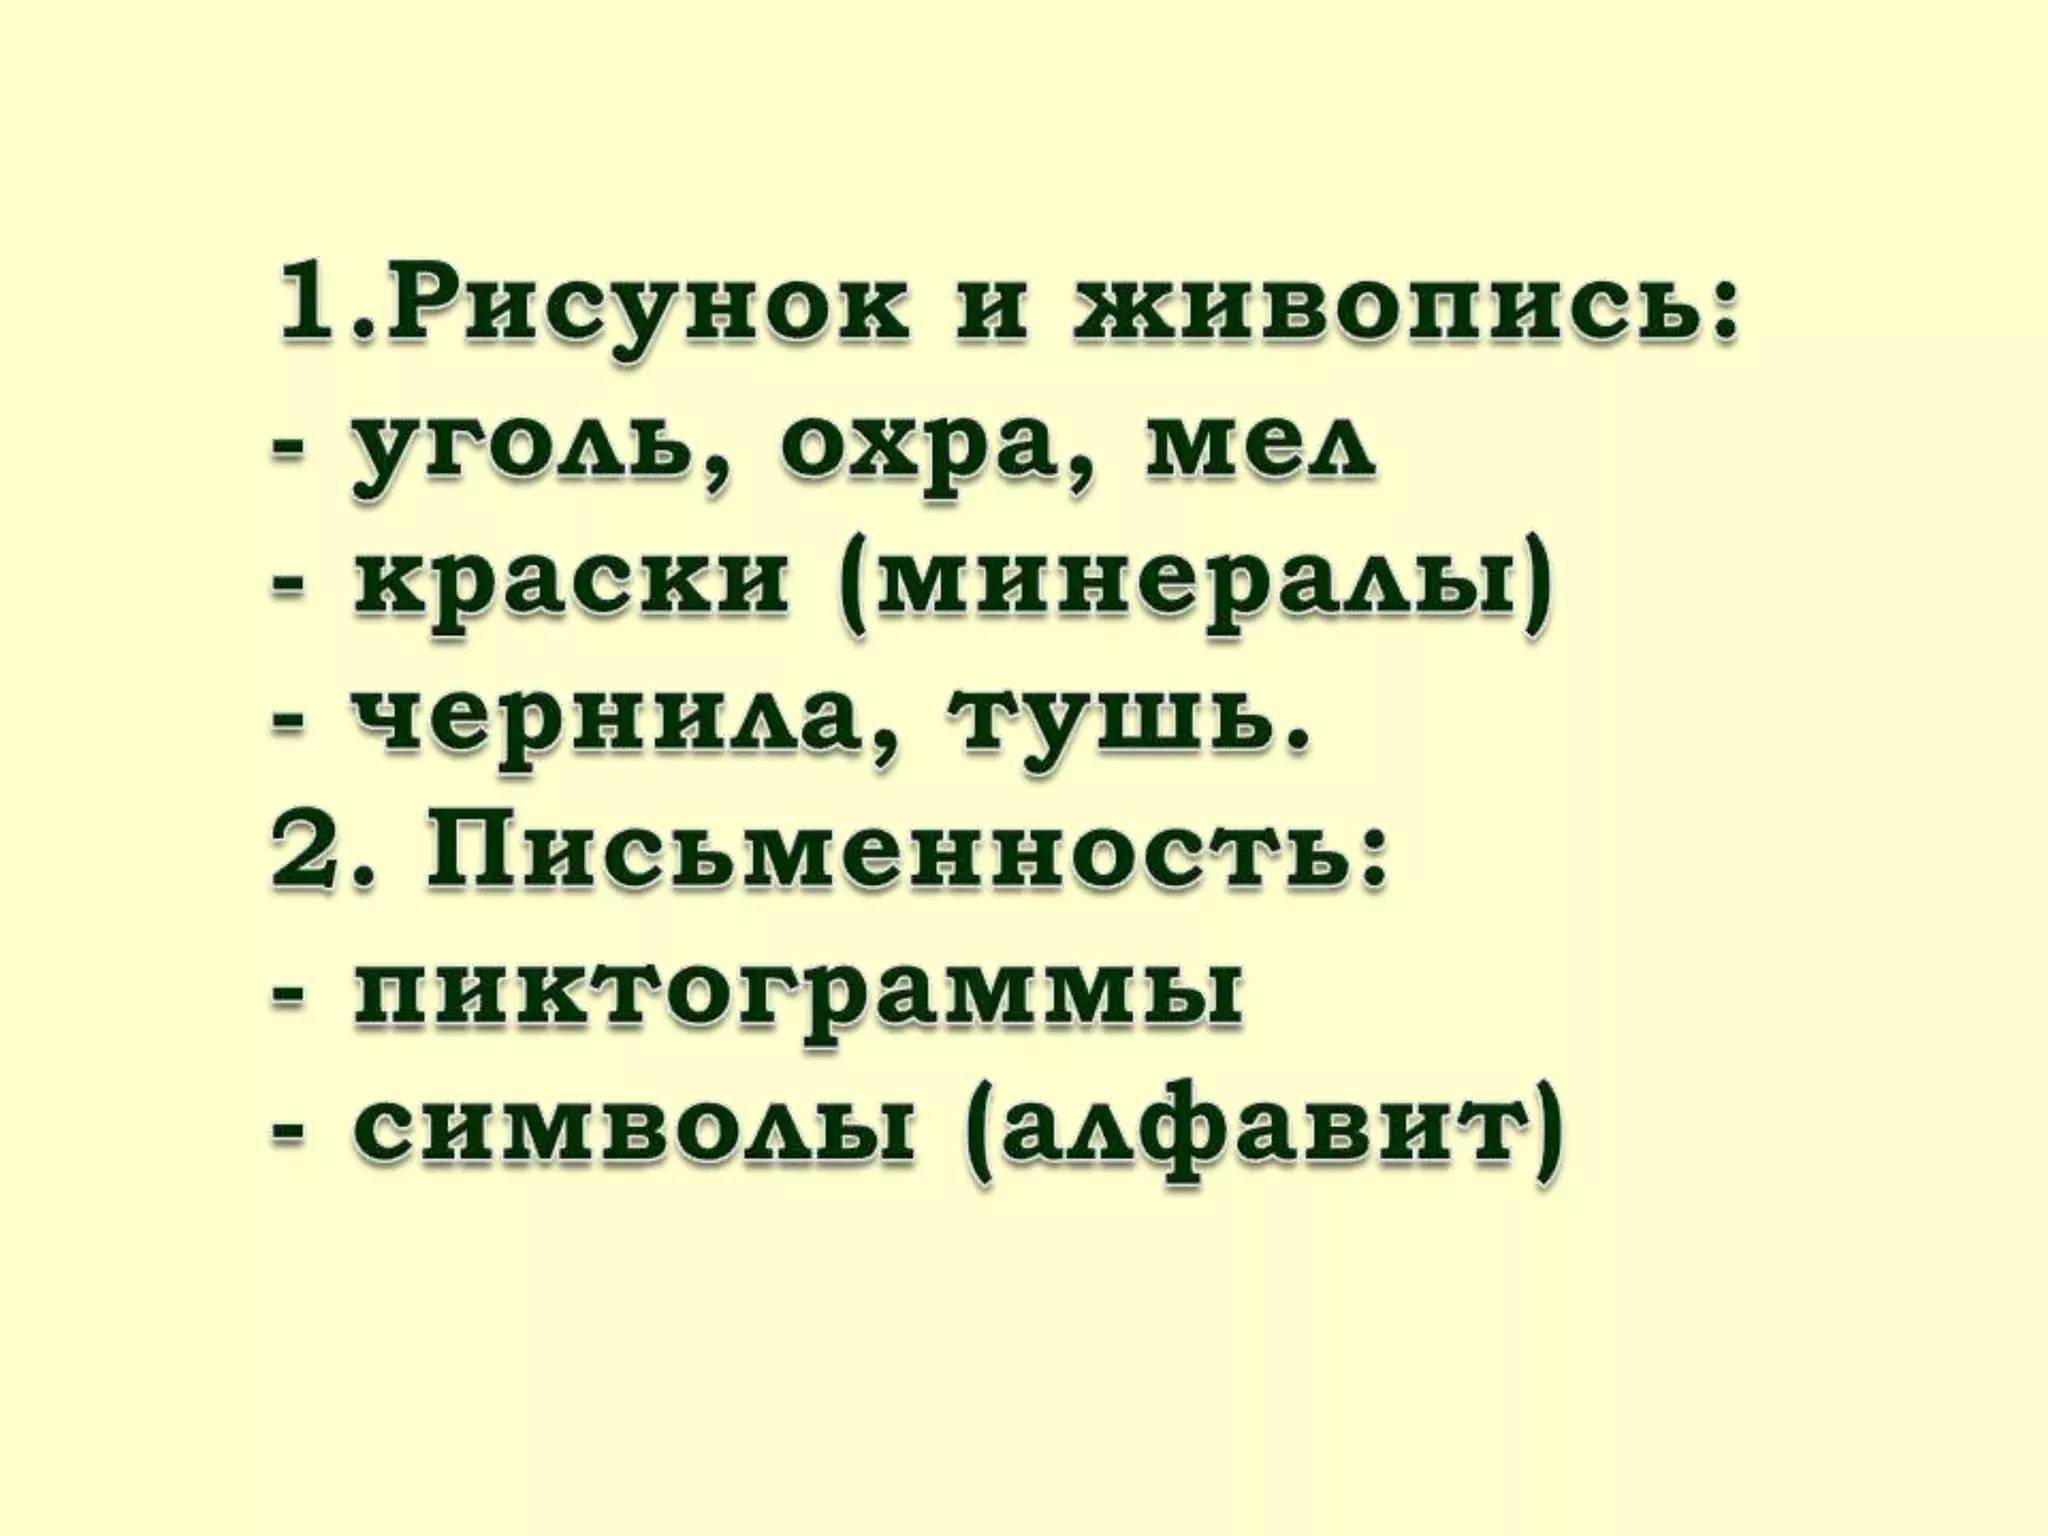
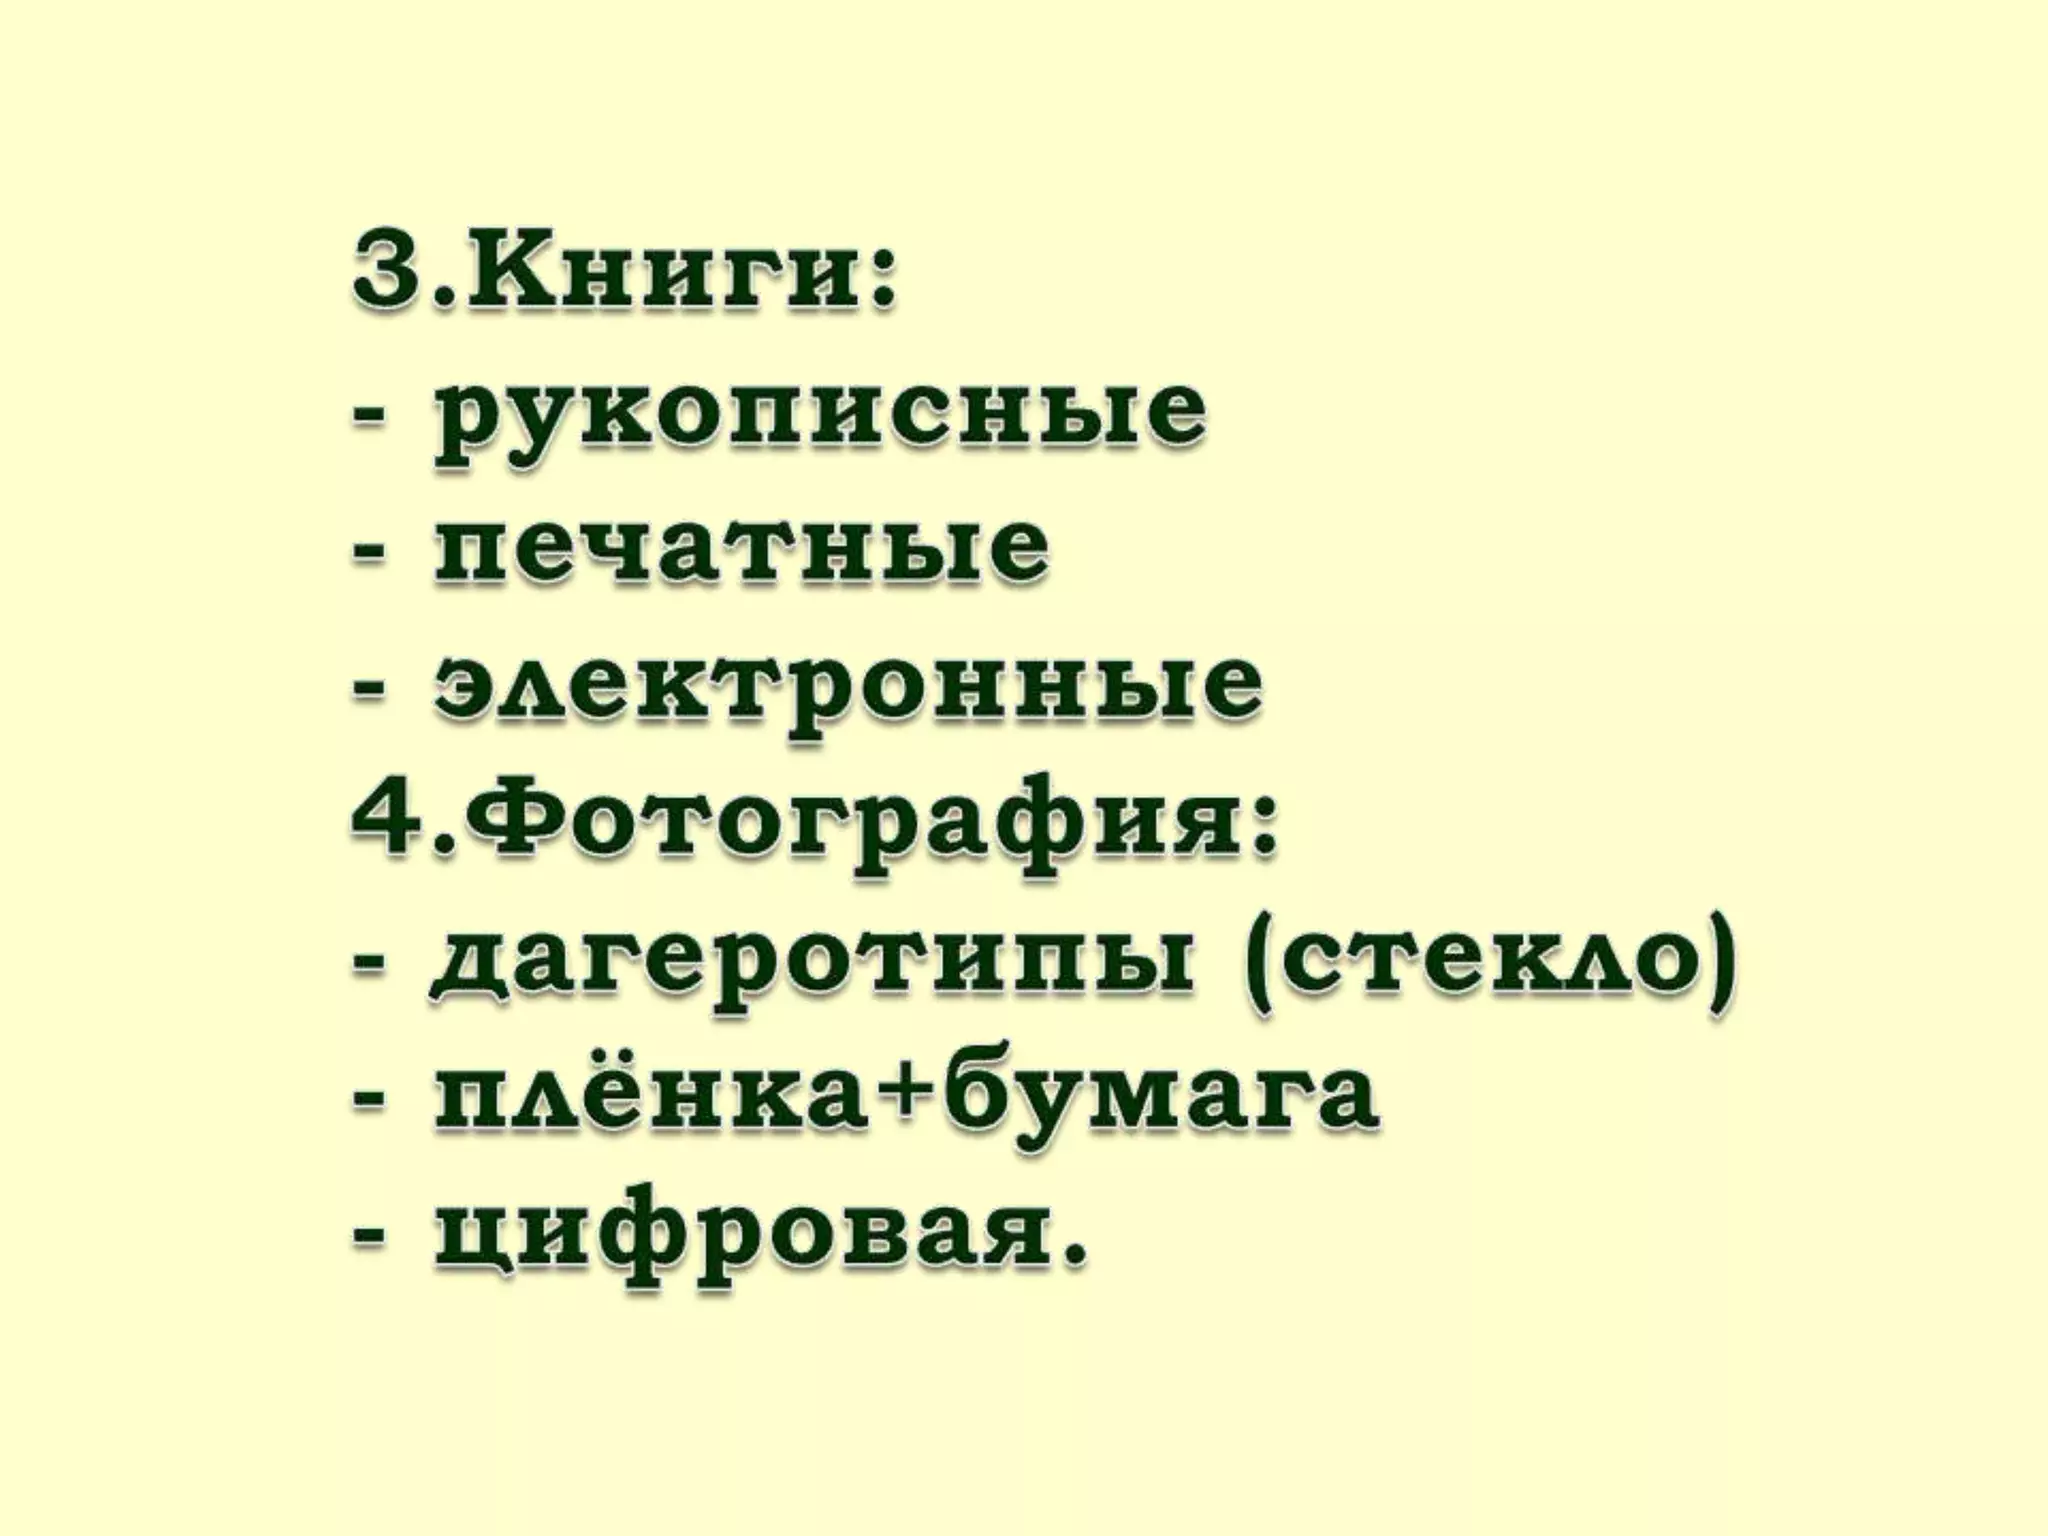
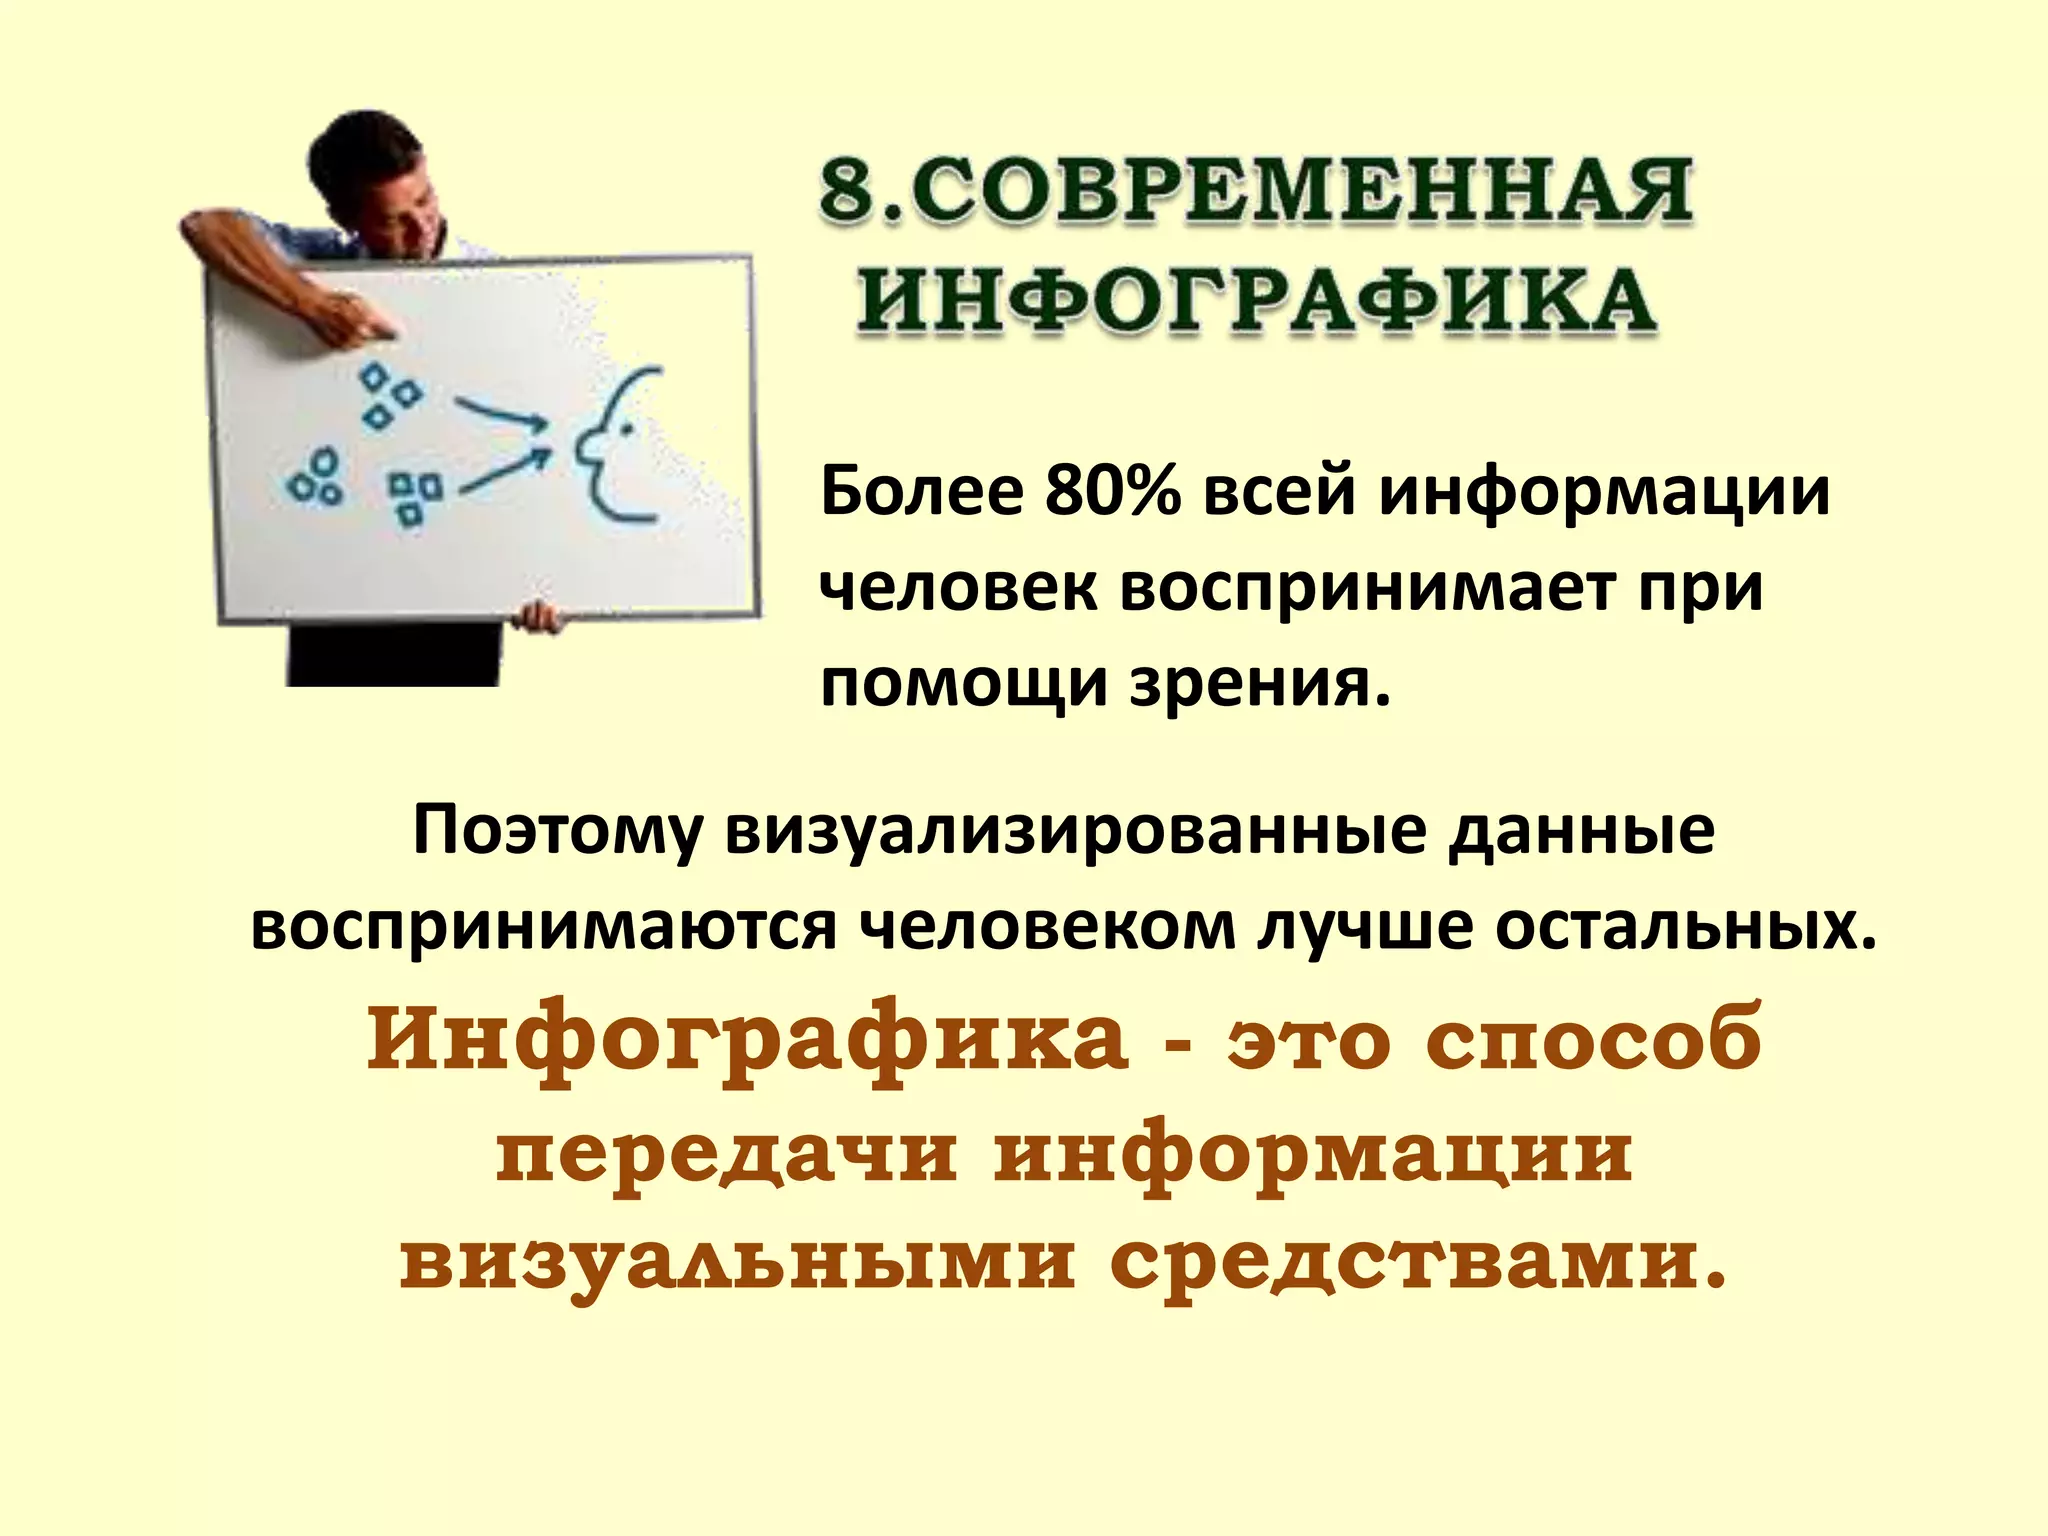


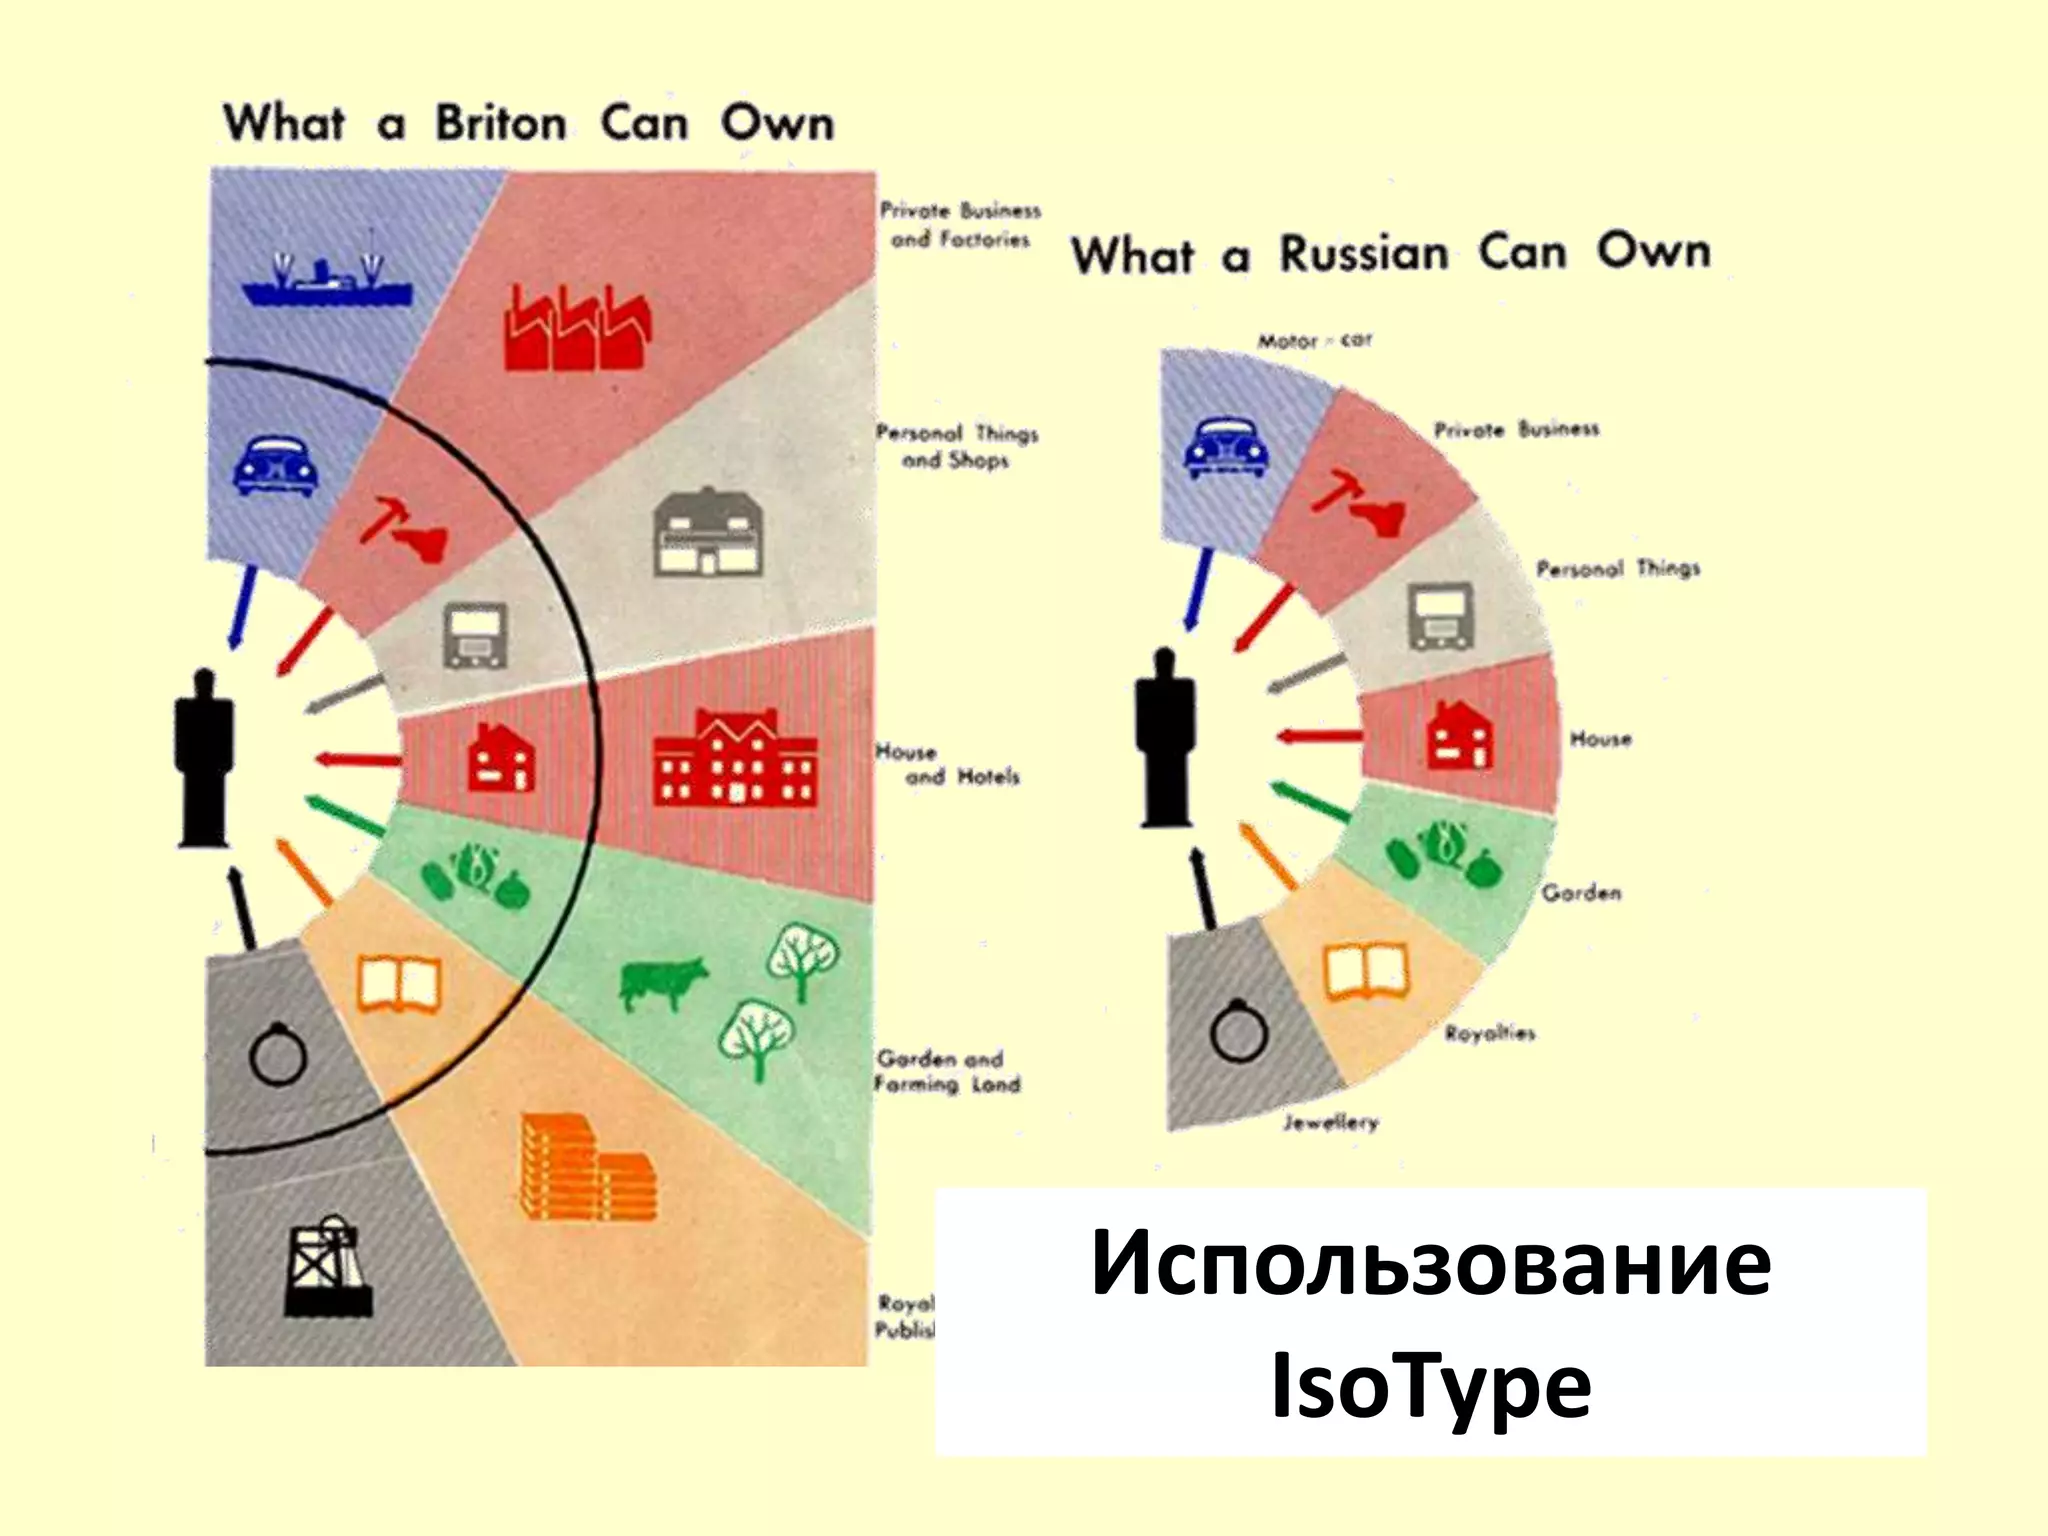
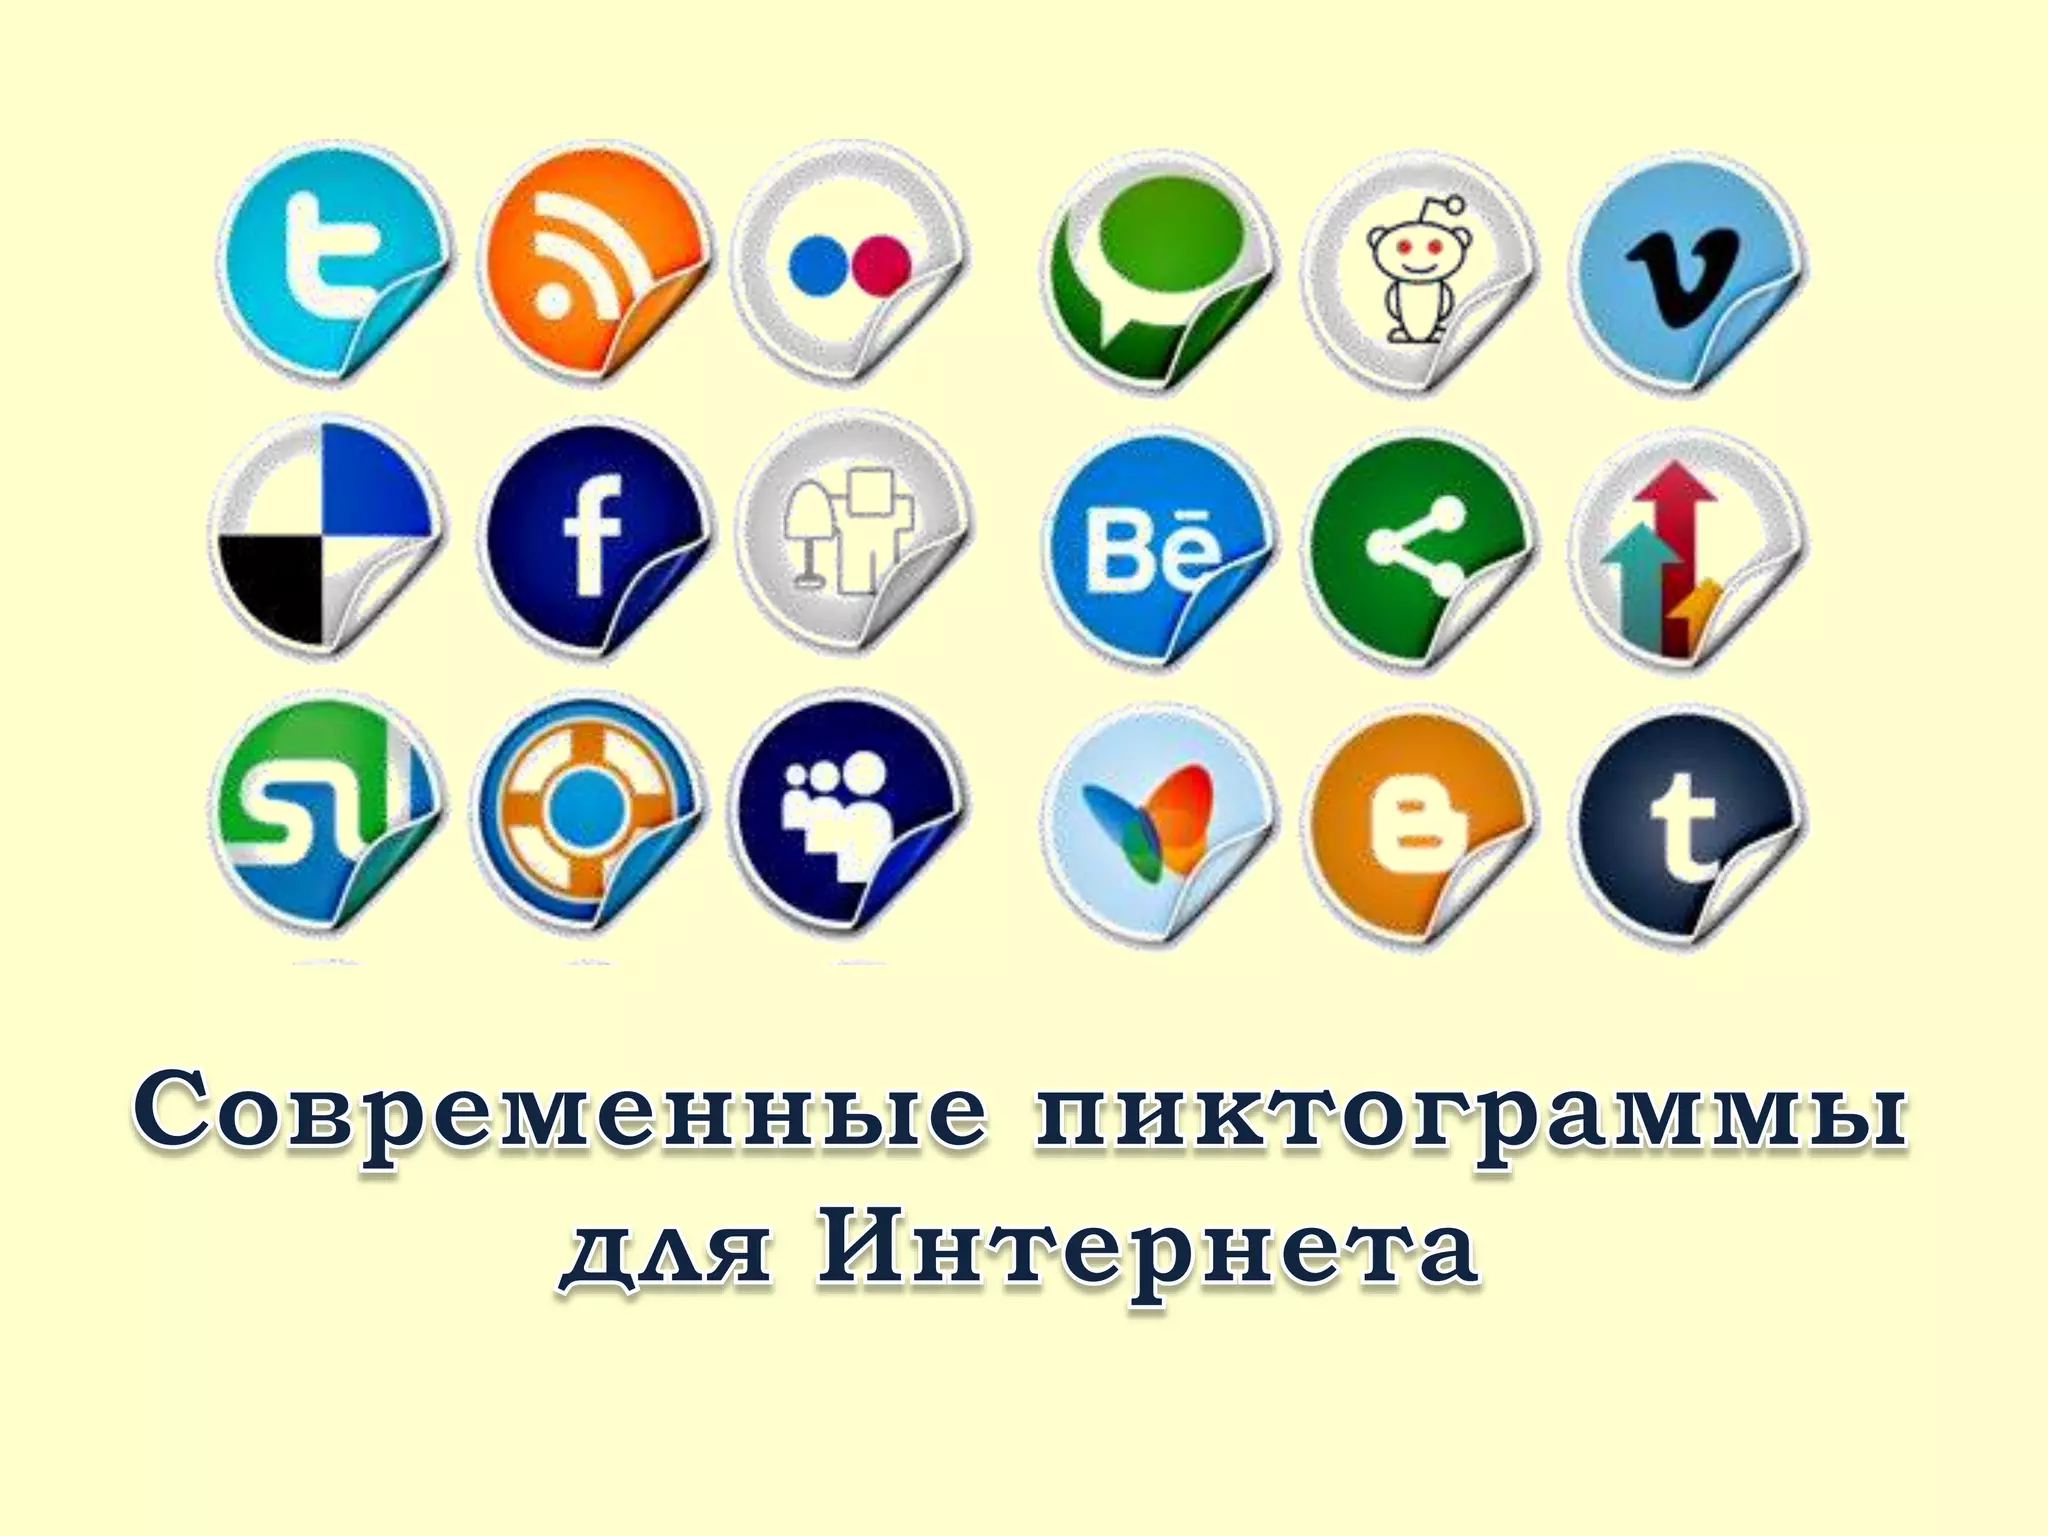
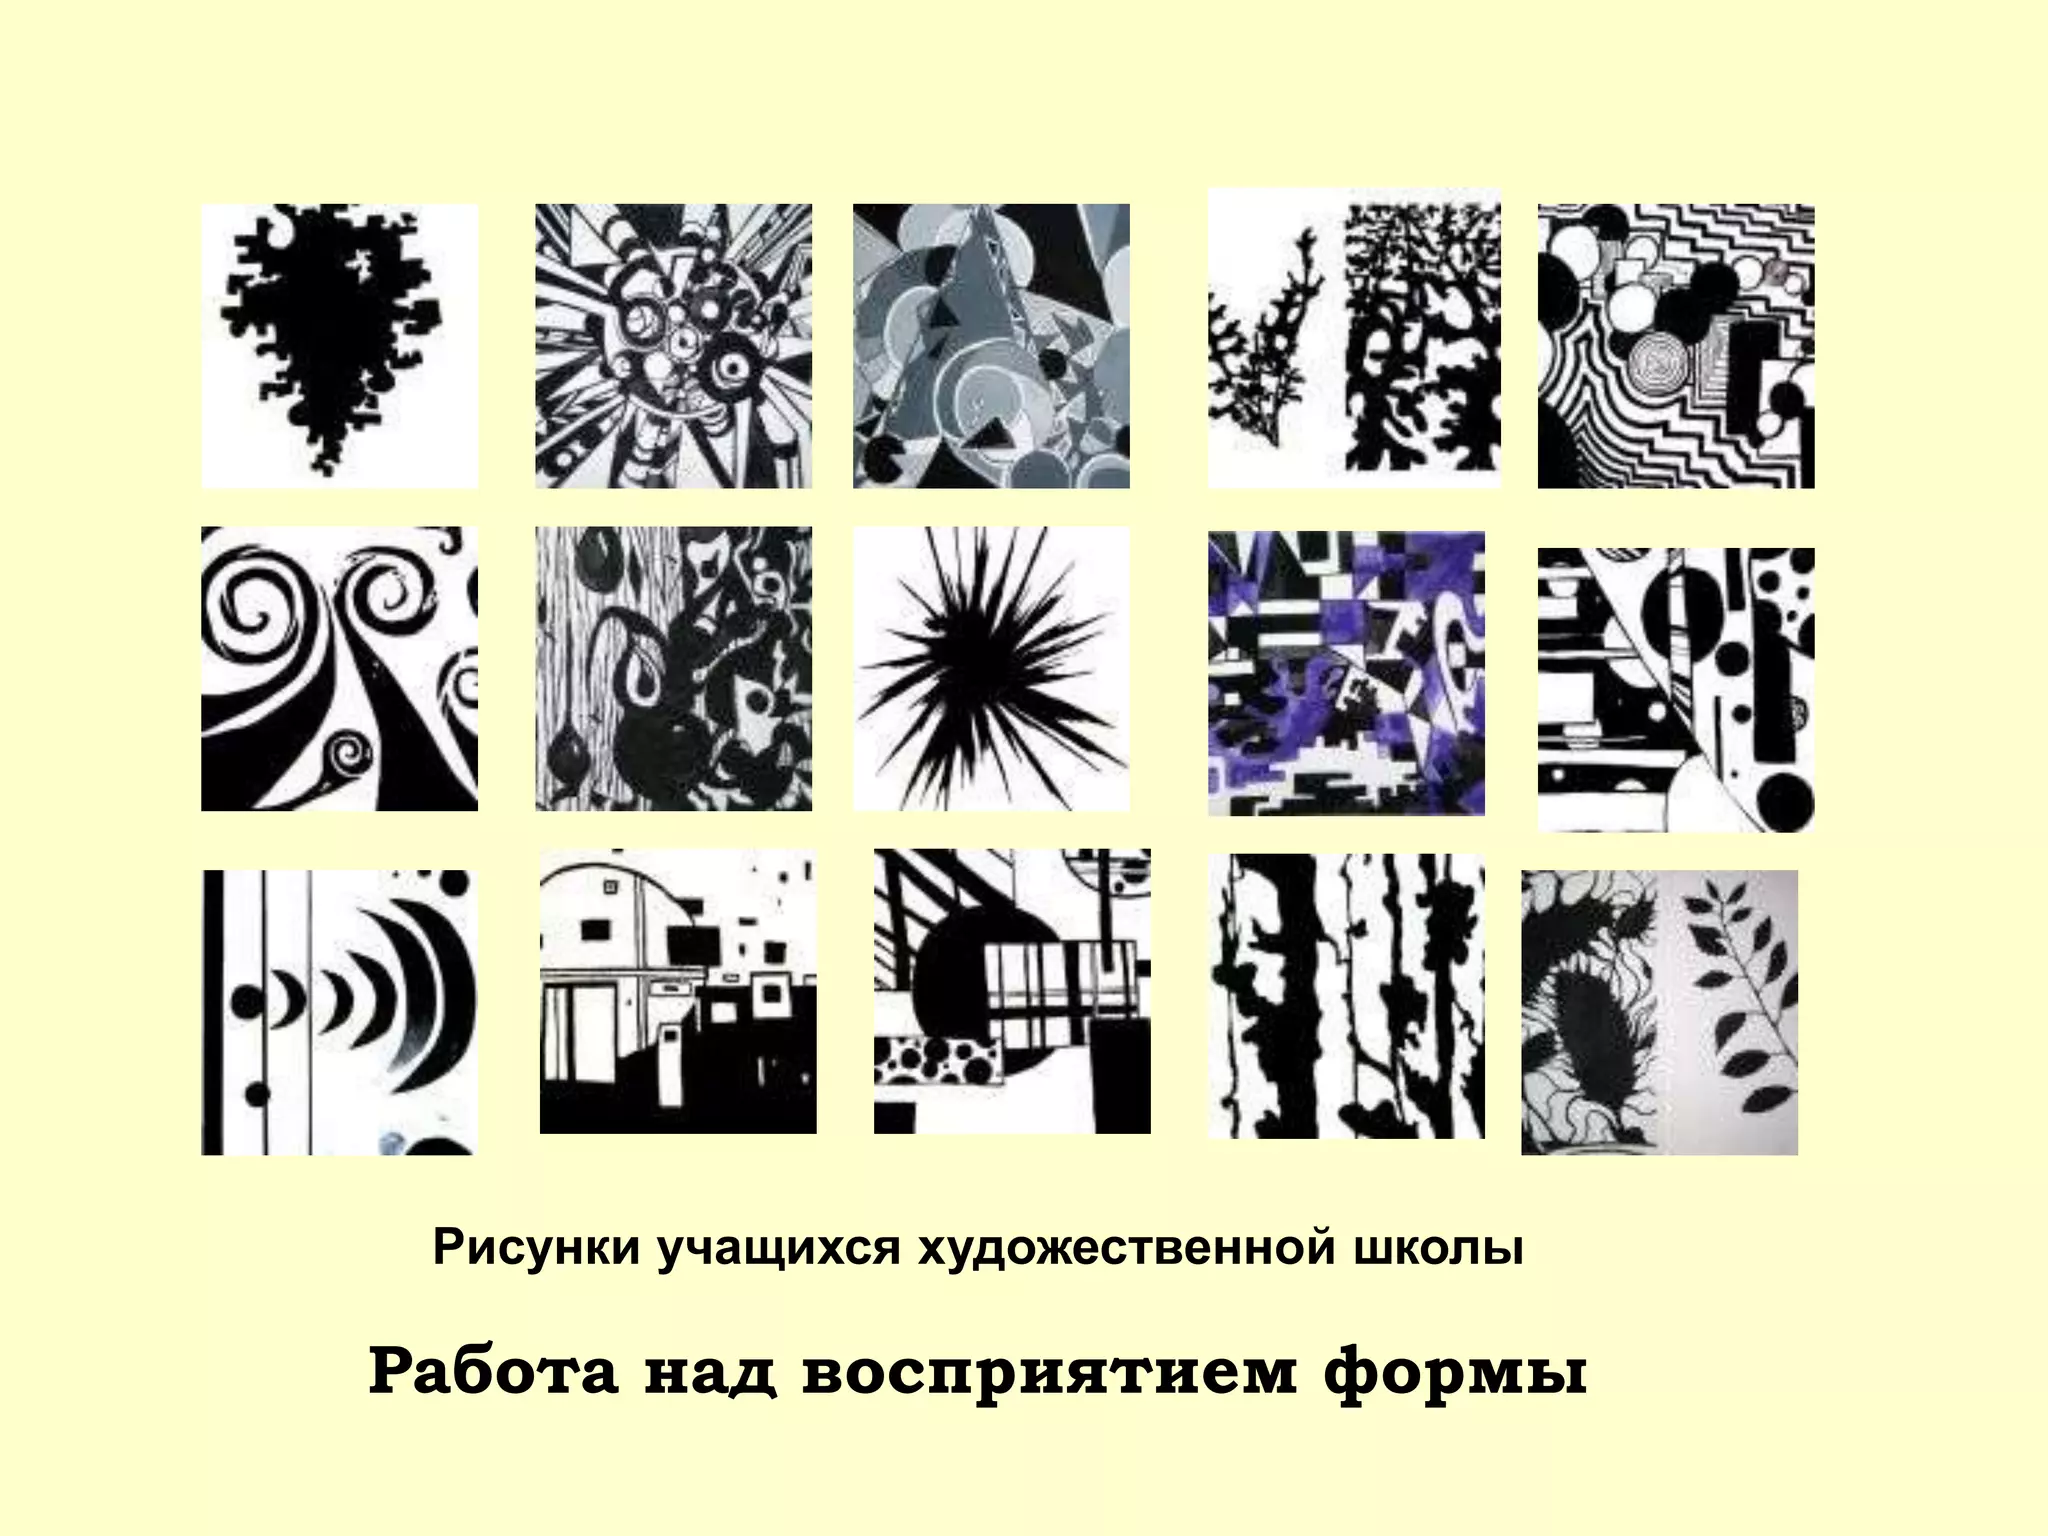
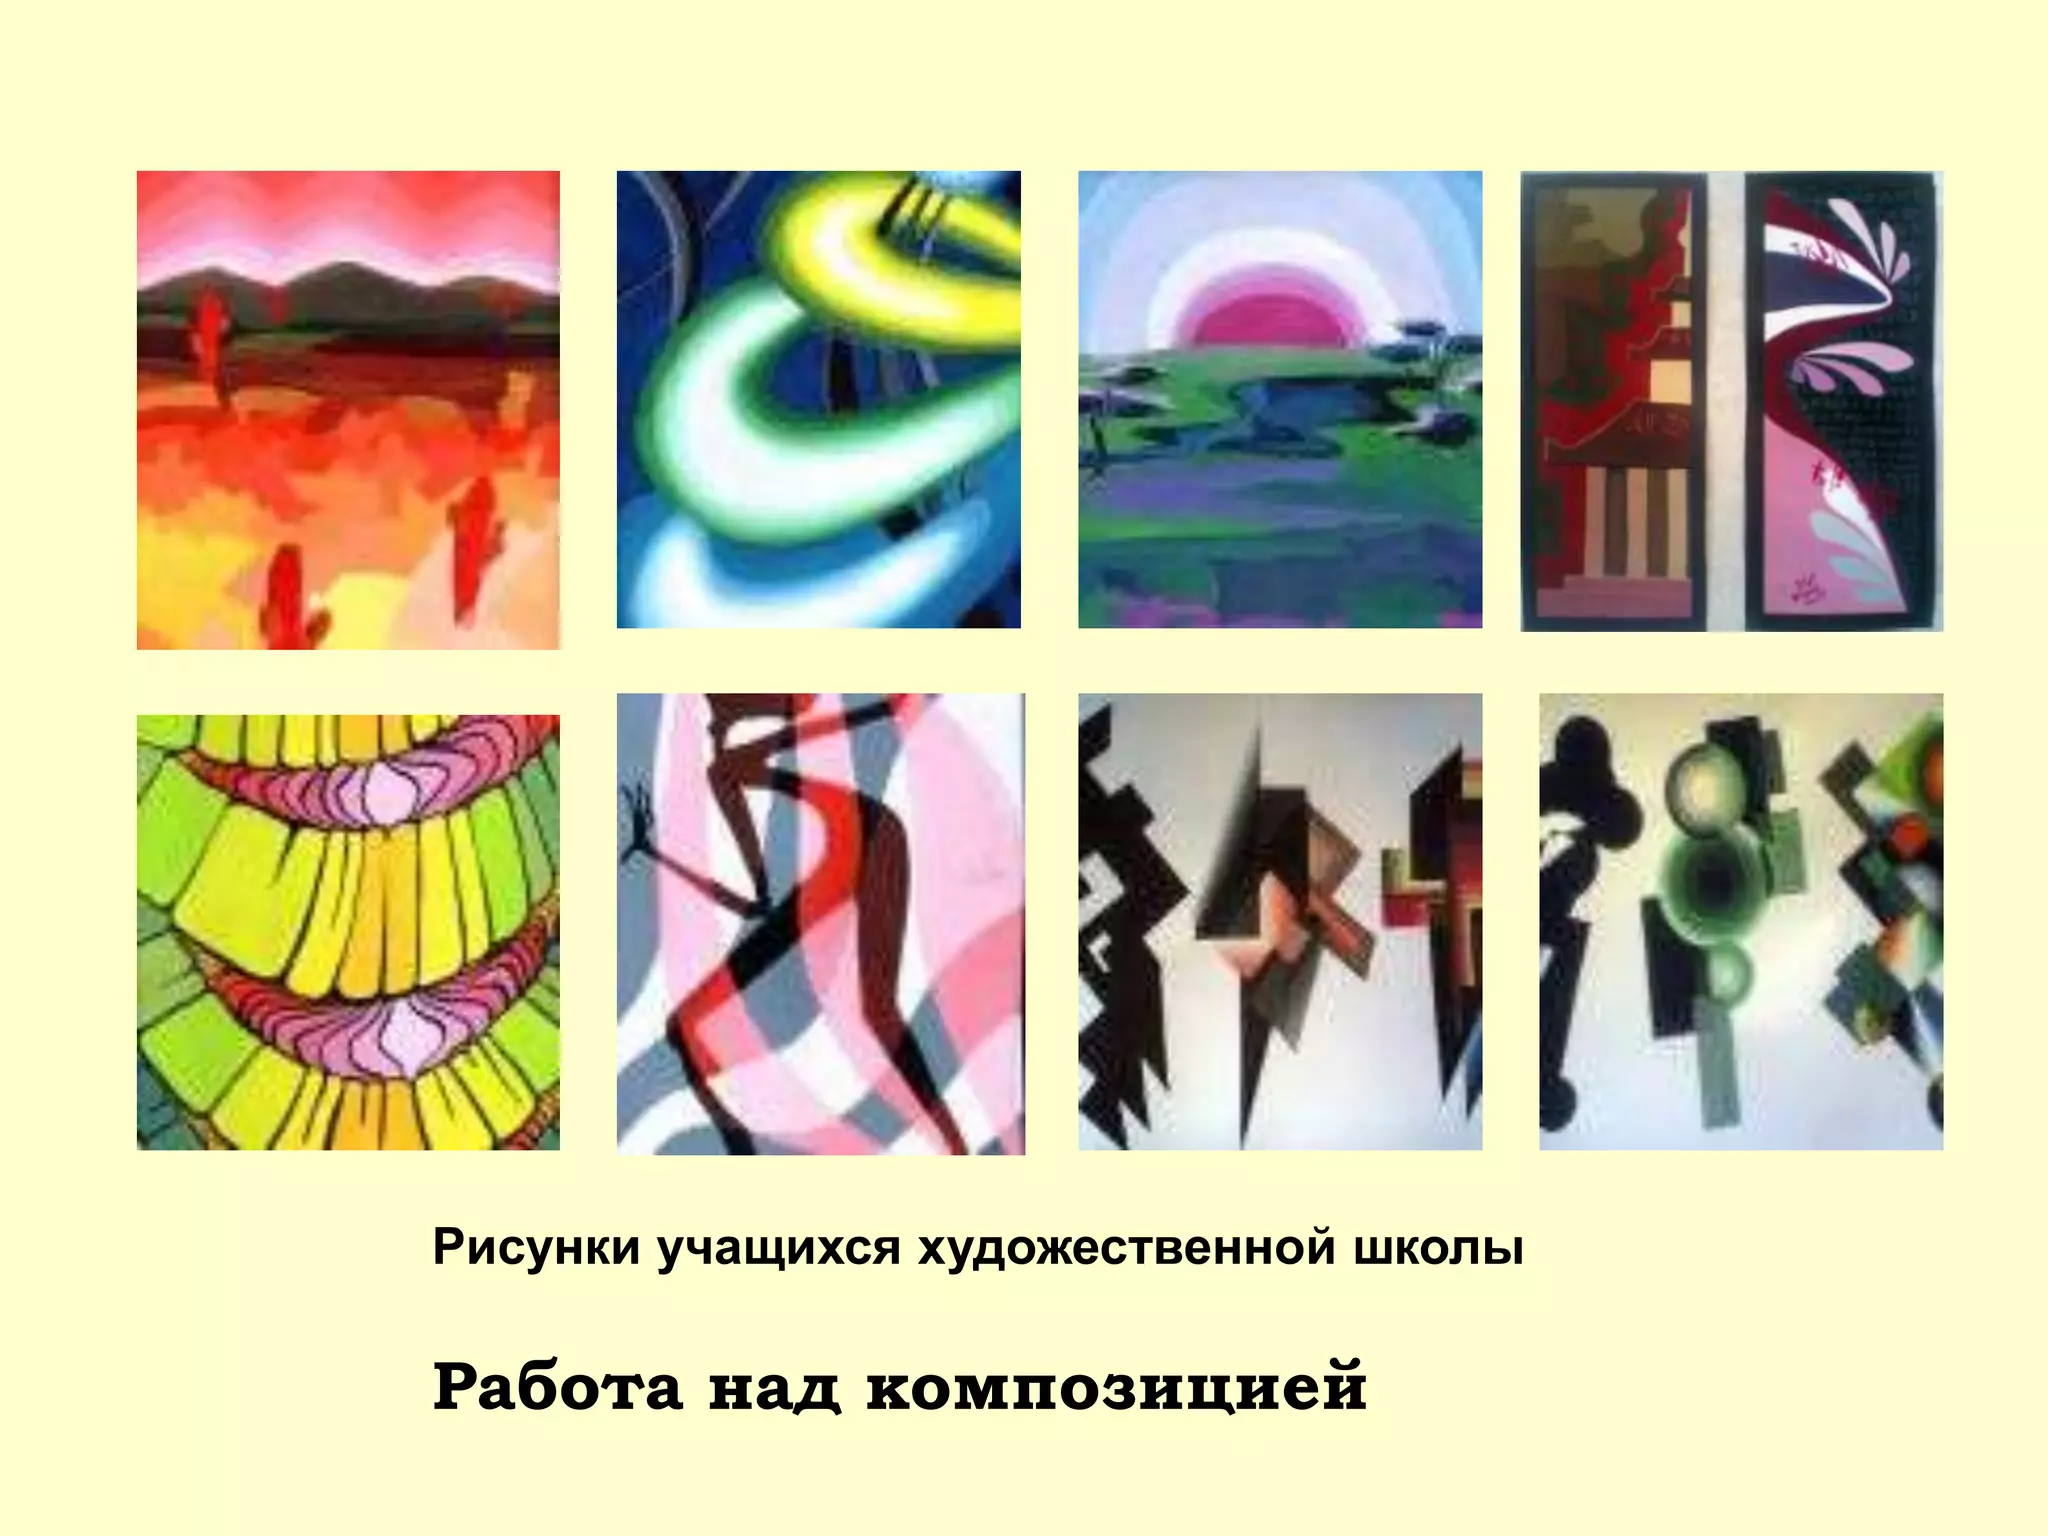

Документ рассматривает технологии компьютерной визуализации информации, включая инфографику и мультимедиа, подчеркивая важность визуальных средств для восприятия данных. Он также описывает различные материалы и технику создания художественных произведений, включая живопись и цифровое искусство, а также их влияние на написание и восприятие информации. В итоге упоминаются известные художники и их стиль, что показывает эволюцию художественного выражения в контексте визуальной коммуникации.


