2. Developmental Cognitive Neuroscience 42 (2020) 100760
2
behavioral pattern cannot be considered sufficient evidence to conclude
that infants have learned the causal relation. In order to reach this
conclusion, evidence must be presented that cannot be explained by a
mechanism unable to learn causal relations. In this study, we set out to
investigate whether 3- to 4.5-month-old infants build causal
action-effect models. Based on results of the simulation work, we
focused on the neural and behavioral response following the discontin
uation of an audiovisual action effect. We investigated the presence of a
violation of expectation, as this indicates that infants made a prediction
regarding the consequences of their movements, i.e., built an internal
model.
Three- to 4.5-month-old infants were tested in a computerized
version of the mobile-paradigm in which movement of one of the in
fant’s limbs causes an audiovisual effect (Rovee and Rovee, 1969). In
fants were seated in a car seat in front of a computer screen during three
phases of the experiment. During the first phase (‘baseline’), they were
presented with a static visual display. During the second phase (‘con
nect’), infants’ arm movements triggered an audiovisual animation.
During the third phase (‘disconnect’), the action-effect contingency was
discontinued, and infants again saw only the static display. We analyzed
movement frequency patterns over the three phases as well as the
mismatch negativity (MMN) event-related potential (ERP) in the elec
troencephalogram (EEG) data. EEG has previously been used to study
infants’ neural body maps, that is, the development of somatotopic
representations in the brain (e.g., Saby et al., 2015; Meltzoff et al.,
2019), but has not yet been extended to the context of the sense of
agency in early infancy.
In line with previous empirical findings (Heathcock et al., 2004;
Rovee and Rovee, 1969; Rovee-Collier et al., 1978; Watanabe and Taga,
2006, 2011), we expected to see an increase in movement frequency
during the connect phase as an indication that the infants detected the
contingency. In contrast to earlier research, we were especially inter
ested in the neural and behavioral response following the cessation of
the audiovisual effect — if infants had built expectations about the
causal relation between their movements and the audiovisual effect, we
expected to find evidence for a violation of expectation (an MMN) in the
EEG data upon movement during the disconnect phase compared to the
baseline phase. The input was identical for both these phases (i.e., a
static picture) but in contrast to the baseline phase, the disconnect phase
was preceded by a learning phase (the connect phase). Furthermore,
during the disconnect phase, infants were expected to initially increase
their movement frequency to gather information about the new state of
the world and update their model, then decrease the movement fre
quency once more once the infants’ internal model updated anew (i.e.,
an extinction burst).
2. Methods
2.1. Open research practices
The anonymized raw and preprocessed data as well as the experi
ment can be obtained here: http://hdl.handle.net/11633/aabrg7pr.
2.2. Participants
Sixty-five full-term infants (MAge ¼ 115.06 days, SDAge ¼ 12.47; 29
male) were tested in the Baby EEG Lab at the Donders Centre for
Cognitive Neuroimaging (DCCN), Nijmegen. Parents gave written con
sent. Participation was rewarded with age-appropriate books or mone
tary compensation. Ethical approval for the project was granted by the
regional medical ethical committee, Commissie Mensgebonden Onder
zoek (CMO) regio Arnhem-Nijmegen (NL39352.091.12, CMO 2012/
012).
2.3. Materials
2.3.1. Apparatus
Movement and EEG data were recorded concurrently. Four acceler
ometer bracelets were attached to the infants’ limbs. The triggering
bracelet that controlled the audiovisual effect was fastened around one
of the wrists (counterbalanced across participants). EEG was recorded
from 32 active Ag/AgCl electrodes referenced online to the left mastoid
(TP9), using infant-sized caps (ActiCAP) following the international
10–20 system. Data were sampled with a Brain Amp DC amplifier via
Brain Vision Recorder Software (Brain Products GmbH, Germany) with a
sampling frequency of 500 Hz.
2.3.2. Stimuli
Infants were presented with a colorful image of a mobile toy against a
black background on a computer screen. During the baseline and
disconnect phases, the image remained static on the screen. In the
connect phase, an animated version of the mobile toy with a simulta
neous bell-like auditory stimulus was triggered upon movement of the
infant’s trigger arm. The animation lasted 650 ms and was assembled
from 44 rotated versions of the static image (ranging between -10
�and
10
�
) using the visual processing software Virtual Dub 1.10.4. The stimuli
were presented via Presentation software (Neurobehavioral Systems;
http://www.neurobs.com/).
2.4. Design and procedure
After briefing the parent(s), infant was capped and electrode im
pedances were checked in an experimental room designed to minimize
external noise and electromagnetic interference. To mitigate parental
interference while at the same time maintaining the infants’ proximity
to their parent, the infant was placed in a baby car seat (Maxi-Cosi) on
the parent’s lap, approximately 50 cm away from a computer screen.
The parent was instructed to remain passive throughout the task. The
four accelerometers were secured around the infant’s wrists and ankles.
Once the infant accommodated to this set-up, the experiment was
initiated. The image of a mobile toy was presented across the three
phases in a fixed, uninterrupted sequence – baseline, connect, and
disconnect. During the baseline and disconnect phases (2 min each), the
image was static. In the connect phase (3.5 min), movement of the
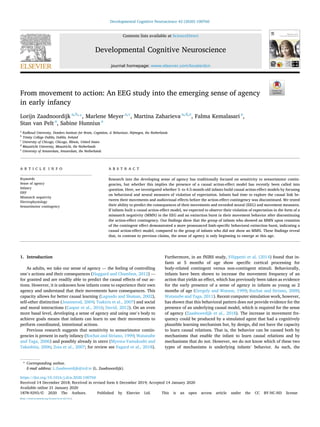
trigger arm elicited the audiovisual effect (Fig. 1).
The experiment ended after the three phases had elapsed or if the
infant repeatedly showed signs of fussiness or discomfort. The parents
were then debriefed and compensated. A complete experiment lasted
7.5 min and a full testing session lasted approximately an hour.
2.5. Data acquisition
2.5.1. Movement frequency recordings
Movement was registered for each limb whenever the change in the
limb’s velocity exceeded a threshold value that was kept constant across
infants. The threshold’s sensitivity level was based on pilot data and was
adjusted as to minimize the measurement noise resulting from head or
torso movements, yet allowing infants in this age group to easily set off
the audiovisual effect. Above-threshold movements were logged as
count data at 20 Hz.
2.5.2. EEG recordings
Data were sampled at 500 Hz, applying 0.016 Hz high-pass and 125
Hz low-pass filters online. We strived to keep the impedances below
50kƱ. Because infants were lying in the baby seat, we were often unable
to obtain clean signals from the occipital and parietal sites, making an
averaged reference inappropriate (Trainor et al., 2003). Relative to the
mastoids, the MMN response appears negative at frontal sites (Trainor
et al., 2001); furthermore, the identification of adult MMN responses has
shown to be more robust in mastoid-referenced data (Walker-Black and
L. Zaadnoordijk et al.
3. Developmental Cognitive Neuroscience 42 (2020) 100760
3
Stuart, 2008). Thus, the signal was re-referenced offline to the mastoid
average (TP9, TP10).
2.5.3. Video recordings
Experimental sessions were filmed to monitor the experimental
process on-site.
2.6. Data preparation and analyses
Behavioral data were pre-processed in Excel (Microsoft Office Pro
fessional Plus 2013). Statistical analyses were performed using IBM SPSS
Statistics, Version 21.0. EEG data pre-processing and analyses were done
using the open-source Matlab toolbox Fieldtrip (Donders Institute for
Brain, Cognition, and Behavior; http://www.fieldtriptoolbox.org/,
Oostenveld et al., 2011).
2.6.1. Movement frequency data
The experiment was segmented into 45 time bins by computing the
movement frequency over 10-second intervals. We opted for this time-
scale because treating repeated measures as a continuous outcome in
creases the chances of detecting growth effects (Kwok et al., 2008), such
as the linear and quadratic trends we were primarily interested in.
Moreover, the finer-grained the scale, the more data points can be pre
served per infant. All infants who completed the connect phase were
included in the analyses; at this cut-off point a participant’s behavioral
response pattern could offer a meaningful contribution to the parameter
estimation.
The behavioral data were modeled using multilevel time series an
alyses, which is an especially suitable technique for hierarchical data
structures, such as movement series nested within infants (Vossen et al.,
2011). Even more crucial for dealing with infant data, multilevel ana
lyses rely on likelihood-based estimations and thus can handle missing
data without requiring list-wise deletion, resulting in a considerable
power gain (Kwok et al., 2008; Vossen et al., 2011). The choice of
multilevel modeling was further motivated by the observed
variance-component coefficient (VCC) of 0.41, indicating that almost
half of the variability in movement frequency over time was found at the
between-individual level.
To distinguish between the within-infant and between-infant dif
ferences in outcome trajectories over time, a multilevel model partitions
the variance into a fixed and a random component. Fixed effects esti
mate a single population parameter (e.g., the mean movement frequency
at baseline), whereas random effects describe the random probability
distribution around that fixed effect for each infant (e.g., the variance of
the baseline movement frequency) (Curran et al., 2010). The appro
priate modeling of the random part is beneficial to the valid estimation
of the fixed model part (Jacqmin-Gadda et al., 2007), as well as quan
tifying the descriptive quality of the model by estimating the amount of
variation at each level that is still unexplained after taking into account
the specified model.
In the fixed model parts, we introduced 1) dummy predictors to
assess the main effect of each phase, and 2) time by phase interaction
terms testing for linear and quadratic trends during each phase. All
predictors were centered with respect to the arithmetic mean prior to
computing the quadratic terms and were therefore orthogonal.
In all of our models, the random part combined a random intercept to
capture the residual between-subject variation in movement frequency
with an Autoregressive Moving Average Error (ARMA(1,1)) to model the
within-subject residual variation over time. ARMA(1,1) matches the
autoregressive structure inherent to most time series data as it assumes
that behavior at adjacent time points would correlate more strongly. By
allowing individual intercepts to vary randomly, the model accounts for
individual differences in movement frequency, i.e., that behavior within
the individual tends to be more similar than behavior across individuals.
ARMA(1,1) was chosen as it is the most general covariance structure for
within-subject variation that can be combined with a random intercept
and is still parsimonious in the presence of a large number of repeated
measures within individual (Nentjes et al., 2015; Vossen et al., 2011).
The first model looked at phase-specific changes in movement fre
quency over time, while allowing this change to be relative to each in
fant’s own intercept. The analytic strategy was to 1) saturate the fixed
model part, 2) remove the non-significant predictors backwards unless
that would lead to a significant deterioration in model fit or parsimony.
Predictors were pruned hierarchically (i.e., from second-order poly
nomials to main effects). As all models shared the same random part,
they were estimated using the Maximum Likelihood (ML) method in
order to be compared with Likelihood Ratio tests in terms of their model
fit to parsimony. This way, we could also evaluate the effect of imposing
constraints in the fixed part at each step. The final model was re-
estimated with the Restricted Maximum Likelihood (REML) method to
obtain the unbiased covariance estimates (Browne and Draper, 2006).
2.6.2. EEG data
Each movement of the trigger arm was considered a trial; thus, the
onset of each trial was defined by a marker sent to the EEG system upon
trigger arm movement as detected by the accelerometers. The MMN
analyses and artifact rejection were done on the frontal sites (F3, F4),
where the MMN’s morphology has shown to be most pronounced in 3- to
Fig. 1. The visual stimuli used in the three phases. A. In the baseline phase, which lasted 2 min, the static image was shown. B. In the connect phase, which lasted 3.5
min, the image wiggled, and a sound was played when the infant moved the trigger arm. C. In the disconnect phase, which lasted 2 min, the static image was
shown again.
L. Zaadnoordijk et al.
4. Developmental Cognitive Neuroscience 42 (2020) 100760
4
4-month-olds (He et al., 2007; Trainor et al., 2003). A 0.5–20 Hz
bandpass filter was applied and the mean signal of each trial was sub
tracted from the data. The continuous output was segmented into
600-ms movement-locked epochs, including a 100-ms pre-movement
baseline (henceforth PMB to disambiguate the pre-movement EEG
baseline from the experiment’s baseline phase); correction was set at the
mean amplitude over the PMB. High-amplitude artifacts were rejected
manually; as a general rule of thumb, trials with measured activity
exceeding 50μV during the PMB and 150μV during the epoch were
rejected.
All individual datasets with at least five artifact-free trials in the
baseline and in the disconnect phase entered the analysis. 16 out of 22
infants had more than 20 trials for each phase, and apart from one infant
who had eight artifact-free trials for one phase, all participants
contributed at least 10 trials per phase. Baseline and disconnect trials
were averaged separately across participants. To form difference waves,
the averaged disconnect phase waveforms were subtracted from the
averaged baseline phase waveforms. The mean amplitudes for the 200-
350-ms window, within which we expected the MMN-response (Basirat
et al., 2014; Trainor et al., 2003), were derived from the averaged signal
over 20-ms data segments. A one-tailed paired t-test checked for wave
form differences between the two phases.
To rule out the alternative of the group-level result being caused by
the averaging of two distinct ERP morphologies as reported by Trainor
and colleagues (2003), infants’ MMN responses were classified either in
the positive waveform group, or in the MMN group. The split was based
on the deflection of the averaged measured activity over the window of
interest. The groups were then used as a predictor in the neuro
behavioral analysis.
2.6.3. Neurobehavioral model
It was of primary interest to assess the extent to which the behavioral
patterns were consistent with the neural mismatch responses pattern.
Thus, this analysis focused only on infants from whom we had obtained
sufficient data for the EEG analysis, as well as movement frequency data.
Furthermore, we were interested in testing for movement specificity and
whether its presence can be related to the infants’ deflection of the ERP
waveform. Thus, we extended the behavioral model into a growth
model. This allowed us to assess the interaction of ERP waveform group
(positive or negative) and phase-specific behavioral patterns (Curran
et al., 2010; Kwok et al., 2008). Moreover, we assessed to what extent
the behavioral patterns were observed differentially for the trigger arm
compared to the other arm since limb specificity indicates that move
ment frequency increase is not merely caused by arousal.
3. Results
3.1. Behavioral analysis
Thirty-six infants completed the connect phase and were included in
the behavioral analysis (MAge ¼ 117.56 days, SDAge ¼ 12.18 days). An
additional 29 infants were excluded from the analysis due to excessive
crying before the end of the connect phase (21 infants), falling asleep (2
infants) or technical errors (6 infants).
Averaging the movement of all limbs, infants moved more during the
disconnect phase relative to baseline and connect phases (B ¼ 15.04, SE
¼ 2.90, t(60.774) ¼ 5.19, p < 0.001, 95 % CI [9.24, 20.84]), but the
baseline and connect phases did not differ significantly in terms of mean
movement frequency (B ¼ -1.15, SE ¼ 2.13, t(154.523) ¼ -0.54, p ¼
0.592, 95 % CI [-5.35, 3.06]). During the connect phase, infants
responded to the contingent effect by linearly increasing their overall
movements (B ¼ 0.65, SE ¼ 0.19, t(206.5) ¼ 3.45, p ¼ 0.001, 95 % CI
[-0.28, 1.02]). However, the infants’ behavioral response to the absence
of the audiovisual effect did not follow the predicted quadratic trend in
the disconnect phase (B ¼. 12, SE ¼ 0.09, t(382.82) ¼ 1.29, p ¼
0.20), suggesting no evidence for a group-level extinction burst. These
findings match the results obtained when re-running the analysis with
limb specificity (trigger arm versus contralateral arm) as additional
factor. Limb specific behavior would indicate that increased movement
frequency is not caused by mere arousal. In the limb-specificity analysis,
an additional marginally significant difference in mean movement fre
quency during the connect phase was found for the trigger arm
compared to the contralateral arm (B ¼ 0.67, SE ¼ 0.34, t(1936.62) ¼
1.95, p ¼ 0.051, 95 % CI [-1.35, 0.00]). However, the corresponding
random effect was also significant, indicating substantial variation
across infants’ response patterns. See Fig. 2 for the movement frequency
patterns.
3.2. ERP analysis
Twenty-two infants had sufficient data for the ERP analysis (see
Methods for criteria; MAge ¼ 116.68 days, SDAge ¼ 14.52). The total
number of artifact-free trials was 956 during the baseline phase (MTrials
¼ 43.45, SD ¼ 26.30) and 1193 during the disconnect phase (MTrials ¼
54.23, SD ¼ 30.99). No significant MMN component was found
200 350 ms after onset (t(21) ¼ 1.05, p ¼ 0.847, one-tailed; Fig. 3),
the expected time window for infants of this age (latency based on
Basirat et al., 2014; Trainor et al., 2003). Thus, as a group, the 3- to
4.5-month-old infants showed no evidence of differential neural pro
cessing during the disconnect and baseline phases.
However, although the exact biological or cognitive causes are not
yet known, infant ERPs have been shown to undergo changes during
development, such as decreases in latency (de Haan, 2013) and increases
in amplitude (e.g., sensory-evoked potentials like N1 and P1; Wunder
lich and Cone-Wesson, 2006). Also, previous research suggests that,
especially in the first months of life, the direction of ERP deflections can
change due to brain maturation (de Haan, 2013; Thierry, 2005).
Importantly, Trainor and colleagues showed that infants between 2 and
6 months of age transition from showing a positive waveform to an
adult-like negative MMN in a mismatch paradigm (Trainor et al., 2003).
Based on these findings, we explored whether our sample consisted of
some infants showing a negative and some infants showing a positive
deflection, leading to the appearance of no MMN overall. Following
Trainor and colleagues (2003), we split our sample into two groups
based on the mean amplitude of the difference wave in the time window
of interest (see Fig. 4A and Fig. 4B). The mismatch negativity subgroup
consisted of ten infants (MAge ¼ 113.40 days, SD ¼ 13.95), yielding 460
artifact-free trials during the baseline phase (MTrials ¼ 46.00, SD ¼
26.19) versus 494 trials in the disconnect phase (MTrials ¼ 49.40, SD ¼
28.54). The positive waveform subgroup included twelve infants (MAge
¼ 119.417 days, SD ¼ 15.01), with 496 baseline trials (MTrials ¼ 46, SD ¼
26.19) and 699 disconnect trials (MTrials ¼ 58.25, SD ¼ 33.58). The
average ERP of the mismatch negativity subgroup showed a clear MMN
morphology, whereas the positive waveform subgroup exhibited no
clear ERP. The two subgroups did not differ in age (t ¼ 0.966, p ¼ 0.346).
We did not perform any statistical tests on the resulting waveforms after
splitting the groups to avoid circular statistical analysis. Instead, we
re-analyzed the behavioral data using the ERP group as a predictor, as
described below.
3.3. Neurobehavioral analysis
After finding two mismatch response profiles in the electrophysio
logical data, we were specifically interested in testing whether these two
subgroups showed any differences in their movement patterns. In
particular, we investigated differences in the movement patterns be
tween trigger arm and contralateral arm. To estimate potential differ
ences between the subgroups, we tested for cross-level interactions in a
model with ERP deflection predicting movement pattern and limb
specificity.
The mean movement frequency per arm in the connect (B ¼ 2.46, SE
¼ 0.70, t(1154.72) ¼ 3.52, p < 0.001, 95 % CI [1.09, 3.83]) and
L. Zaadnoordijk et al.
5. Developmental Cognitive Neuroscience 42 (2020) 100760
5
disconnect (B ¼ 5.45, SE ¼ 0.96, t(1157.44) ¼ 5.71, p < 0.001, 95 % CI
[3.57, 7.32]) phases was conditional on the deflection of the mismatch
response, such that the trigger arm moved more frequently than the
contralateral in the mismatch negativity relative to the positive wave
form group. The difference per arm in the shape of the extinction burst
during the disconnect phase was also conditional on the deflection of the
mismatch response (B ¼ 0.26, SE ¼ 0.06, t(1248.13) ¼ 4.32, p < 0.001,
95 % CI [0.14, 0.39]); that is, the movement of the trigger arm followed
a more pronounced limb-specific extinction burst relative to that of the
contralateral arm in the mismatch negativity compared to the positive
waveform group (Fig. 4). Crucially, there was no significant difference
between the groups regarding the linear increase during the connect
phase (B ¼ 0.24, SE ¼ 0.12, t(1183.76) ¼ -0.21, p ¼ 0.836, 95 % CI
[ 0.25, 0.20]).
3.4. Exploratory analyses
The difference between the groups in number of movements in the
connect phase could potentially be an explanation for the group differ
ences in the disconnect phase. A Pearson correlation between the
number of movements in the connect phase and the mean amplitude of
the difference wave between the baseline and disconnect phase (by
which the groups were determined) revealed no significant effect (r ¼
0.120, p ¼ 0.595), indicating that number of movements by itself could
not explain our group differences. Since the positive waveform group
still moved on average 152 times in the connect phase, it seems they had
ample learning opportunity.
We chose an audiovisual effect to maximize infants’ processing of the
auditory stimulus (Hyde et al., 2010) while at the same time providing
infants with sufficient information to extract the action-effect contin
gency without the need to look at the screen. Still, to ensure that
attention to the screen did not bias our results, we analyzed the videos of
each group. Our video analysis (in which we coded for turning away
from the screen and closed eyes for longer than a second) showed that
there was no significant difference between the two groups (t(20) ¼
1.366, p ¼ 0.187, two-tailed).
4. Discussion
In this study, we investigated whether 3- to 4.5-month-old infants
build a model of the effects of their own movements, a crucial prereq
uisite for the sense of agency. We obtained electrophysiological and
behavioral measures to inform us about infants’ action-effect models
and in particular about infants’ violation of expectation upon discon
tinuation of a sensorimotor contingency. We hypothesized that if infants
built a causal action-effect model, we would observe this in the data in
two ways: a mismatch negativity response in the electrophysiological
data, and an extinction burst, a temporary additional increase and then
decrease in movement frequency, after the effect was discontinued. We
found that only a subset of infants showed a mismatch negativity
response to a violation of expectation of the action consequences, and
thus establish the causal connection between their actions and the
consequences of their actions. Notably, these infants also had a greater
extinction burst for the arm that triggered the effect as compared to the
contralateral arm, indicating that these infants had built not only built a
causal action-effect model, but also had learned which specific limb
triggered the effect. The other infants did not show an electrophysio
logical violation of expectation. Moreover, they did not demonstrate
limb specificity during the disconnect phase. The exploratory analyses
do not provide an indication that the results are based on a difference in
learning opportunities. Rather, our results are better explained by the
sense of agency not yet being present in the positive waveform group,
causing this group of infants not to build a causal action-effect model
regardless of the learning opportunities. Therefore, we suggest that the
group differences may reflect a difference in the development of the
sense of agency. In sum, these findings suggest that not all infants were
able to build an action-effect model, and thus that the sense of agency is
still emerging in infants between 3 and 4.5 months of age.
Since infants increase their movement frequency when a movement
produces an effect, researchers have previously suggested that a sense of
Fig. 2. Movement frequency over time binned in 10-sec
ond segments. Until the disconnect phase, 36 infants are
included; the number of infants after that point are indi
cated in the figure. The average movement behavior over
all limbs is indicated in black. Additionally, the movement
behavior of each individual limb (trigger arm, contralateral
arm, and the legs ipsilateral and contralateral to the trigger
arm) is shown in the plot. Error bars, shown for the average
of all limbs and for the trigger arm, reflect one standard
error around the mean.
Fig. 3. ERP results of the MMN analysis (shaded area reflects one standard
error around the mean). We found no statistical evidence for a difference be
tween the disconnect and baseline phases in the time window of interest
(200 350 ms after trigger arm movement).
L. Zaadnoordijk et al.
6. Developmental Cognitive Neuroscience 42 (2020) 100760
6
agency is present from 2 months of age (Rochat and Striano, 1999, 2000;
Watanabe and Taga, 2006). This behavior was replicated in the current
study, as infants showed a linear increase in movement frequency in the
connect phase. Computer simulation research, however, has demon
strated that an underlying causal model cannot be inferred from this
behavioral pattern (Zaadnoordijk et al., 2018). This was why, in contrast
to previous research, our focus was on the violation of expectation, as
this indicates that infants have made a prediction regarding the conse
quences of their action and thus have built an internal model. In pre
vious work on infants’ abilities to predict the consequences of their own
actions, 10-month-olds were presented with a visual stimulus upon
pressing a button (Kenward, 2010). The infants were able to make
anticipatory fixations towards the location on the screen before they
pressed the button and the effect appeared. Building on these ideas, our
study is the first to obtain both behavior and EEG data to show that the
ability to predict the consequences of one’s actions emerges between 3
and 4.5 months of age.
Due to the developmental properties of the MMN, and in line with
previous research (Trainor et al., 2003), we split our sample based on the
mean amplitude of the EEG signal during the time window of interest.
This procedure gave us important insights into the emergence of the
sense of agency, as it revealed the underlying interactions between the
neural signal and infants’ behavior. Splitting our sample according to
the direction of deflection of the individual’s averaged measured ac
tivity may have introduced some individual misclassifications.
Crucially, however, the resulting waveforms — a global drift in the
positive waveform group and an ERP-like waveform in the mismatch
negativity subgroup — are a direct consequence of our design and not an
artifact of our analysis. The two observed waveforms are in line with the
latency and morphology reported by others studying the MMN in this
age group, who also find a split across infants in positive and negative
amplitudes (e.g., Trainor et al., 2003). Moreover, the observed neural
processing differences translated to a specific behavioral difference,
evident from the limb specificity found in the mismatch negativity but
not in the positive waveform subgroup during the extinction burst in the
disconnect phase.
It remains an open question whether the infants in the positive
waveform group did not detect that their movement caused the audio
visual effect, or whether they built an incorrect causal model (e.g., a
model in which another limb caused the effect). An additional open
question is which factors influence the development of a sense of agency.
The infants who displayed a violation of expectation and a limb specific
extinction burst may be further in their general development or may
have specific cognitive advantages. Since the sense of agency emerges in
all infants eventually, we expect that the split in neural and behavioral
data disappears and becomes similar to the MMN group as infants grow
older. Similarly, we expect that a group of much younger infants would
react more similar to the positive waveform group. Future research
could confirm or disprove these hypotheses as well as address the open
questions.
The question regarding which patterns of behavior demonstrate an
underlying causal model is not only within the purview of infant
development; animal behavior researchers also debate this topic. Com
parable to the results of computer simulation work (Zaadnoordijk et al.,
Fig. 4. The ERP waveforms per group and their corresponding behavioral movement frequency patterns (one standard error around the mean indicated by shaded
area (ERPs) and bars (behavioral data)). A. ERP waveform of the group of infants with a negative mean deflection in the time window of interest (MMN group). B.
ERP waveform of the group of infants with a positive mean deflection in the time window of interest (positive waveform group). C. Behavioral patterns of the three
phases for the MMN group. D. Behavioral patterns of the three phases for the positive waveform group.
L. Zaadnoordijk et al.
7. Developmental Cognitive Neuroscience 42 (2020) 100760
7
2018) showing that behaviors previously taken as evidence for an un
derlying causal model could be explained with a simpler model-free
mechanism, Taylor and colleagues (2014, 2015) have argued that
complex tool-use does not necessarily indicate capacity for causal
reasoning. Crows were shown to be unable to produce causal in
terventions and thus lack certain causal learning capacities, even though
the ability for causal interventions had previously been taking to un
derlie complex tool use (Taylor et al., 2014). Thus, the underlying
mechanisms of behavioral data, rather than their complexity or intuitive
explanation, provides a measure of causal model building capacities of
human and non-human populations.
In the present study, we shed light on infants’ ability to learn causal
relations between their actions and the subsequent consequences, by
complementing behavioral data with neural measures. This combination
allowed us to show that behavior alone is not sufficiently nuanced for
assessing the developing sense of agency. While we replicate previously
found behavior that has been taken as indicative of a sense of agency, the
electrophysiological data demonstrate — and thereby confirm theoret
ical research (Zaadnoordijk et al., 2018) — that this is a flawed inter
pretation. We do not find an interaction between subgroup and linear
increase in the connect phase. Since researchers in previous studies only
acquired behavioral data, it was impossible to determine whether in
fants experienced a violation of expectation when the causal connection
was manipulated. The EEG results indicate that only a subset of 3- to
4.5-month-old infants built an action-effect model, and thus that the
sense of agency is emerging but not evident for all infants in this age
group. Our findings therefore demonstrate limitations of the previous
claims about infants’ sense of agency and the evidence by which these
claims were justified. By going beyond the behavioral data, we were able
to demonstrate for the first time how infants’ movements turn into ac
tions as sense of agency emerges.
Funding
This research was supported by an Aspasia Prize of the Netherlands
Organisation for Scientific Research (NWO) awarded to Sabine Hunnius.
Declaration of Conflicting Interest
The authors have no conflicts of interest with respect to the
authorship or the publication of this article.
Acknowledgments
We thank Iris van Rooij, Thomas Rhys Marshall and Robert Oos
tenveld for their help with the design and analysis of the study. We thank
Pascal de Water for his technical help and Angela Khadar, Maaike van
Buren and Lotte Minheere for recruiting and scheduling participants. We
are grateful to all participating parents and infants.
References
Basirat, A., Dehaene, S., Dehaene-Lambertz, G., 2014. A hierarchy of cortical responses
to sequence violations in three-month-old infants. Cognition 132 (2), 137–150.
Browne, W.J., Draper, D., 2006. A comparison of Bayesian and likelihood-based methods
for fitting multilevel models. Bayesian Anal. 1 (3), 473–514.
Caspar, E.A., Christensen, J.F., Cleeremans, A., Haggard, P., 2016. Coercion changes the
sense of agency in the human brain. Curr. Biol. 26 (5), 585–592.
Curran, P.J., Obeidat, K., Losardo, D., 2010. Twelve frequently asked questions about
growth curve modeling. J. Cogn. Dev. 11 (2), 121–136.
David, N., 2012. New frontiers in the neuroscience of the sense of agency. Front. Hum.
Neurosci. 6 (161), 10–3389.
De Haan, M., 2013. Infant EEG and Event-Related Potentials. Psychology Press.
Fagard, J., Esseily, R., Jacquey, L., O’Regan, K., Somogyi, E., 2018. Fetal origin of
sensorimotor behavior. Front. Neurorobot. 12, 23.
Filippetti, M.L., Lloyd-Fox, S., Longo, M.R., Farroni, T., Johnson, M.H., 2014. Neural
mechanisms of body awareness in infants. Cereb. Cortex 25 (10), 3779–3787.
Gergely, G., Watson, J.S., 1999. Early socio-emotional development: contingency
perception and the social-biofeedback model. Early Soc. Cognit. 60, 101–136.
Haggard, P., Chambon, V., 2012. Sense of agency. Curr. Biol. 22 (10), R390–R392.
He, C., Hotson, L., Trainor, L.J., 2007. Mismatch responses to pitch changes in early
infancy. J. Cogn. Neurosci. 19 (5), 878–892.
Heathcock, J.C., Bhat, A.N., Lobo, M.A., Galloway, J., 2004. The performance of infants
born preterm and full-term in the mobile paradigm: learning and memory. Phys.
Ther. 84 (9), 808–821.
Hyde, D.C., Jones, B.L., Porter, C.L., Flom, R., 2010. Visual stimulation enhances
auditory processing in 3-month-old infants and adults. Dev. Psychobiol. 52 (2),
181–189.
Jacqmin-Gadda, H., Sibillot, S., Proust, C., Molina, J.M., Thi�
ebaut, R., 2007. Robustness
of the linear mixed model to misspecified error distribution. Comput. Stat. Data
Anal. 51 (10), 5142–5154.
Jeannerod, M., 2004. Visual and action cues contribute to the self-other distinction. Nat.
Neurosci. 7 (5), 422.
Kenward, B., 2010. 10-month-olds visually anticipate an outcome contingent on their
own action. Infancy 15 (4), 337–361.
Kwok, O., Underhill, A.T., Berry, J.W., Luo, W., Elliott, T.R., Yoon, M., 2008. Analysing
longitudinal data with multilevel models: An example with individuals living with
lower extremity intra-articular fractures. Rehabil. Psychol. 53 (3), 370–386.
Lagnado, D.A., Sloman, S.A., 2002. Learning causal structure. In: Proceedings of the
Twenty-Fourth Annual Conference of the Cognitive Science Society. Mahwah, NJ:
Erlbaum, pp. 560–565.
Meltzoff, A.N., Saby, J.N., Marshall, P.J., 2019. Neural representations of the body in 60-
day-old human infants. Dev. Sci. 22 (1), e12698.
Myowa-Yamakoshi, M., Takeshita, H., 2006. Do human fetuses anticipate self-oriented
actions? A study by four-dimensional (4D) ultrasonography. Infancy 10 (3),
289–301.
Nentjes, L., Bernstein, D., Arntz, A., van Breukelen, G., Slaats, M., 2015. Examining the
influence of psychopathy, hostility biases, and automatic processing on criminal
offenders’ Theory of Mind. Int. J. Law Psychiatry 38, 92–99.
Oostenveld, R., Fries, P., Maris, E., Schoffelen, J.M., 2011. FieldTrip: open source
software for advanced analysis of MEG, EEG, and invasive electrophysiological data.
Comput. Intell. Neurosci. 2011, 1.
Rochat, P., Striano, T., 1999. Emerging self-exploration by 2-month-old infants. Dev. Sci.
2 (2), 206–218.
Rochat, P., Striano, T., 2000. Perceived self in infancy. Infant Behav. Dev. 23 (3–4),
513–530.
Rovee, C.K., Rovee, D.T., 1969. Conjugate reinforcement of infant exploratory behavior.
J. Exp. Child Psychol. 8 (1), 33–39.
Rovee-Collier, C.K., Morrongiello, B.A., Aron, M., Kupersmidt, J., 1978. Topographical
response differentiation and reversal in 3-month-old infants. Infant Behav. Dev. 1,
323–333.
Saby, J.N., Meltzoff, A.N., Marshall, P.J., 2015. Neural body maps in human infants:
somatotopic responses to tactile stimulation in 7-month-olds. NeuroImage 118,
74–78.
Taylor, A.H., Cheke, L.G., Waismeyer, A., Meltzoff, A.N., Miller, R., Gopnik, A., et al.,
2014. Of babies and birds: complex tool behaviours are not sufficient for the
evolution of the ability to create a novel causal intervention. Proc. R. Soc. B 281
(1787), 20140837.
Taylor, A.H., Cheke, L.G., Waismeyer, A., Meltzoff, A., Miller, R., Gopnik, A., et al., 2015.
No conclusive evidence that corvids can create novel causal interventions. Proc. R.
Soc. B 282 (1813), 20150796.
Thierry, G., 2005. The use of event-related potentials in the study of early cognitive
development. Infant Child Dev. 14 (1), 85–94.
Trainor, L.J., Samuel, S.S., Desjardins, R.N., Sonnadara, R.R., 2001. Measuring temporal
resolution in infants using mismatch negativity. Neuroreport 12 (11), 2443–2448.
Trainor, L., McFadden, M., Hodgson, L., Darragh, L., Barlow, J., Matsos, L.,
Sonnadara, R., 2003. Changes in auditory cortex and the development of mismatch
negativity between 2 and 6 months of age. Int. J. Psychophysiol. 51 (1), 5–15.
Tsakiris, M., Schütz-Bosbach, S., Gallagher, S., 2007. On agency and body-ownership:
phenomenological and neurocognitive reflections. Conscious. Cogn. 16 (3),
646–660.
Vossen, H., Van Breukelen, G., Hermens, H., Van Os, J., Lousberg, R., 2011. More
potential in statistical analyses of event-related potentials: a mixed regression
approach. Int. J. Methods Psychiatr. Res. 20 (3), e56–e68.
Walker-Black, L., Stuart, A., 2008. Effect of inverting electrode on mismatch negativity
presence for perceptible/imperceptible tonal frequency contrasts. Int. J. Audiol. 47
(11), 708–714.
Watanabe, H., Taga, G., 2006. General to specific development of movement patterns
and memory for contingency between actions and events in young infants. Infant
Behav. Dev. 29 (3), 402–422.
Watanabe, H., Taga, G., 2011. Initial-state dependency of learning in young infants.
Hum. Mov. Sci. 30 (1), 125–142.
Wunderlich, J.L., Cone-Wesson, B.K., 2006. Maturation of CAEP in infants and children:
a review. Hear. Res. 212 (1–2), 212–223.
Zaadnoordijk, L., Otworowska, M., Kwisthout, J., Hunnius, S., 2018. Can infants’ sense of
agency be found in their behavior? Insights from babybot simulations of the mobile-
paradigm. Cognition 181, 58–64.
Zoia, S., Blason, L., D’Ottavio, G., Bulgheroni, M., Pezzetta, E., Scabar, A., Castiello, U.,
2007. Evidence of early development of action planning in the human foetus: a
kinematic study. Exp. Brain Res. 176 (2), 217–226.
L. Zaadnoordijk et al.