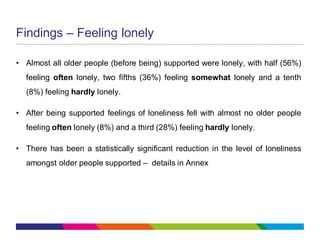
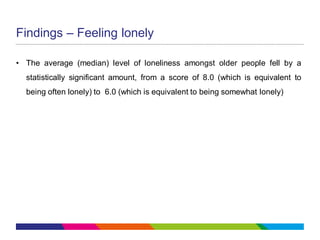
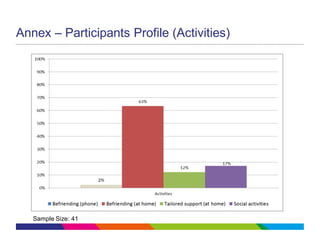
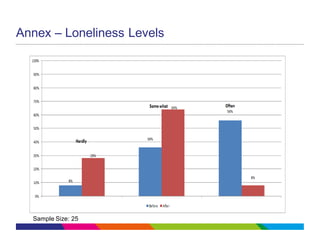
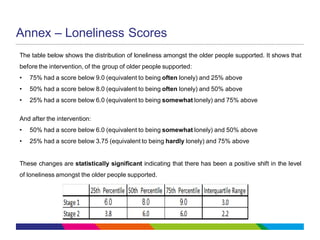
Evidencing Promising Approaches
Interim findings
Jonathan Barham (Research Assistant)
28th August 2015
Introduction
This presentation provides the analysis of current data from local Age UKs who
are collecting information on the loneliness amongst older people being
supported with activities aimed at helping them reduce their level of loneliness.
Project Aim
The purpose of the Age UK Evidencing Promising Approaches project is to
understand whether and how existing services delivered to older people by local
Age UK partners can contribute to alleviating loneliness.
Why does loneliness matter?
• Over one million older people say they always or often feel lonely.
• Loneliness can be understood as an individuals' personal, subjective area of
lacking desired affection, closeness, and social interaction with others.
Loneliness is dependent on the quality not the quantity of relationships.
• Loneliness can be temporary, recurrent or persistent (chronic) state and
because of this effects many people.
• Loneliness has be shown to be associated with poorer lifestyle choices, and
poorer health and well-being outcomes.
Source: Davidson & Rossall (July 2015)
Methodology
Twelve local Age UK partners are collecting standardised information from
“lonely” older people participating in existing services delivered to help them be
less lonely. The standardised information collected is presented in the Annex.
Loneliness is being measured by the use of the 3-item loneliness scale. The
three questions in the scale are asked before the intervention begins (stage 1)
and again after the completion of the intervention (stage 2) as defined by the
local Age UK.
Data
As of August 2015 four local Age UK partners have provided data. The table
below shows the number of people by local Age UK partners who have
completed the 3-item loneliness scale at both stage 1 (before intervention) and
stage 2 (after intervention).
Findings – Characteristics
The older people supported were:
• predominately female (64%); four-fifths had a disability (81%); three-quarters
live alone (77%); almost four fifth (56%) live in a privately rented
accommodation and one-fifth (22%) in social housing. Half were also
widowed (52%) and 5% were careers.
• ranged in age between 50 to 95. Over half of older people (55%) were 80 or
over, with a third (34%) between 80-89; with almost a tenth (8%) between the
ages of 50-59.
Findings – referral route and activities
The older people supported were mainly referred from other agencies (40%) or
health professionals (28%); with nearly a fifth (16%) referred by
family/friends/carers; and a tenth (9%) by staff and with only 7% self referred.
Almost three-fifths (63%) of older people were supported through an at home
befriending service; one-fifth (17%) of older people were supported to participate
in social activities; and 12% of older people were provided with tailored support.
Only 2% were supported through telephone befriending and 5% were supported
through an at home befriending service that progressed to social activities.
Findings – Feeling lonely
• Almost all older people (before being) supported were lonely, with half (56%)
feeling often lonely, two fifths (36%) feeling somewhat lonely and a tenth
(8%) feeling hardly lonely.
• After being supported feelings of loneliness fell with almost no older people
feeling often lonely (8%) and a third (28%) feeling hardly lonely.
• There has been a statistically significant reduction in the level of loneliness
amongst older people supported – details in Annex
Findings – Feeling lonely
• The average (median) level of loneliness amongst older people fell by a
statistically significant amount, from a score of 8.0 (which is equivalent to
being often lonely) to 6.0 (which is equivalent to being somewhat lonely)
ANNEX
Annex – Participants Profile (Gender)
Sample Size: 45
Annex – Participants Profile (Age)
Sample Size: 38
Annex – Participants Profile (Disability)
Sample Size: 42
Annex – Participants Profile (Carer)
Sample Size: 41
Annex – Participants Profile (Martial status)
Sample Size: 44
Annex – Participants Profile (Household)
Sample Size: 39
Annex – Participants Profile (House type)
Sample Size: 41
Annex – Participants Profile (Referral)
Sample Size: 43
Annex – Participants Profile (Activities)
Sample Size: 41
Annex – Loneliness Levels
Sample Size: 25
Annex – Loneliness Scores
The table below shows the distribution of loneliness amongst the older people supported. It shows that
before the intervention, of the group of older people supported:
• 75% had a score below 9.0 (equivalent to being often lonely) and 25% above
• 50% had a score below 8.0 (equivalent to being often lonely) and 50% above
• 25% had a score below 6.0 (equivalent to being somewhat lonely) and 75% above
And after the intervention:
• 50% had a score below 6.0 (equivalent to being somewhat lonely) and 50% above
• 25% had a score below 3.75 (equivalent to being hardly lonely) and 75% above
These changes are statistically significant indicating that there has been a positive shift in the level
of loneliness amongst the older people supported.

150828_Interim Findings at Aug 15

  • 1.
    Evidencing Promising Approaches Interimfindings Jonathan Barham (Research Assistant) 28th August 2015
  • 2.
    Introduction This presentation providesthe analysis of current data from local Age UKs who are collecting information on the loneliness amongst older people being supported with activities aimed at helping them reduce their level of loneliness.
  • 3.
    Project Aim The purposeof the Age UK Evidencing Promising Approaches project is to understand whether and how existing services delivered to older people by local Age UK partners can contribute to alleviating loneliness.
  • 4.
    Why does lonelinessmatter? • Over one million older people say they always or often feel lonely. • Loneliness can be understood as an individuals' personal, subjective area of lacking desired affection, closeness, and social interaction with others. Loneliness is dependent on the quality not the quantity of relationships. • Loneliness can be temporary, recurrent or persistent (chronic) state and because of this effects many people. • Loneliness has be shown to be associated with poorer lifestyle choices, and poorer health and well-being outcomes. Source: Davidson & Rossall (July 2015)
  • 5.
    Methodology Twelve local AgeUK partners are collecting standardised information from “lonely” older people participating in existing services delivered to help them be less lonely. The standardised information collected is presented in the Annex. Loneliness is being measured by the use of the 3-item loneliness scale. The three questions in the scale are asked before the intervention begins (stage 1) and again after the completion of the intervention (stage 2) as defined by the local Age UK.
  • 6.
    Data As of August2015 four local Age UK partners have provided data. The table below shows the number of people by local Age UK partners who have completed the 3-item loneliness scale at both stage 1 (before intervention) and stage 2 (after intervention).
  • 7.
    Findings – Characteristics Theolder people supported were: • predominately female (64%); four-fifths had a disability (81%); three-quarters live alone (77%); almost four fifth (56%) live in a privately rented accommodation and one-fifth (22%) in social housing. Half were also widowed (52%) and 5% were careers. • ranged in age between 50 to 95. Over half of older people (55%) were 80 or over, with a third (34%) between 80-89; with almost a tenth (8%) between the ages of 50-59.
  • 8.
    Findings – referralroute and activities The older people supported were mainly referred from other agencies (40%) or health professionals (28%); with nearly a fifth (16%) referred by family/friends/carers; and a tenth (9%) by staff and with only 7% self referred. Almost three-fifths (63%) of older people were supported through an at home befriending service; one-fifth (17%) of older people were supported to participate in social activities; and 12% of older people were provided with tailored support. Only 2% were supported through telephone befriending and 5% were supported through an at home befriending service that progressed to social activities.
  • 9.
    Findings – Feelinglonely • Almost all older people (before being) supported were lonely, with half (56%) feeling often lonely, two fifths (36%) feeling somewhat lonely and a tenth (8%) feeling hardly lonely. • After being supported feelings of loneliness fell with almost no older people feeling often lonely (8%) and a third (28%) feeling hardly lonely. • There has been a statistically significant reduction in the level of loneliness amongst older people supported – details in Annex
  • 10.
    Findings – Feelinglonely • The average (median) level of loneliness amongst older people fell by a statistically significant amount, from a score of 8.0 (which is equivalent to being often lonely) to 6.0 (which is equivalent to being somewhat lonely)
  • 11.
  • 12.
    Annex – ParticipantsProfile (Gender) Sample Size: 45
  • 13.
    Annex – ParticipantsProfile (Age) Sample Size: 38
  • 14.
    Annex – ParticipantsProfile (Disability) Sample Size: 42
  • 15.
    Annex – ParticipantsProfile (Carer) Sample Size: 41
  • 16.
    Annex – ParticipantsProfile (Martial status) Sample Size: 44
  • 17.
    Annex – ParticipantsProfile (Household) Sample Size: 39
  • 18.
    Annex – ParticipantsProfile (House type) Sample Size: 41
  • 19.
    Annex – ParticipantsProfile (Referral) Sample Size: 43
  • 20.
    Annex – ParticipantsProfile (Activities) Sample Size: 41
  • 21.
    Annex – LonelinessLevels Sample Size: 25
  • 22.
    Annex – LonelinessScores The table below shows the distribution of loneliness amongst the older people supported. It shows that before the intervention, of the group of older people supported: • 75% had a score below 9.0 (equivalent to being often lonely) and 25% above • 50% had a score below 8.0 (equivalent to being often lonely) and 50% above • 25% had a score below 6.0 (equivalent to being somewhat lonely) and 75% above And after the intervention: • 50% had a score below 6.0 (equivalent to being somewhat lonely) and 50% above • 25% had a score below 3.75 (equivalent to being hardly lonely) and 75% above These changes are statistically significant indicating that there has been a positive shift in the level of loneliness amongst the older people supported.