Download to read offline


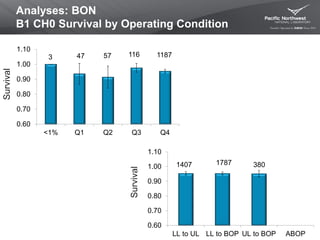

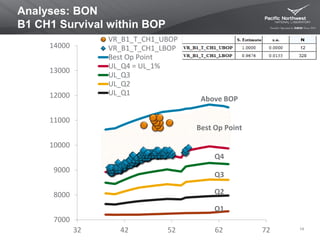
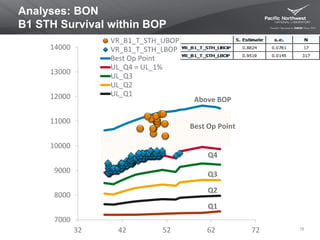


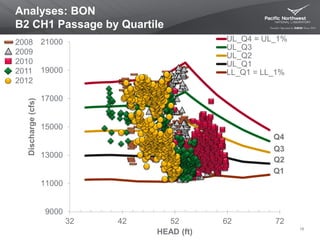
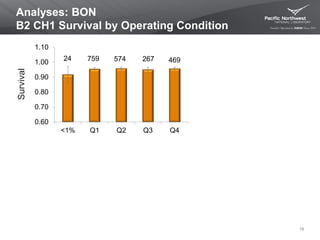
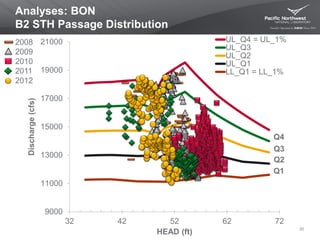
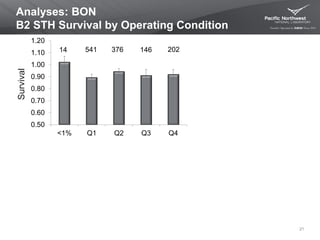
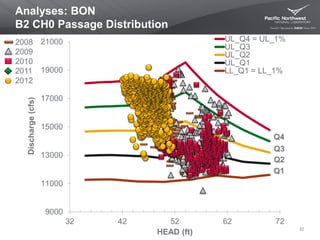
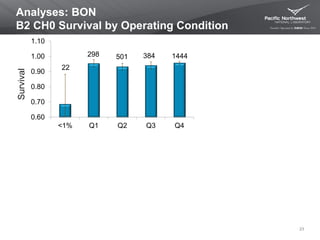
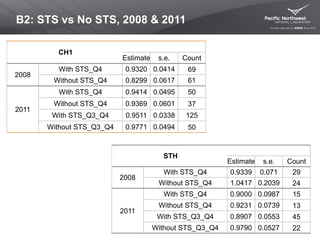

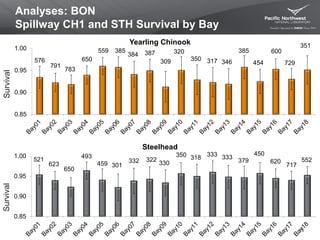
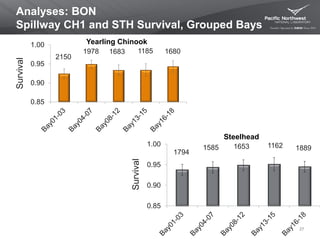
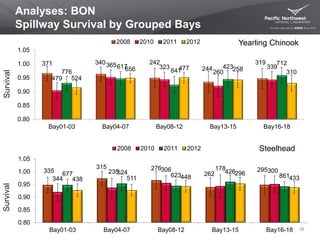
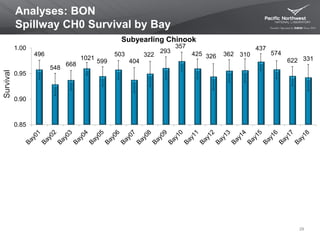
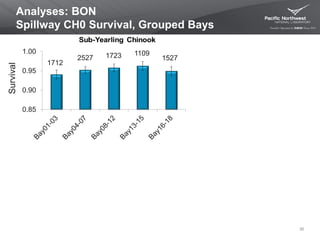
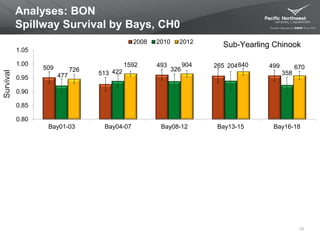
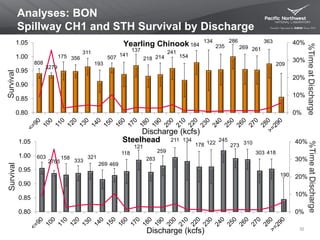
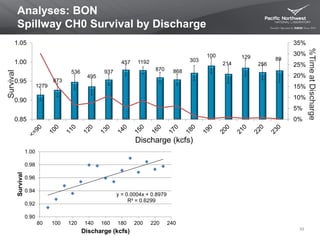
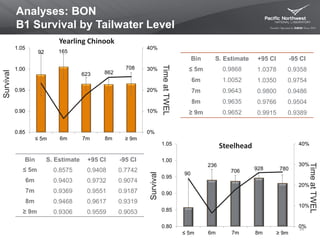
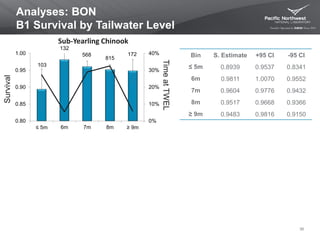
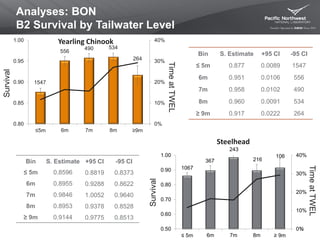
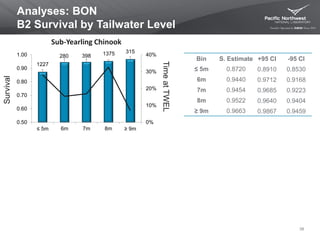
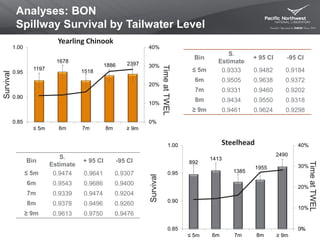
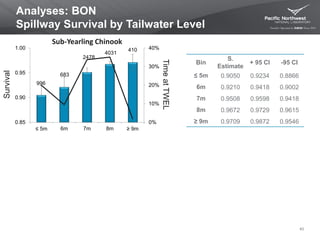

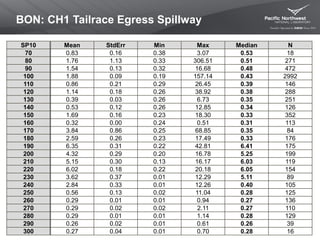
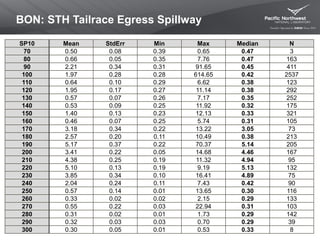
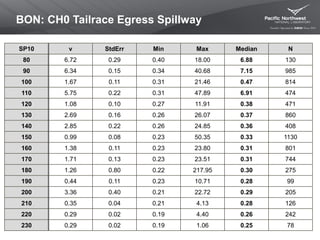
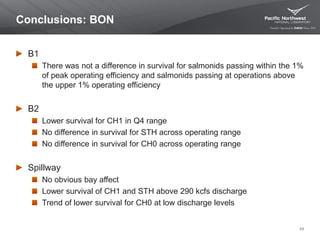


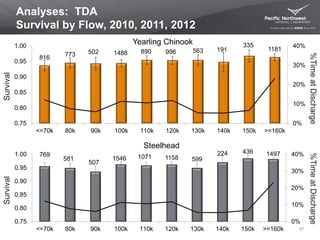
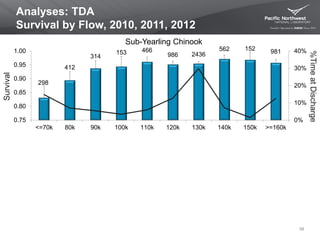

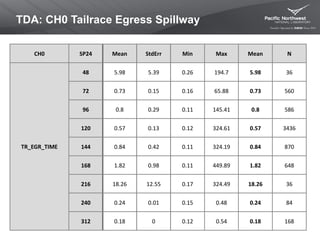
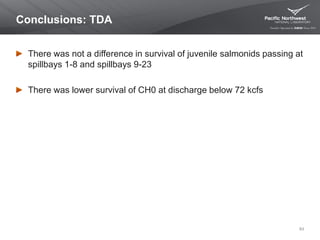

This document presents a systematic review of juvenile salmonid passage and survival data at Bonneville and The Dalles dams from 2008 to 2012, focusing on the impact of turbine and spillway operations. It analyzes survival rates in relation to different operating efficiencies and conditions, highlighting findings related to spillway survival and turbine efficiency. The results contribute to understanding the effects of dam operations on fish survival, which is crucial for environmental management efforts.

![Propulsion%20system %203rd[1]](https://cdn.slidesharecdn.com/ss_thumbnails/propulsion20system-203rd1-140408015635-phpapp01-thumbnail.jpg?width=640&height=640&fit=bounds)


