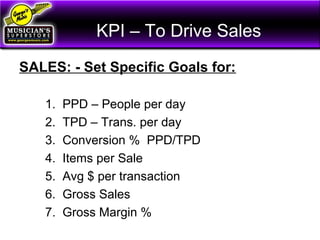
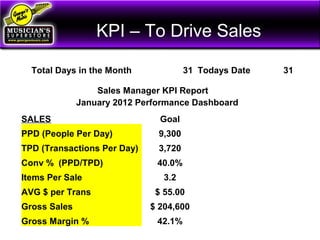
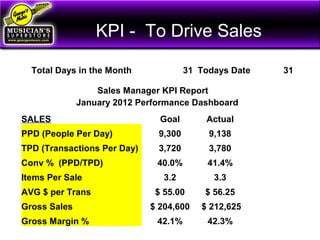
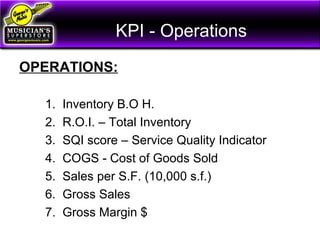
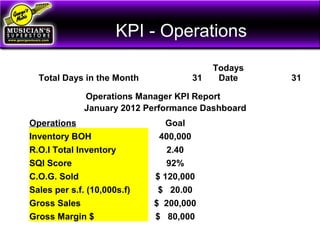
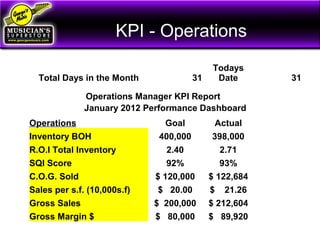
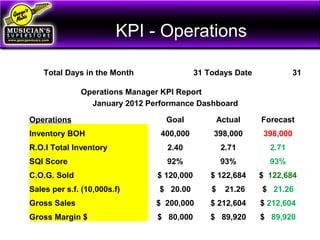
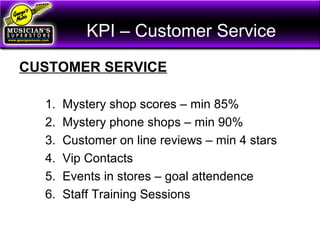
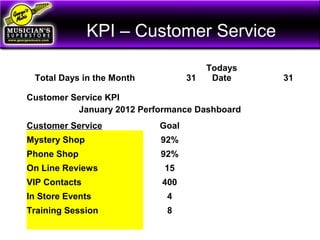
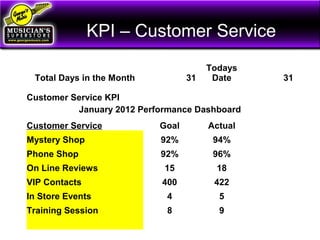
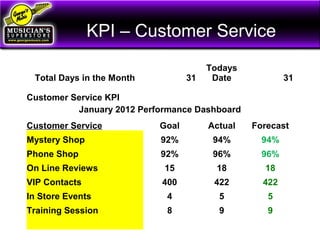
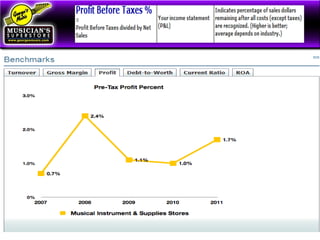
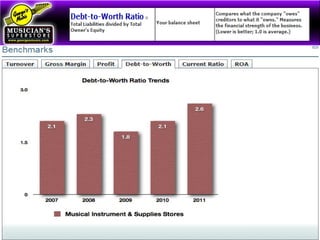
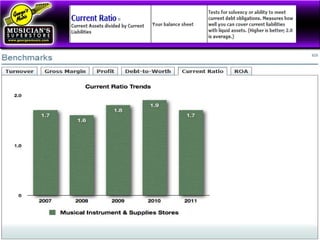
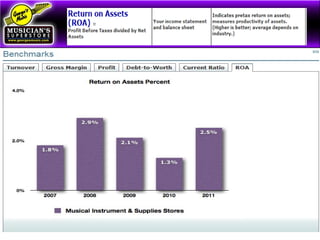
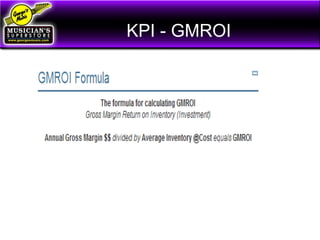
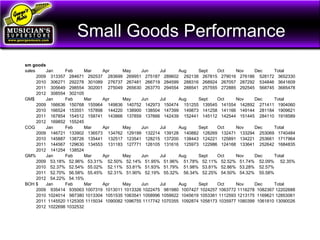
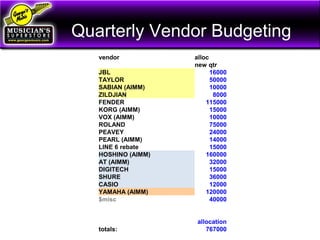
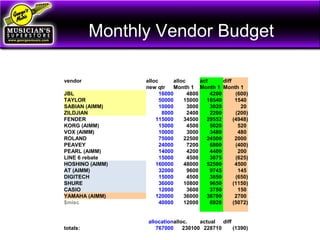
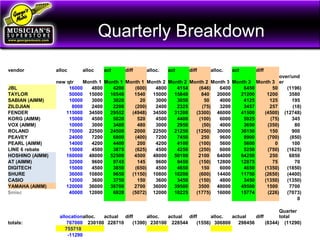
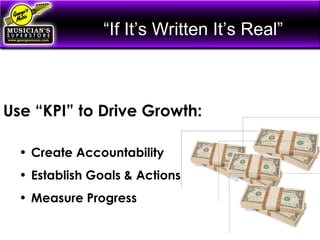
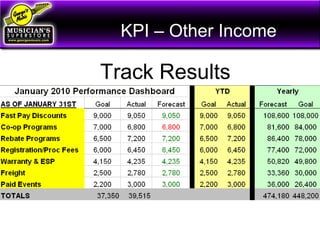
The document is a presentation from George Hines of George's Music, Inc. discussing the use of key performance indicators (KPIs) to drive growth and profits through defined company culture. It provides examples of KPIs that could be tracked for sales, operations, customer service, and finance to establish accountability, action plans, and measure progress. Specific metrics include people per day, sales per transaction, inventory levels, customer satisfaction scores, and profitability ratios. Data from January 2012 shows most metrics either met or exceeded initial goals.
Virginia Society of Certified Public Accountants - Affordable Care Act (ACA) ...pbjandaca
Wondering how you can continue to grow, or even survive, in the face of Obamacare and increased healthcare costs? Fellow business owner Rich Boehling, who runs a company with 380 employees, shared the unique strategy he has implemented in his company to turn this big problem into a big opportunity. A FREE, comprehensive white paper, additional details, and many of the resources Rich used in developing his strategy can be found at http://www.pbjandaca.com/.
"ACA Business Strategies: Workshop for Employers of Vulnerable Wage Populations" presented by: Rich Boehling, President and CEO of Productiv Inc. (http://getproductiv.com/) on May 22, 2013 at the Virginia Society of Certified Public Accountants 12th Annual Industry Conference (http://www.vscpa.com/).
FSAE-A Business Presentation - Redback Racing 2017Albert Chau
Formula SAE (F-SAE) is a student competition where students design and build a race car. Part of that competition is pitching the race car as part of a wider business to potential investors. I presented this at F-SAE Australasia 2017 for UNSW Redback Racing. Despite only having 2 weeks to prepare a presentation where other teams have an entire year, Redback Racing placed 4th in the presentation event, which is the best result Redback has had in 6 years.
AGENDA:
Introductions and Company Overviews
Stein Mart’s Business Objectives
Leveraging the IBM Cloud and QueBIT FrameWORQ to maximize time to value
Stein Mart’s Reporting Solution
Results Achieved
Have enough data to project revenue for future? Incorporate professionally designed content-ready Pay Forecast PowerPoint Presentation Slides to estimate how much a company will generate in a given specific period. With our pay forecast PowerPoint presentation templates to preview sales for the same period and get in touch with customers to ask them about their future purchasing plans. This ready-to-use pay forecast PowerPoint presentation slideshow comprises of templates such as retail store revenue projection, revenue forecast model, three-year revenue projection, monthly revenue projection, income statement projection, revenue projection per store, emerging sales forecast, revenue projection by active users, etc. Use historical data to estimate revenue for future time period. Incorporate revenue projection PowerPoint templates to keep your sales manager, marketing manager, team lead and boss on the same page to avoid any costly potential risk. These templates are completely customizable. You can change the color, text, icon and font size as per your need. Add or remove the content, if needed. Grab this ready-made pay forecast PowerPoint templates to predict company’s future growth. Your appeal is bound to generate desired funds due to our Pay Forecast Powerpoint Presentation Slides. It will fill empty coffers.
Presenting this set of slides with name - Revenue Projection Powerpoint Presentation Slides. This deck consists of total of twenty slides. It has PPT slides highlighting important topics of Revenue Projection Powerpoint Presentation Slides. This deck comprises of amazing visuals with thoroughly researched content. Each template is well crafted and designed by our PowerPoint experts. Our designers have included all the necessary PowerPoint layouts in this deck. From icons to graphs, this PPT deck has it all. The best part is that these templates are easily customizable. Just click the DOWNLOAD button shown below. Edit the colour, text, font size, add or delete the content as per the requirement. Download this deck now and engage your audience with this ready made presentation.
This complete presentation has PPT slides on wide range of topics highlighting the core areas of your business needs. It has professionally designed templates with relevant visuals and subject driven content. This presentation deck has total of fourty five slides. Get access to the customizable templates. Our designers have created editable templates for your convenience. You can edit the colour, text and font size as per your need. You can add or delete the content if required. You are just a click to away to have this ready-made presentation. Click the download button now. https://bit.ly/3goZGY8
HEAP SORT ILLUSTRATED WITH HEAPIFY, BUILD HEAP FOR DYNAMIC ARRAYS.
Heap sort is a comparison-based sorting technique based on Binary Heap data structure. It is similar to the selection sort where we first find the minimum element and place the minimum element at the beginning. Repeat the same process for the remaining elements.
Cosmetic shop management system project report.pdfKamal Acharya
Buying new cosmetic products is difficult. It can even be scary for those who have sensitive skin and are prone to skin trouble. The information needed to alleviate this problem is on the back of each product, but it's thought to interpret those ingredient lists unless you have a background in chemistry.
Instead of buying and hoping for the best, we can use data science to help us predict which products may be good fits for us. It includes various function programs to do the above mentioned tasks.
Data file handling has been effectively used in the program.
The automated cosmetic shop management system should deal with the automation of general workflow and administration process of the shop. The main processes of the system focus on customer's request where the system is able to search the most appropriate products and deliver it to the customers. It should help the employees to quickly identify the list of cosmetic product that have reached the minimum quantity and also keep a track of expired date for each cosmetic product. It should help the employees to find the rack number in which the product is placed.It is also Faster and more efficient way.
CW RADAR, FMCW RADAR, FMCW ALTIMETER, AND THEIR PARAMETERSveerababupersonal22
It consists of cw radar and fmcw radar ,range measurement,if amplifier and fmcw altimeterThe CW radar operates using continuous wave transmission, while the FMCW radar employs frequency-modulated continuous wave technology. Range measurement is a crucial aspect of radar systems, providing information about the distance to a target. The IF amplifier plays a key role in signal processing, amplifying intermediate frequency signals for further analysis. The FMCW altimeter utilizes frequency-modulated continuous wave technology to accurately measure altitude above a reference point.
Sachpazis:Terzaghi Bearing Capacity Estimation in simple terms with Calculati...Dr.Costas Sachpazis
Terzaghi's soil bearing capacity theory, developed by Karl Terzaghi, is a fundamental principle in geotechnical engineering used to determine the bearing capacity of shallow foundations. This theory provides a method to calculate the ultimate bearing capacity of soil, which is the maximum load per unit area that the soil can support without undergoing shear failure. The Calculation HTML Code included.
We have compiled the most important slides from each speaker's presentation. This year’s compilation, available for free, captures the key insights and contributions shared during the DfMAy 2024 conference.
Industrial Training at Shahjalal Fertilizer Company Limited (SFCL)MdTanvirMahtab2
This presentation is about the working procedure of Shahjalal Fertilizer Company Limited (SFCL). A Govt. owned Company of Bangladesh Chemical Industries Corporation under Ministry of Industries.
6th International Conference on Machine Learning & Applications (CMLA 2024)ClaraZara1
6th International Conference on Machine Learning & Applications (CMLA 2024) will provide an excellent international forum for sharing knowledge and results in theory, methodology and applications of on Machine Learning & Applications.
Saudi Arabia stands as a titan in the global energy landscape, renowned for its abundant oil and gas resources. It's the largest exporter of petroleum and holds some of the world's most significant reserves. Let's delve into the top 10 oil and gas projects shaping Saudi Arabia's energy future in 2024.
Welcome to WIPAC Monthly the magazine brought to you by the LinkedIn Group Water Industry Process Automation & Control.
In this month's edition, along with this month's industry news to celebrate the 13 years since the group was created we have articles including
A case study of the used of Advanced Process Control at the Wastewater Treatment works at Lleida in Spain
A look back on an article on smart wastewater networks in order to see how the industry has measured up in the interim around the adoption of Digital Transformation in the Water Industry.
9. New Economy
“Do More with Less”
Problems:
–Economic Recession
–High Unemployment
–Increased Costs
–More Competition
–Consumer Demands
–Profit Pressures from Internet
–Others?
10. Solution
GET CLARITY – KNOW WHAT YOU WANT
Use KPI To Create
1. Accountability
2. Establish Action Plans
3. Measure Progress
11. KPI – To Drive Sales
SALES: - Set Specific Goals for:
1. PPD – People per day
2. TPD – Trans. per day
3. Conversion % PPD/TPD
4. Items per Sale
5. Avg $ per transaction
6. Gross Sales
7. Gross Margin %
12. KPI – To Drive Sales
Total Days in the Month 31 Todays Date 31
Sales Manager KPI Report
January 2012 Performance Dashboard
SALES Goal
PPD (People Per Day) 9,300
TPD (Transactions Per Day) 3,720
Conv % (PPD/TPD) 40.0%
Items Per Sale 3.2
AVG $ per Trans $ 55.00
Gross Sales $ 204,600
Gross Margin % 42.1%
13. KPI - To Drive Sales
Total Days in the Month 31 Todays Date 31
Sales Manager KPI Report
January 2012 Performance Dashboard
SALES Goal Actual
PPD (People Per Day) 9,300 9,138
TPD (Transactions Per Day) 3,720 3,780
Conv % (PPD/TPD) 40.0% 41.4%
Items Per Sale 3.2 3.3
AVG $ per Trans $ 55.00 $ 56.25
Gross Sales $ 204,600 $ 212,625
Gross Margin % 42.1% 42.3%
14. KPI – To Drive Sales
Total Days in the Month 31 Todays Date 31
Sales Manager KPI Report
January 2012 Performance Dashboard
SALES Goal Actual Forecast
PPD (People Per Day) 9,300 9,138 9,138
TPD (Transactions Per Day) 3,720 3,780 3,780
Conv % (PPD/TPD) 40.0% 41.4% 41.4%
Items Per Sale 3.2 3.3 3.3
AVG $ per Trans $ 55.00 $ 56.25 $ 56.25
Gross Sales $ 204,600 $ 212,625 $ 212,625
Gross Margin % 42.1% 42.3% 42.3%
15. KPI - Operations
OPERATIONS:
1. Inventory B.O H.
2. R.O.I. – Total Inventory
3. SQI score – Service Quality Indicator
4. COGS - Cost of Goods Sold
5. Sales per S.F. (10,000 s.f.)
6. Gross Sales
7. Gross Margin $
16. KPI - Operations
Total Days in the Month 31
Todays
Date 31
Operations Manager KPI Report
January 2012 Performance Dashboard
Operations Goal
Inventory BOH 400,000
R.O.I Total Inventory 2.40
SQI Score 92%
C.O.G. Sold $ 120,000
Sales per s.f. (10,000s.f) $ 20.00
Gross Sales $ 200,000
Gross Margin $ $ 80,000
17. KPI - Operations
Total Days in the Month 31
Todays
Date 31
Operations Manager KPI Report
January 2012 Performance Dashboard
Operations Goal Actual
Inventory BOH 400,000 398,000
R.O.I Total Inventory 2.40 2.71
SQI Score 92% 93%
C.O.G. Sold $ 120,000 $ 122,684
Sales per s.f. (10,000s.f) $ 20.00 $ 21.26
Gross Sales $ 200,000 $ 212,604
Gross Margin $ $ 80,000 $ 89,920
18. KPI - Operations
Total Days in the Month 31 Todays Date 31
Operations Manager KPI Report
January 2012 Performance Dashboard
Operations Goal Actual Forecast
Inventory BOH 400,000 398,000 398,000
R.O.I Total Inventory 2.40 2.71 2.71
SQI Score 92% 93% 93%
C.O.G. Sold $ 120,000 $ 122,684 $ 122,684
Sales per s.f. (10,000s.f) $ 20.00 $ 21.26 $ 21.26
Gross Sales $ 200,000 $ 212,604 $ 212,604
Gross Margin $ $ 80,000 $ 89,920 $ 89,920
19. KPI – Customer Service
CUSTOMER SERVICE
1. Mystery shop scores – min 85%
2. Mystery phone shops – min 90%
3. Customer on line reviews – min 4 stars
4. Vip Contacts
5. Events in stores – goal attendence
6. Staff Training Sessions
20. KPI – Customer Service
Total Days in the Month 31
Todays
Date 31
Customer Service KPI
January 2012 Performance Dashboard
Customer Service Goal
Mystery Shop 92%
Phone Shop 92%
On Line Reviews 15
VIP Contacts 400
In Store Events 4
Training Session 8
21. KPI – Customer Service
Total Days in the Month 31
Todays
Date 31
Customer Service KPI
January 2012 Performance Dashboard
Customer Service Goal Actual
Mystery Shop 92% 94%
Phone Shop 92% 96%
On Line Reviews 15 18
VIP Contacts 400 422
In Store Events 4 5
Training Session 8 9
22. KPI – Customer Service
Total Days in the Month 31
Todays
Date 31
Customer Service KPI
January 2012 Performance Dashboard
Customer Service Goal Actual Forecast
Mystery Shop 92% 94% 94%
Phone Shop 92% 96% 96%
On Line Reviews 15 18 18
VIP Contacts 400 422 422
In Store Events 4 5 5
Training Session 8 9 9
23. KPI – Finance Department
Control Cash and
Maintain Profitability
25. KPI - Finance
• Finance:
1. Inventory Turnover
2. Gross Margin % or $
3. Profit or Net Income Before Tax % or $
4. Current Ratio – Assets to Liabilities
5. ROA - Return on Assets
6. GMROI
7. Operation costs as % of sales
8. “Other” income in $
44. Streams of Income
Registration and
Processing Fees
a) Lesson Registration
b) Repair Paperwork Fee
c) Band Instrument
Processing Fee
45. Streams of Income
Warranty & Extended
Service Agreements
• Replacement Plans -
Internal vs. External
• Band Instrument or Rental
• Threshold Discussion
47. Streams of Income
In-Store Paid Events
• ‘Home Grown’ Events
• Guitar Repair
• Uke Classes
• Home Recording
48. Streams of Income
Others
a) Lease Negotiations
b) Upgrade Items
c) Bin Items
d) Investment Income
e) Assorted Discounts –
Printing, Check Guarantee, Office Supplies, CC, Airline
50. Thank You!
a Defined Company Culture
George Hines - President George’s Music, Inc.
ghines@georgesmusic.com
Editor's Notes
Why are we here? Ask for feedback -
Universal Laws: Law of Expectation – Make a decision before we get started $ 10,000 min
Question: Is Inventory an Asset or Liability?
Why are we here? Ask for feedback -
Universal Laws: Law of Expectation – Make a decision before we get started $ 10,000 min
Question: Is Inventory an Asset or Liability?