Palm Springs Area Listings Sold By Calendar Quarter (Through March 2010)
•
1 like•221 views

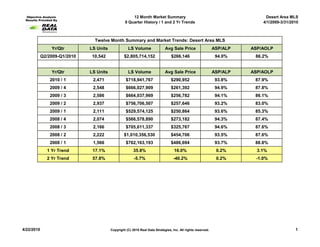
Nine quarters of Palm Springs area sales activity through first quarter 2010. (Charts provided by Real Data Strategies through the California Desert Association of Realtors.

Recommended
Recommended
More Related Content
What's hot
What's hot (18)
Viewers also liked
Viewers also liked (16)
Similar to Palm Springs Area Listings Sold By Calendar Quarter (Through March 2010)
Similar to Palm Springs Area Listings Sold By Calendar Quarter (Through March 2010) (20)
More from SDM: Music Venture
More from SDM: Music Venture (19)
Recently uploaded
Recently uploaded (20)
Palm Springs Area Listings Sold By Calendar Quarter (Through March 2010)
- 1. 12 Month Market Summary Desert Area MLS 9 Quarter History / 1 and 2 Yr Trends 4/1/2009-3/31/2010 Twelve Month Summary and Market Trends: Desert Area MLS Yr/Qtr LS Units LS Volume Avg Sale Price ASP/ALP ASP/AOLP Q2/2009-Q1/2010 10,542 $2,805,714,152 $266,146 94.0% 86.2% Yr/Qtr LS Units LS Volume Avg Sale Price ASP/ALP ASP/AOLP 2010 / 1 2,471 $718,941,767 $290,952 93.8% 87.9% 2009 / 4 2,548 $666,027,909 $261,392 94.9% 87.8% 2009 / 3 2,586 $664,037,969 $256,782 94.1% 86.1% 2009 / 2 2,937 $756,706,507 $257,646 93.2% 83.0% 2009 / 1 2,111 $529,574,125 $250,864 93.6% 85.3% 2008 / 4 2,074 $566,578,890 $273,182 94.3% 87.4% 2008 / 3 2,166 $705,611,337 $325,767 94.6% 87.6% 2008 / 2 2,222 $1,010,356,530 $454,706 93.5% 87.6% 2008 / 1 1,566 $762,163,193 $486,694 93.7% 88.8% 1 Yr Trend 17.1% 35.8% 16.0% 0.2% 3.1% 2 Yr Trend 57.8% -5.7% -40.2% 0.2% -1.0% 4/22/2010 Copyright (C) 2010 Real Data Strategies, Inc. All rights reserved. 1
- 2. 12 Month Market Summary Desert Area MLS 9 Quarter History / 1 and 2 Yr Trends 4/1/2009-3/31/2010 Twelve Month Summary and Market Trends: Bermuda Dunes Yr/Qtr LS Units LS Volume Avg Sale Price ASP/ALP ASP/AOLP Q2/2009-Q1/2010 122 $32,483,302 $266,257 93.1% 83.2% Yr/Qtr LS Units LS Volume Avg Sale Price ASP/ALP ASP/AOLP 2010 / 1 35 $8,607,550 $245,930 92.7% 85.0% 2009 / 4 34 $9,956,300 $292,832 93.6% 86.6% 2009 / 3 31 $8,369,600 $269,987 91.9% 83.9% 2009 / 2 22 $5,549,852 $252,266 94.2% 77.5% 2009 / 1 21 $5,166,400 $246,019 94.9% 84.5% 2008 / 4 13 $3,626,080 $278,929 96.1% 89.3% 2008 / 3 20 $6,481,025 $324,051 97.1% 85.6% 2008 / 2 25 $9,761,600 $390,464 91.9% 85.7% 2008 / 1 17 $7,681,900 $451,876 93.2% 86.7% 1 Yr Trend 66.7% 66.6% 0.0% -2.3% 0.6% 2 Yr Trend 105.9% 12.0% -45.6% -0.5% -2.0% 4/22/2010 Copyright (C) 2010 Real Data Strategies, Inc. All rights reserved. 1
- 3. 12 Month Market Summary Desert Area MLS 9 Quarter History / 1 and 2 Yr Trends 4/1/2009-3/31/2010 Twelve Month Summary and Market Trends: Cathedral City Yr/Qtr LS Units LS Volume Avg Sale Price ASP/ALP ASP/AOLP Q2/2009-Q1/2010 947 $161,176,351 $170,197 97.5% 90.3% Yr/Qtr LS Units LS Volume Avg Sale Price ASP/ALP ASP/AOLP 2010 / 1 211 $36,205,040 $171,588 98.0% 93.7% 2009 / 4 226 $39,256,499 $173,701 98.5% 92.5% 2009 / 3 252 $42,021,092 $166,750 96.7% 89.4% 2009 / 2 258 $43,693,720 $169,356 96.7% 85.8% 2009 / 1 211 $38,242,824 $181,246 96.5% 87.0% 2008 / 4 223 $45,303,686 $203,156 96.2% 88.1% 2008 / 3 202 $45,464,004 $225,069 96.4% 87.6% 2008 / 2 170 $44,467,740 $261,575 95.0% 87.2% 2008 / 1 115 $34,379,045 $298,948 95.5% 87.7% 1 Yr Trend 0.0% -5.3% -5.3% 1.6% 7.7% 2 Yr Trend 83.5% 5.3% -42.6% 2.7% 6.8% 4/22/2010 Copyright (C) 2010 Real Data Strategies, Inc. All rights reserved. 1
- 4. 12 Month Market Summary Desert Area MLS 9 Quarter History / 1 and 2 Yr Trends 4/1/2009-3/31/2010 Twelve Month Summary and Market Trends: Coachella Yr/Qtr LS Units LS Volume Avg Sale Price ASP/ALP ASP/AOLP Q2/2009-Q1/2010 538 $74,562,370 $138,592 100.5% 95.4% Yr/Qtr LS Units LS Volume Avg Sale Price ASP/ALP ASP/AOLP 2010 / 1 92 $12,640,450 $137,396 100.7% 98.2% 2009 / 4 134 $18,217,650 $135,953 99.2% 95.8% 2009 / 3 134 $18,918,175 $141,180 101.5% 94.9% 2009 / 2 178 $24,786,095 $139,248 100.4% 92.9% 2009 / 1 142 $18,210,385 $128,242 98.7% 90.5% 2008 / 4 113 $18,938,365 $167,596 99.6% 94.3% 2008 / 3 95 $17,762,554 $186,974 100.9% 94.9% 2008 / 2 67 $13,893,263 $207,362 97.3% 89.0% 2008 / 1 30 $6,449,940 $214,998 96.1% 89.6% 1 Yr Trend -35.2% -30.6% 7.1% 2.1% 8.5% 2 Yr Trend 206.7% 96.0% -36.1% 4.9% 9.6% 4/22/2010 Copyright (C) 2010 Real Data Strategies, Inc. All rights reserved. 1
- 5. 12 Month Market Summary Desert Area MLS 9 Quarter History / 1 and 2 Yr Trends 4/1/2009-3/31/2010 Twelve Month Summary and Market Trends: Desert Hot Springs Yr/Qtr LS Units LS Volume Avg Sale Price ASP/ALP ASP/AOLP Q2/2009-Q1/2010 1,149 $108,499,366 $94,429 98.8% 91.3% Yr/Qtr LS Units LS Volume Avg Sale Price ASP/ALP ASP/AOLP 2010 / 1 233 $22,891,877 $98,248 99.9% 95.4% 2009 / 4 270 $26,207,139 $97,063 99.7% 93.9% 2009 / 3 274 $26,352,972 $96,179 98.9% 91.7% 2009 / 2 372 $33,047,378 $88,837 96.5% 84.0% 2009 / 1 297 $25,882,813 $87,148 94.8% 81.2% 2008 / 4 286 $31,036,637 $108,520 95.1% 82.8% 2008 / 3 240 $33,081,084 $137,838 95.0% 82.3% 2008 / 2 134 $22,059,763 $164,625 93.3% 81.6% 2008 / 1 86 $16,815,030 $195,524 94.8% 83.4% 1 Yr Trend -21.5% -11.6% 12.7% 5.4% 17.6% 2 Yr Trend 170.9% 36.1% -49.8% 5.4% 14.4% 4/22/2010 Copyright (C) 2010 Real Data Strategies, Inc. All rights reserved. 1
- 6. 12 Month Market Summary Desert Area MLS 9 Quarter History / 1 and 2 Yr Trends 4/1/2009-3/31/2010 Twelve Month Summary and Market Trends: Indian Wells Yr/Qtr LS Units LS Volume Avg Sale Price ASP/ALP ASP/AOLP Q2/2009-Q1/2010 188 $122,454,310 $651,353 90.4% 81.3% Yr/Qtr LS Units LS Volume Avg Sale Price ASP/ALP ASP/AOLP 2010 / 1 51 $35,498,500 $696,049 90.3% 82.9% 2009 / 4 41 $25,344,669 $618,163 93.0% 85.0% 2009 / 3 42 $30,328,326 $722,103 90.7% 82.0% 2009 / 2 54 $31,282,815 $579,311 87.7% 75.2% 2009 / 1 25 $19,431,000 $777,240 90.6% 86.1% 2008 / 4 26 $24,903,050 $957,810 88.9% 86.2% 2008 / 3 25 $29,980,900 $1,199,236 89.7% 86.0% 2008 / 2 59 $78,605,189 $1,332,291 91.9% 87.1% 2008 / 1 31 $28,370,000 $915,161 92.7% 88.5% 1 Yr Trend 104.0% 82.7% -10.4% -0.4% -3.6% 2 Yr Trend 64.5% 25.1% -23.9% -2.7% -6.2% 4/22/2010 Copyright (C) 2010 Real Data Strategies, Inc. All rights reserved. 1
- 7. 12 Month Market Summary Desert Area MLS 9 Quarter History / 1 and 2 Yr Trends 4/1/2009-3/31/2010 Twelve Month Summary and Market Trends: Indio Yr/Qtr LS Units LS Volume Avg Sale Price ASP/ALP ASP/AOLP Q2/2009-Q1/2010 1,579 $300,584,846 $190,364 97.9% 92.0% Yr/Qtr LS Units LS Volume Avg Sale Price ASP/ALP ASP/AOLP 2010 / 1 392 $79,635,946 $203,153 97.8% 94.1% 2009 / 4 361 $69,729,841 $193,157 98.8% 93.3% 2009 / 3 389 $69,638,415 $179,019 97.8% 92.3% 2009 / 2 437 $81,580,644 $186,683 97.4% 88.1% 2009 / 1 374 $69,374,781 $185,494 95.9% 88.2% 2008 / 4 392 $80,785,686 $206,086 97.6% 90.8% 2008 / 3 354 $81,056,438 $228,973 97.9% 91.3% 2008 / 2 296 $82,385,974 $278,331 95.9% 88.6% 2008 / 1 157 $52,342,240 $333,390 94.3% 88.0% 1 Yr Trend 4.8% 14.8% 9.5% 2.0% 6.8% 2 Yr Trend 149.7% 52.1% -39.1% 3.7% 7.0% 4/22/2010 Copyright (C) 2010 Real Data Strategies, Inc. All rights reserved. 1
- 8. 12 Month Market Summary Desert Area MLS 9 Quarter History / 1 and 2 Yr Trends 4/1/2009-3/31/2010 Twelve Month Summary and Market Trends: Joshua Tree Yr/Qtr LS Units LS Volume Avg Sale Price ASP/ALP ASP/AOLP Q2/2009-Q1/2010 73 $7,076,657 $96,941 93.3% 85.6% Yr/Qtr LS Units LS Volume Avg Sale Price ASP/ALP ASP/AOLP 2010 / 1 15 $1,381,400 $92,093 86.6% 73.5% 2009 / 4 16 $1,353,000 $84,563 93.9% 89.7% 2009 / 3 22 $2,237,600 $101,709 94.9% 88.2% 2009 / 2 20 $2,104,657 $105,233 97.9% 90.9% 2009 / 1 14 $1,180,580 $84,327 93.5% 80.1% 2008 / 4 14 $2,017,857 $144,133 91.2% 86.2% 2008 / 3 14 $1,731,400 $123,671 90.5% 80.3% 2008 / 2 15 $2,340,900 $156,060 95.5% 87.3% 2008 / 1 19 $3,190,999 $167,947 96.8% 90.1% 1 Yr Trend 7.1% 17.0% 9.2% -7.3% -8.2% 2 Yr Trend -21.1% -56.7% -45.2% -10.5% -18.4% 4/22/2010 Copyright (C) 2010 Real Data Strategies, Inc. All rights reserved. 1
- 9. 12 Month Market Summary Desert Area MLS 9 Quarter History / 1 and 2 Yr Trends 4/1/2009-3/31/2010 Twelve Month Summary and Market Trends: La Quinta Yr/Qtr LS Units LS Volume Avg Sale Price ASP/ALP ASP/AOLP Q2/2009-Q1/2010 1,225 $591,354,271 $482,738 92.7% 84.6% Yr/Qtr LS Units LS Volume Avg Sale Price ASP/ALP ASP/AOLP 2010 / 1 306 $156,205,680 $510,476 92.4% 86.3% 2009 / 4 315 $140,807,930 $447,009 93.9% 85.4% 2009 / 3 305 $133,299,987 $437,049 93.0% 84.4% 2009 / 2 299 $161,040,674 $538,598 91.5% 82.3% 2009 / 1 233 $110,942,251 $476,147 93.0% 85.3% 2008 / 4 219 $105,358,458 $481,089 92.6% 86.7% 2008 / 3 264 $133,049,000 $503,973 94.5% 87.8% 2008 / 2 339 $227,653,664 $671,545 93.3% 87.5% 2008 / 1 238 $180,932,392 $760,220 93.2% 89.2% 1 Yr Trend 31.3% 40.8% 7.2% -0.7% 1.1% 2 Yr Trend 28.6% -13.7% -32.9% -0.9% -3.3% 4/22/2010 Copyright (C) 2010 Real Data Strategies, Inc. All rights reserved. 1
- 10. 12 Month Market Summary Desert Area MLS 9 Quarter History / 1 and 2 Yr Trends 4/1/2009-3/31/2010 Twelve Month Summary and Market Trends: Palm Desert Yr/Qtr LS Units LS Volume Avg Sale Price ASP/ALP ASP/AOLP Q2/2009-Q1/2010 1,387 $480,418,229 $346,372 92.9% 85.9% Yr/Qtr LS Units LS Volume Avg Sale Price ASP/ALP ASP/AOLP 2010 / 1 355 $133,563,268 $376,235 93.3% 88.4% 2009 / 4 351 $107,243,401 $305,537 93.9% 86.9% 2009 / 3 303 $103,459,255 $341,450 92.0% 84.1% 2009 / 2 378 $136,152,305 $360,191 92.5% 84.1% 2009 / 1 184 $73,619,885 $400,108 93.1% 87.6% 2008 / 4 194 $69,851,980 $360,062 93.6% 88.7% 2008 / 3 267 $122,891,365 $460,267 93.0% 87.1% 2008 / 2 378 $203,325,973 $537,899 93.7% 88.6% 2008 / 1 305 $173,196,042 $567,856 93.9% 90.3% 1 Yr Trend 92.9% 81.4% -6.0% 0.3% 0.9% 2 Yr Trend 16.4% -22.9% -33.7% -0.6% -2.1% 4/22/2010 Copyright (C) 2010 Real Data Strategies, Inc. All rights reserved. 1
- 11. 12 Month Market Summary Desert Area MLS 9 Quarter History / 1 and 2 Yr Trends 4/1/2009-3/31/2010 Twelve Month Summary and Market Trends: Palm Springs Yr/Qtr LS Units LS Volume Avg Sale Price ASP/ALP ASP/AOLP Q2/2009-Q1/2010 1,500 $441,276,987 $294,185 93.4% 85.5% Yr/Qtr LS Units LS Volume Avg Sale Price ASP/ALP ASP/AOLP 2010 / 1 365 $110,182,063 $301,869 92.9% 86.0% 2009 / 4 364 $111,024,744 $305,013 94.7% 88.2% 2009 / 3 383 $111,303,847 $290,611 93.7% 86.2% 2009 / 2 388 $108,766,333 $280,326 92.4% 81.7% 2009 / 1 228 $73,967,733 $324,420 92.6% 81.8% 2008 / 4 254 $85,939,041 $338,343 94.3% 84.8% 2008 / 3 316 $117,606,662 $372,173 94.5% 87.1% 2008 / 2 369 $144,328,011 $391,133 92.9% 87.3% 2008 / 1 248 $105,006,800 $423,415 94.2% 88.9% 1 Yr Trend 60.1% 49.0% -7.0% 0.3% 5.2% 2 Yr Trend 47.2% 4.9% -28.7% -1.3% -3.3% 4/22/2010 Copyright (C) 2010 Real Data Strategies, Inc. All rights reserved. 1
- 12. 12 Month Market Summary Desert Area MLS 9 Quarter History / 1 and 2 Yr Trends 4/1/2009-3/31/2010 Twelve Month Summary and Market Trends: Rancho Mirage Yr/Qtr LS Units LS Volume Avg Sale Price ASP/ALP ASP/AOLP Q2/2009-Q1/2010 568 $328,556,805 $578,445 91.7% 82.6% Yr/Qtr LS Units LS Volume Avg Sale Price ASP/ALP ASP/AOLP 2010 / 1 162 $91,882,976 $567,179 92.2% 84.7% 2009 / 4 143 $79,190,836 $553,782 91.2% 83.1% 2009 / 3 126 $77,337,700 $613,791 92.0% 82.6% 2009 / 2 137 $80,145,293 $585,002 91.3% 79.8% 2009 / 1 90 $58,051,939 $645,022 91.6% 86.2% 2008 / 4 98 $58,190,560 $593,781 92.7% 88.3% 2008 / 3 122 $68,906,369 $564,806 93.9% 87.8% 2008 / 2 186 $138,253,125 $743,296 93.0% 87.8% 2008 / 1 151 $117,720,990 $779,609 92.7% 87.9% 1 Yr Trend 80.0% 58.3% -12.1% 0.6% -1.7% 2 Yr Trend 7.3% -21.9% -27.2% -0.6% -3.6% 4/22/2010 Copyright (C) 2010 Real Data Strategies, Inc. All rights reserved. 1
- 13. 12 Month Market Summary Desert Area MLS 9 Quarter History / 1 and 2 Yr Trends 4/1/2009-3/31/2010 Twelve Month Summary and Market Trends: Salton City Yr/Qtr LS Units LS Volume Avg Sale Price ASP/ALP ASP/AOLP Q2/2009-Q1/2010 290 $16,838,373 $58,063 97.1% 82.7% Yr/Qtr LS Units LS Volume Avg Sale Price ASP/ALP ASP/AOLP 2010 / 1 57 $3,445,802 $60,453 97.4% 87.6% 2009 / 4 73 $4,628,171 $63,400 98.0% 87.3% 2009 / 3 48 $2,799,758 $58,328 96.9% 76.9% 2009 / 2 112 $5,964,642 $53,256 96.0% 79.0% 2009 / 1 26 $1,707,350 $65,667 88.4% 72.2% 2008 / 4 19 $1,297,390 $68,284 91.9% 70.8% 2008 / 3 14 $1,555,700 $111,121 87.9% 74.9% 2008 / 2 19 $2,273,800 $119,674 88.0% 77.3% 2008 / 1 34 $4,943,400 $145,394 97.1% 85.9% 1 Yr Trend 119.2% 101.8% -7.9% 10.3% 21.3% 2 Yr Trend 67.6% -30.3% -58.4% 0.4% 1.9% 4/22/2010 Copyright (C) 2010 Real Data Strategies, Inc. All rights reserved. 1
- 14. 12 Month Market Summary Desert Area MLS 9 Quarter History / 1 and 2 Yr Trends 4/1/2009-3/31/2010 Twelve Month Summary and Market Trends: Thermal Yr/Qtr LS Units LS Volume Avg Sale Price ASP/ALP ASP/AOLP Q2/2009-Q1/2010 98 $7,078,155 $72,226 97.7% 90.5% Yr/Qtr LS Units LS Volume Avg Sale Price ASP/ALP ASP/AOLP 2010 / 1 16 $960,800 $60,050 98.8% 95.5% 2009 / 4 12 $1,280,900 $106,742 94.1% 93.4% 2009 / 3 34 $2,379,105 $69,974 102.1% 90.5% 2009 / 2 36 $2,457,350 $68,260 96.0% 82.6% 2009 / 1 63 $4,262,100 $67,652 93.5% 77.0% 2008 / 4 44 $3,787,750 $86,085 98.1% 87.5% 2008 / 3 22 $2,472,450 $112,384 91.6% 80.9% 2008 / 2 6 $766,500 $127,750 95.1% 75.0% 2008 / 1 2 $380,000 $190,000 86.6% 64.4% 1 Yr Trend -74.6% -77.5% -11.2% 5.7% 23.9% 2 Yr Trend 700.0% 152.8% -68.4% 14.1% 48.2% 4/22/2010 Copyright (C) 2010 Real Data Strategies, Inc. All rights reserved. 1
- 15. 12 Month Market Summary Desert Area MLS 9 Quarter History / 1 and 2 Yr Trends 4/1/2009-3/31/2010 Twelve Month Summary and Market Trends: Thousand Palms Yr/Qtr LS Units LS Volume Avg Sale Price ASP/ALP ASP/AOLP Q2/2009-Q1/2010 91 $10,794,410 $118,620 96.7% 87.4% Yr/Qtr LS Units LS Volume Avg Sale Price ASP/ALP ASP/AOLP 2010 / 1 16 $1,910,760 $119,423 91.3% 81.2% 2009 / 4 12 $1,276,300 $106,358 104.1% 96.5% 2009 / 3 22 $2,939,350 $133,607 96.7% 88.5% 2009 / 2 41 $4,668,000 $113,854 94.7% 83.6% 2009 / 1 32 $4,142,297 $129,447 94.0% 84.7% 2008 / 4 23 $3,430,200 $149,139 96.8% 83.9% 2008 / 3 11 $2,006,400 $182,400 98.3% 91.0% 2008 / 2 14 $3,091,300 $220,807 92.0% 88.7% 2008 / 1 14 $3,247,800 $231,986 93.7% 91.2% 1 Yr Trend -50.0% -53.9% -7.7% -2.9% -4.1% 2 Yr Trend 14.3% -41.2% -48.5% -2.6% -11.0% 4/22/2010 Copyright (C) 2010 Real Data Strategies, Inc. All rights reserved. 1
- 16. 12 Month Market Summary Desert Area MLS 9 Quarter History / 1 and 2 Yr Trends 4/1/2009-3/31/2010 Twelve Month Summary and Market Trends: Twenty-Nine Palms Yr/Qtr LS Units LS Volume Avg Sale Price ASP/ALP ASP/AOLP Q2/2009-Q1/2010 72 $6,619,707 $91,940 94.9% 88.5% Yr/Qtr LS Units LS Volume Avg Sale Price ASP/ALP ASP/AOLP 2010 / 1 13 $1,565,400 $120,415 96.5% 93.0% 2009 / 4 15 $1,291,252 $86,083 98.1% 91.2% 2009 / 3 24 $2,082,555 $86,773 94.9% 87.0% 2009 / 2 20 $1,680,500 $84,025 90.0% 82.5% 2009 / 1 15 $1,540,800 $102,720 96.9% 88.1% 2008 / 4 16 $2,092,800 $130,800 97.0% 90.3% 2008 / 3 21 $2,084,479 $99,261 97.2% 91.8% 2008 / 2 15 $2,399,000 $159,933 95.8% 87.5% 2008 / 1 27 $2,699,350 $99,976 94.8% 86.3% 1 Yr Trend -13.3% 1.6% 17.2% -0.4% 5.6% 2 Yr Trend -51.9% -42.0% 20.4% 1.8% 7.9% 4/22/2010 Copyright (C) 2010 Real Data Strategies, Inc. All rights reserved. 1
- 17. 12 Month Market Summary Desert Area MLS 9 Quarter History / 1 and 2 Yr Trends 4/1/2009-3/31/2010 Twelve Month Summary and Market Trends: Yucca Valley Yr/Qtr LS Units LS Volume Avg Sale Price ASP/ALP ASP/AOLP Q2/2009-Q1/2010 219 $25,967,144 $118,571 94.9% 85.7% Yr/Qtr LS Units LS Volume Avg Sale Price ASP/ALP ASP/AOLP 2010 / 1 48 $5,389,100 $112,273 96.0% 87.8% 2009 / 4 54 $6,003,672 $111,179 93.8% 87.0% 2009 / 3 54 $7,666,096 $141,965 95.1% 86.1% 2009 / 2 63 $6,908,276 $109,655 94.7% 82.0% 2009 / 1 54 $7,210,020 $133,519 94.7% 81.8% 2008 / 4 47 $7,024,415 $149,456 95.8% 87.0% 2008 / 3 55 $9,847,837 $179,052 92.4% 84.7% 2008 / 2 46 $8,536,550 $185,577 93.3% 85.3% 2008 / 1 25 $5,516,415 $220,657 94.3% 88.5% 1 Yr Trend -11.1% -25.3% -15.9% 1.4% 7.3% 2 Yr Trend 92.0% -2.3% -49.1% 1.8% -0.8% 4/22/2010 Copyright (C) 2010 Real Data Strategies, Inc. All rights reserved. 1