Download to read offline


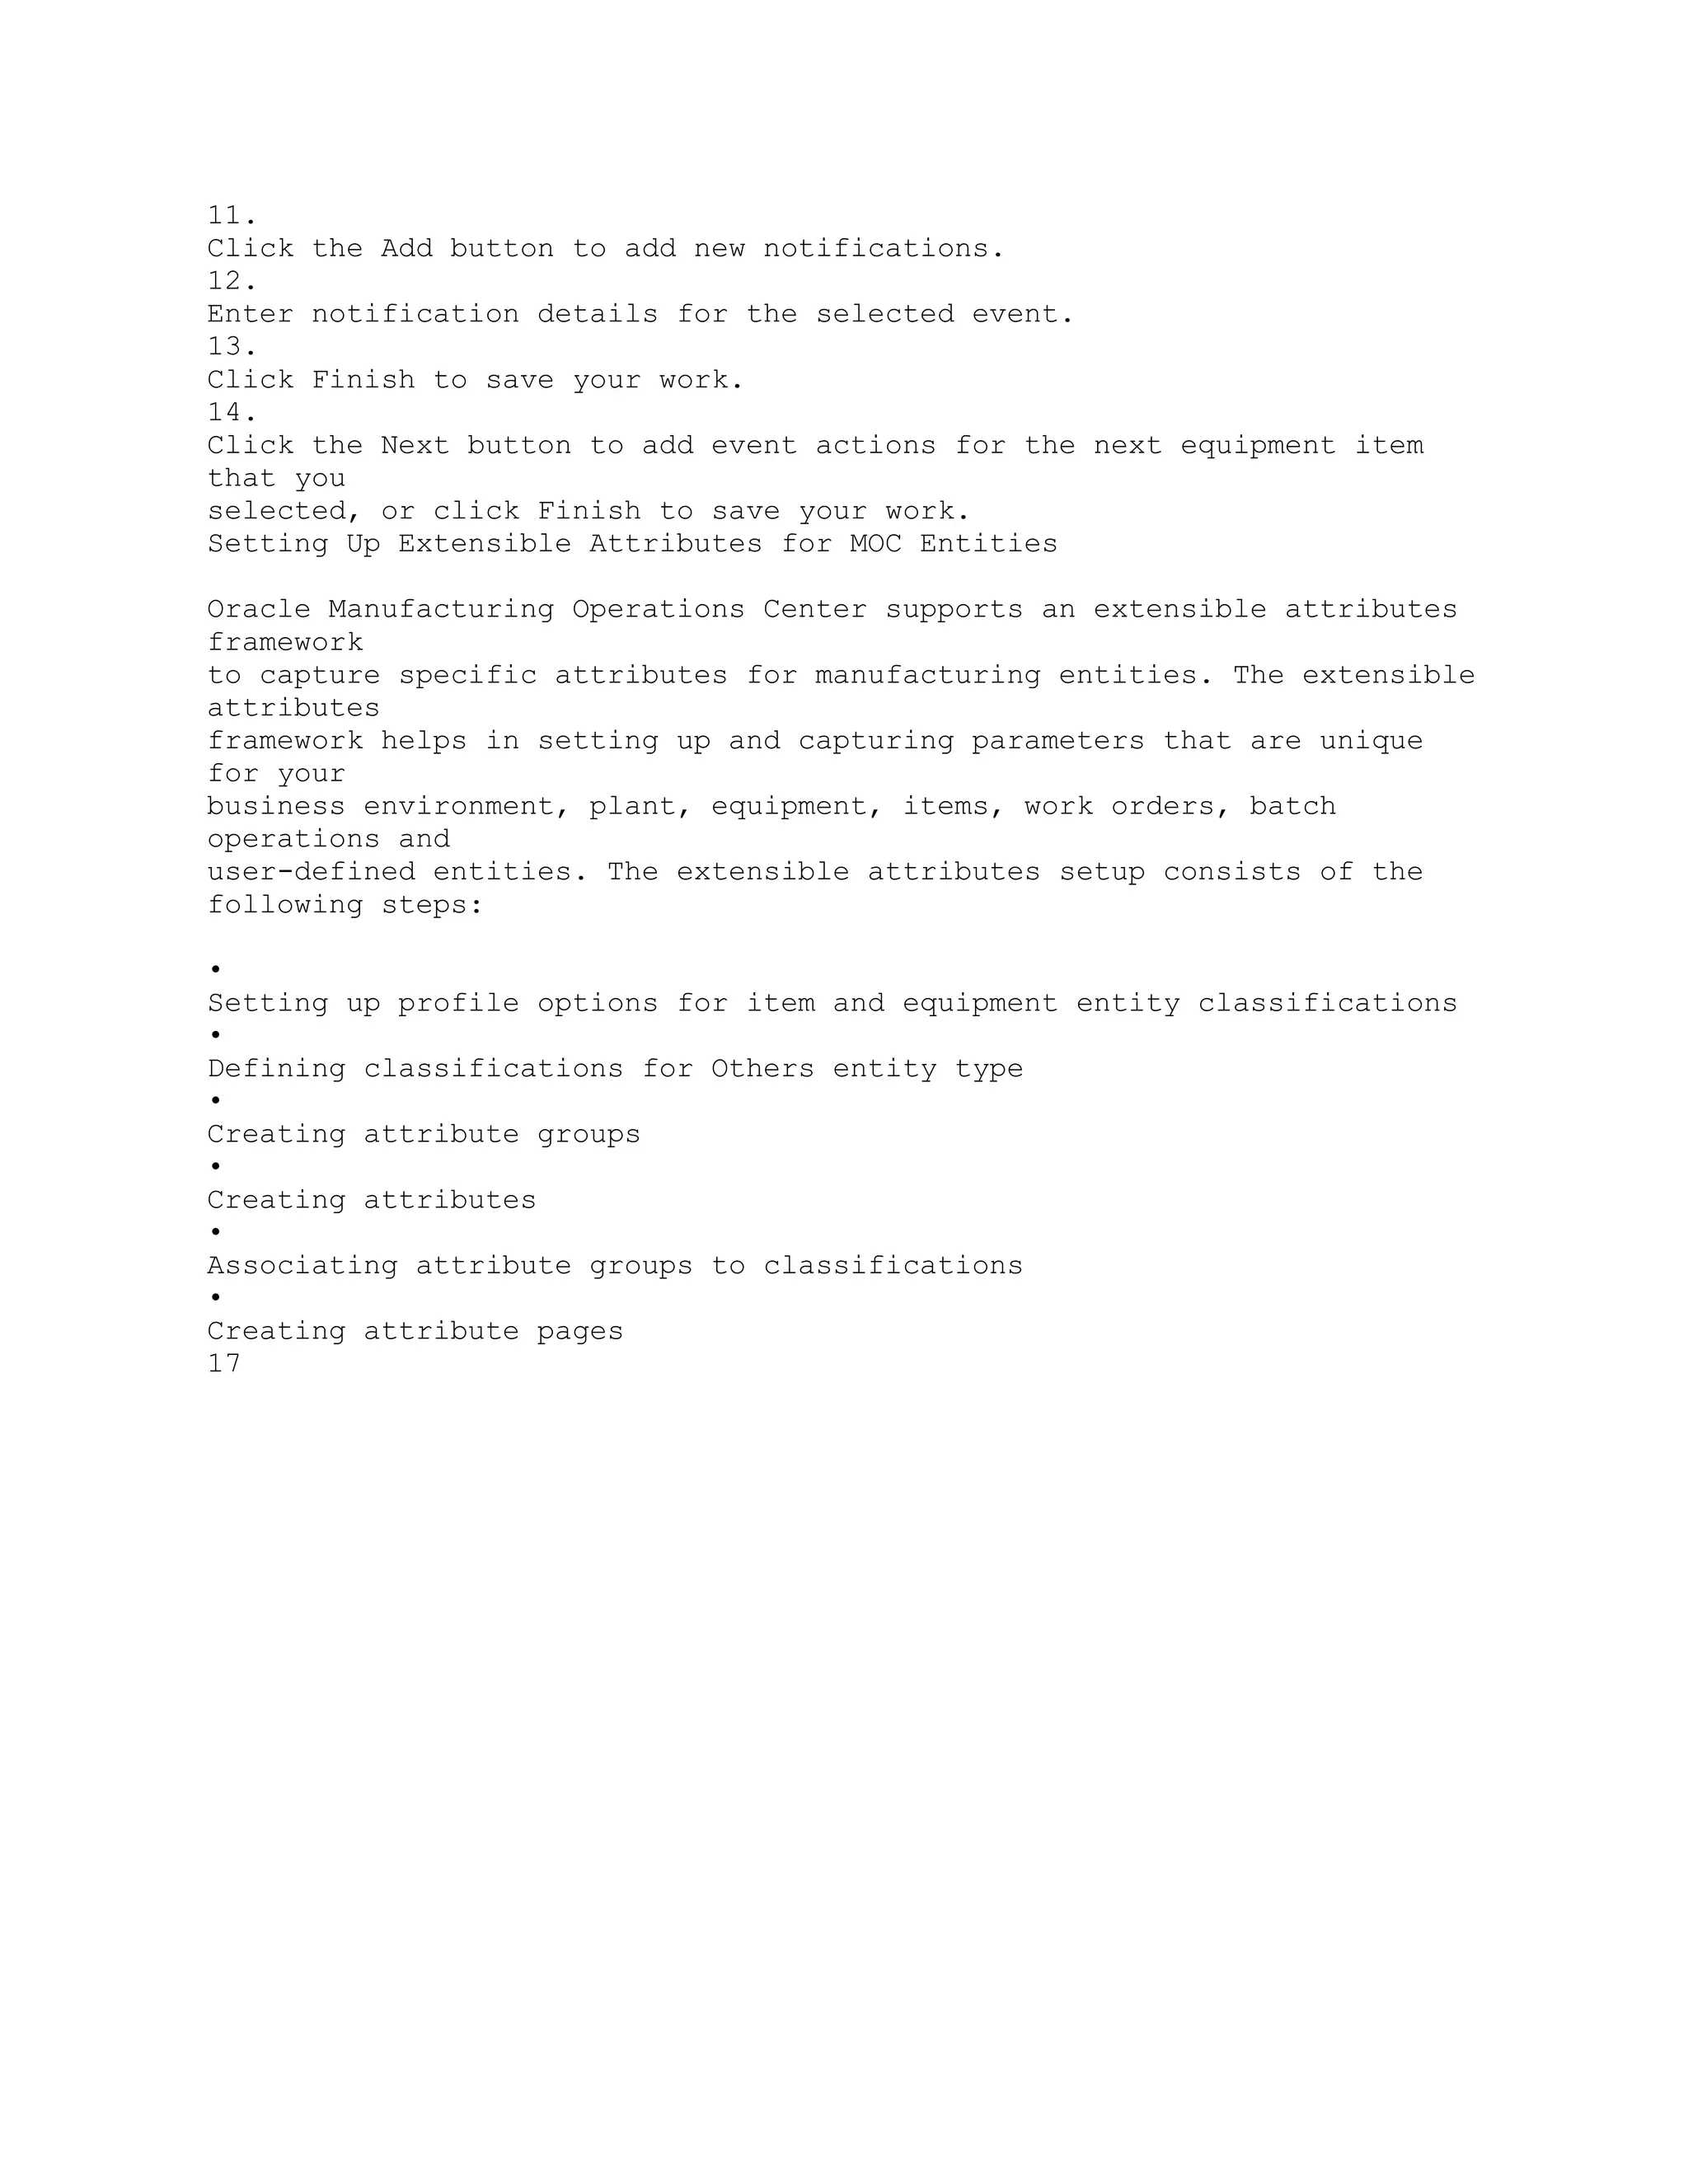


![A
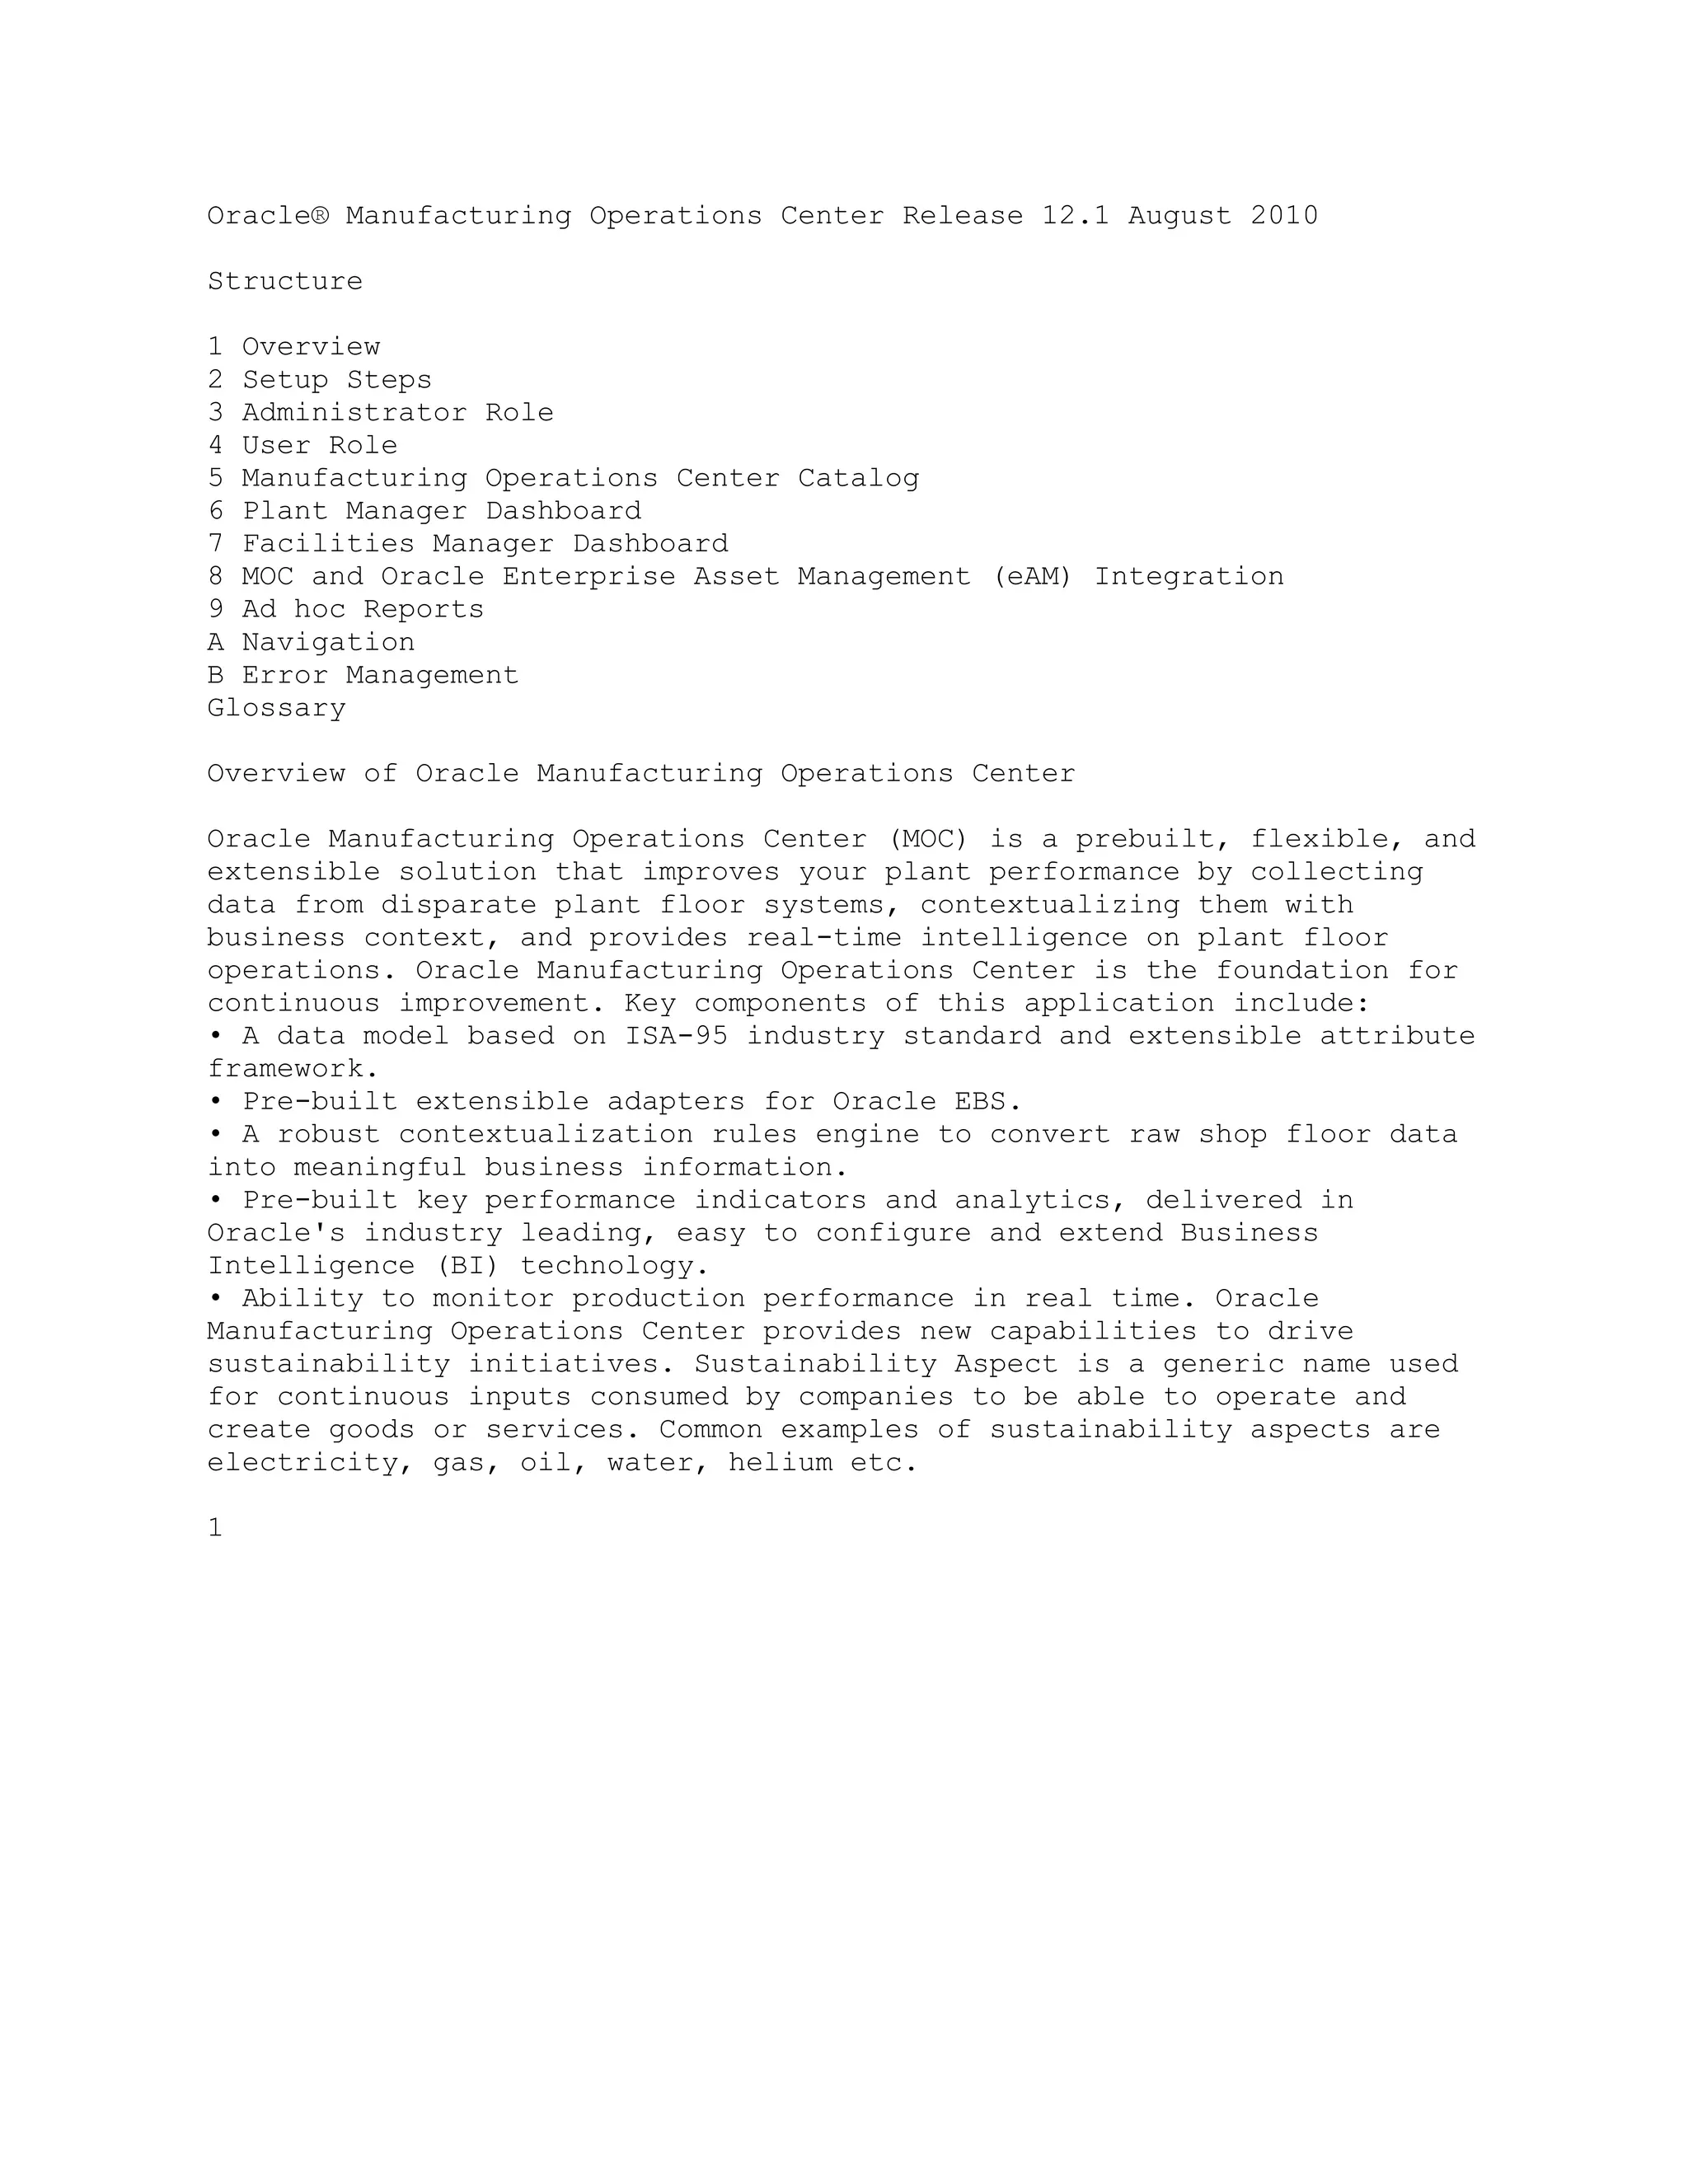
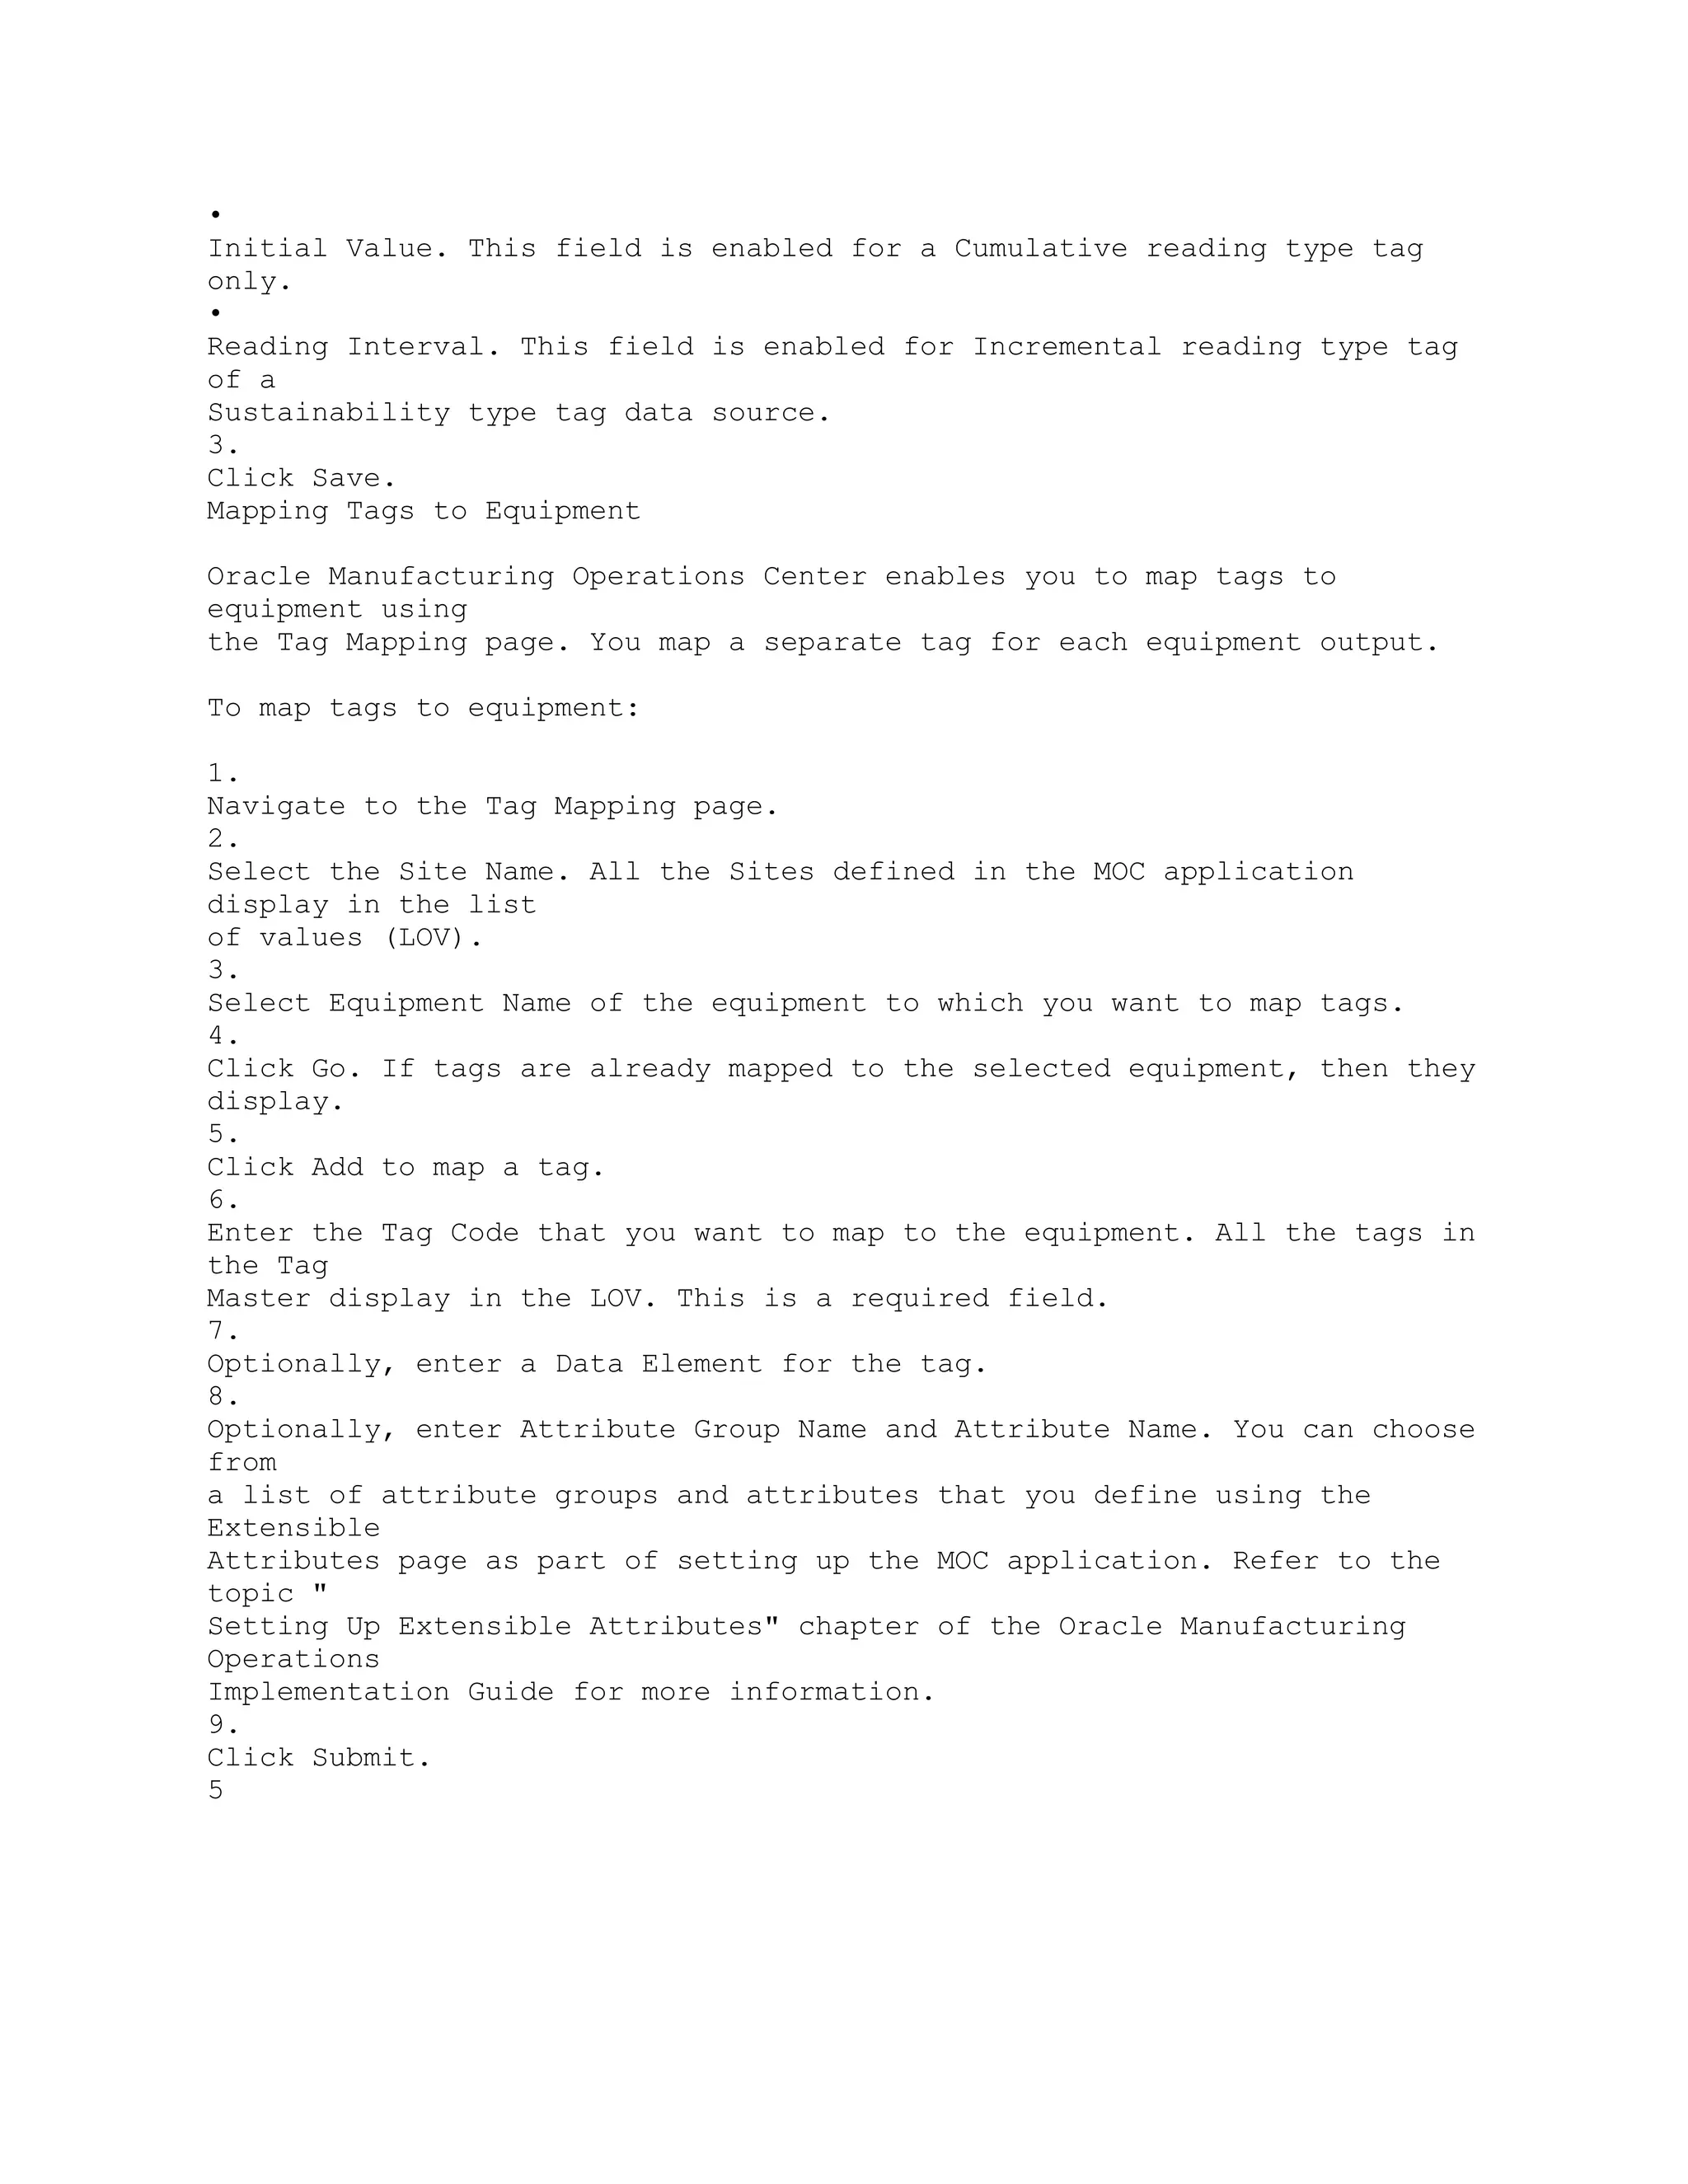
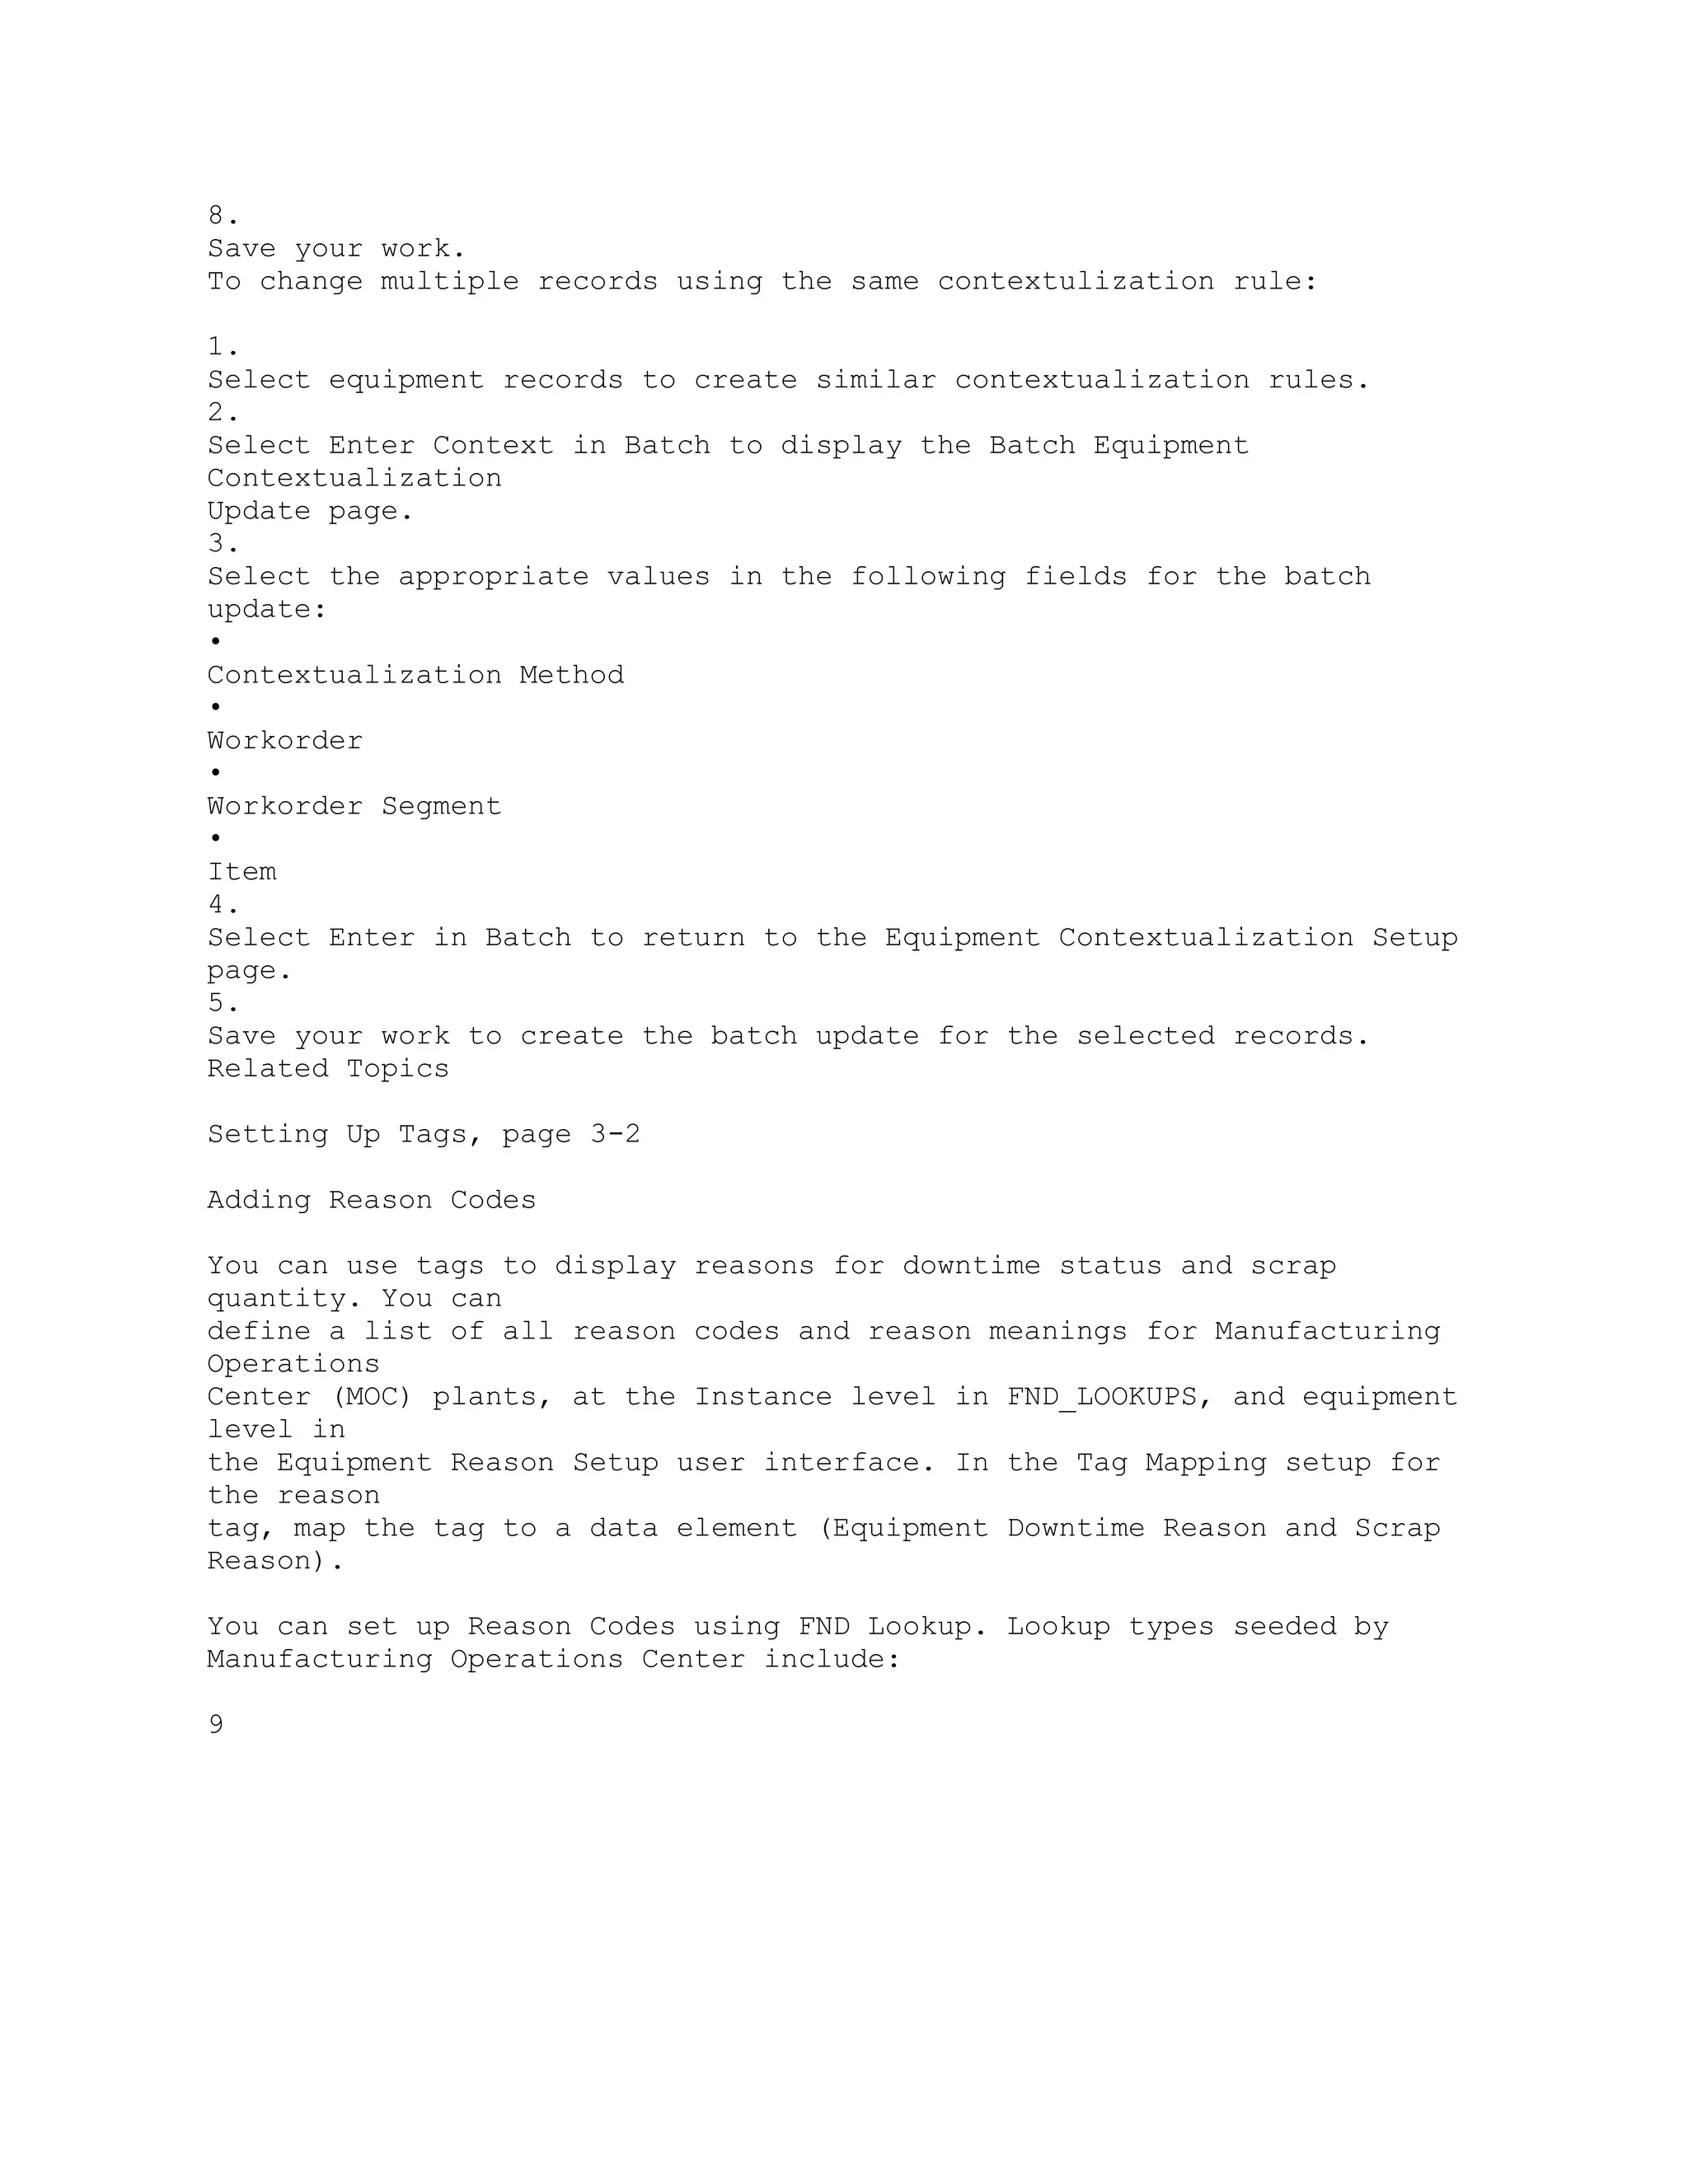
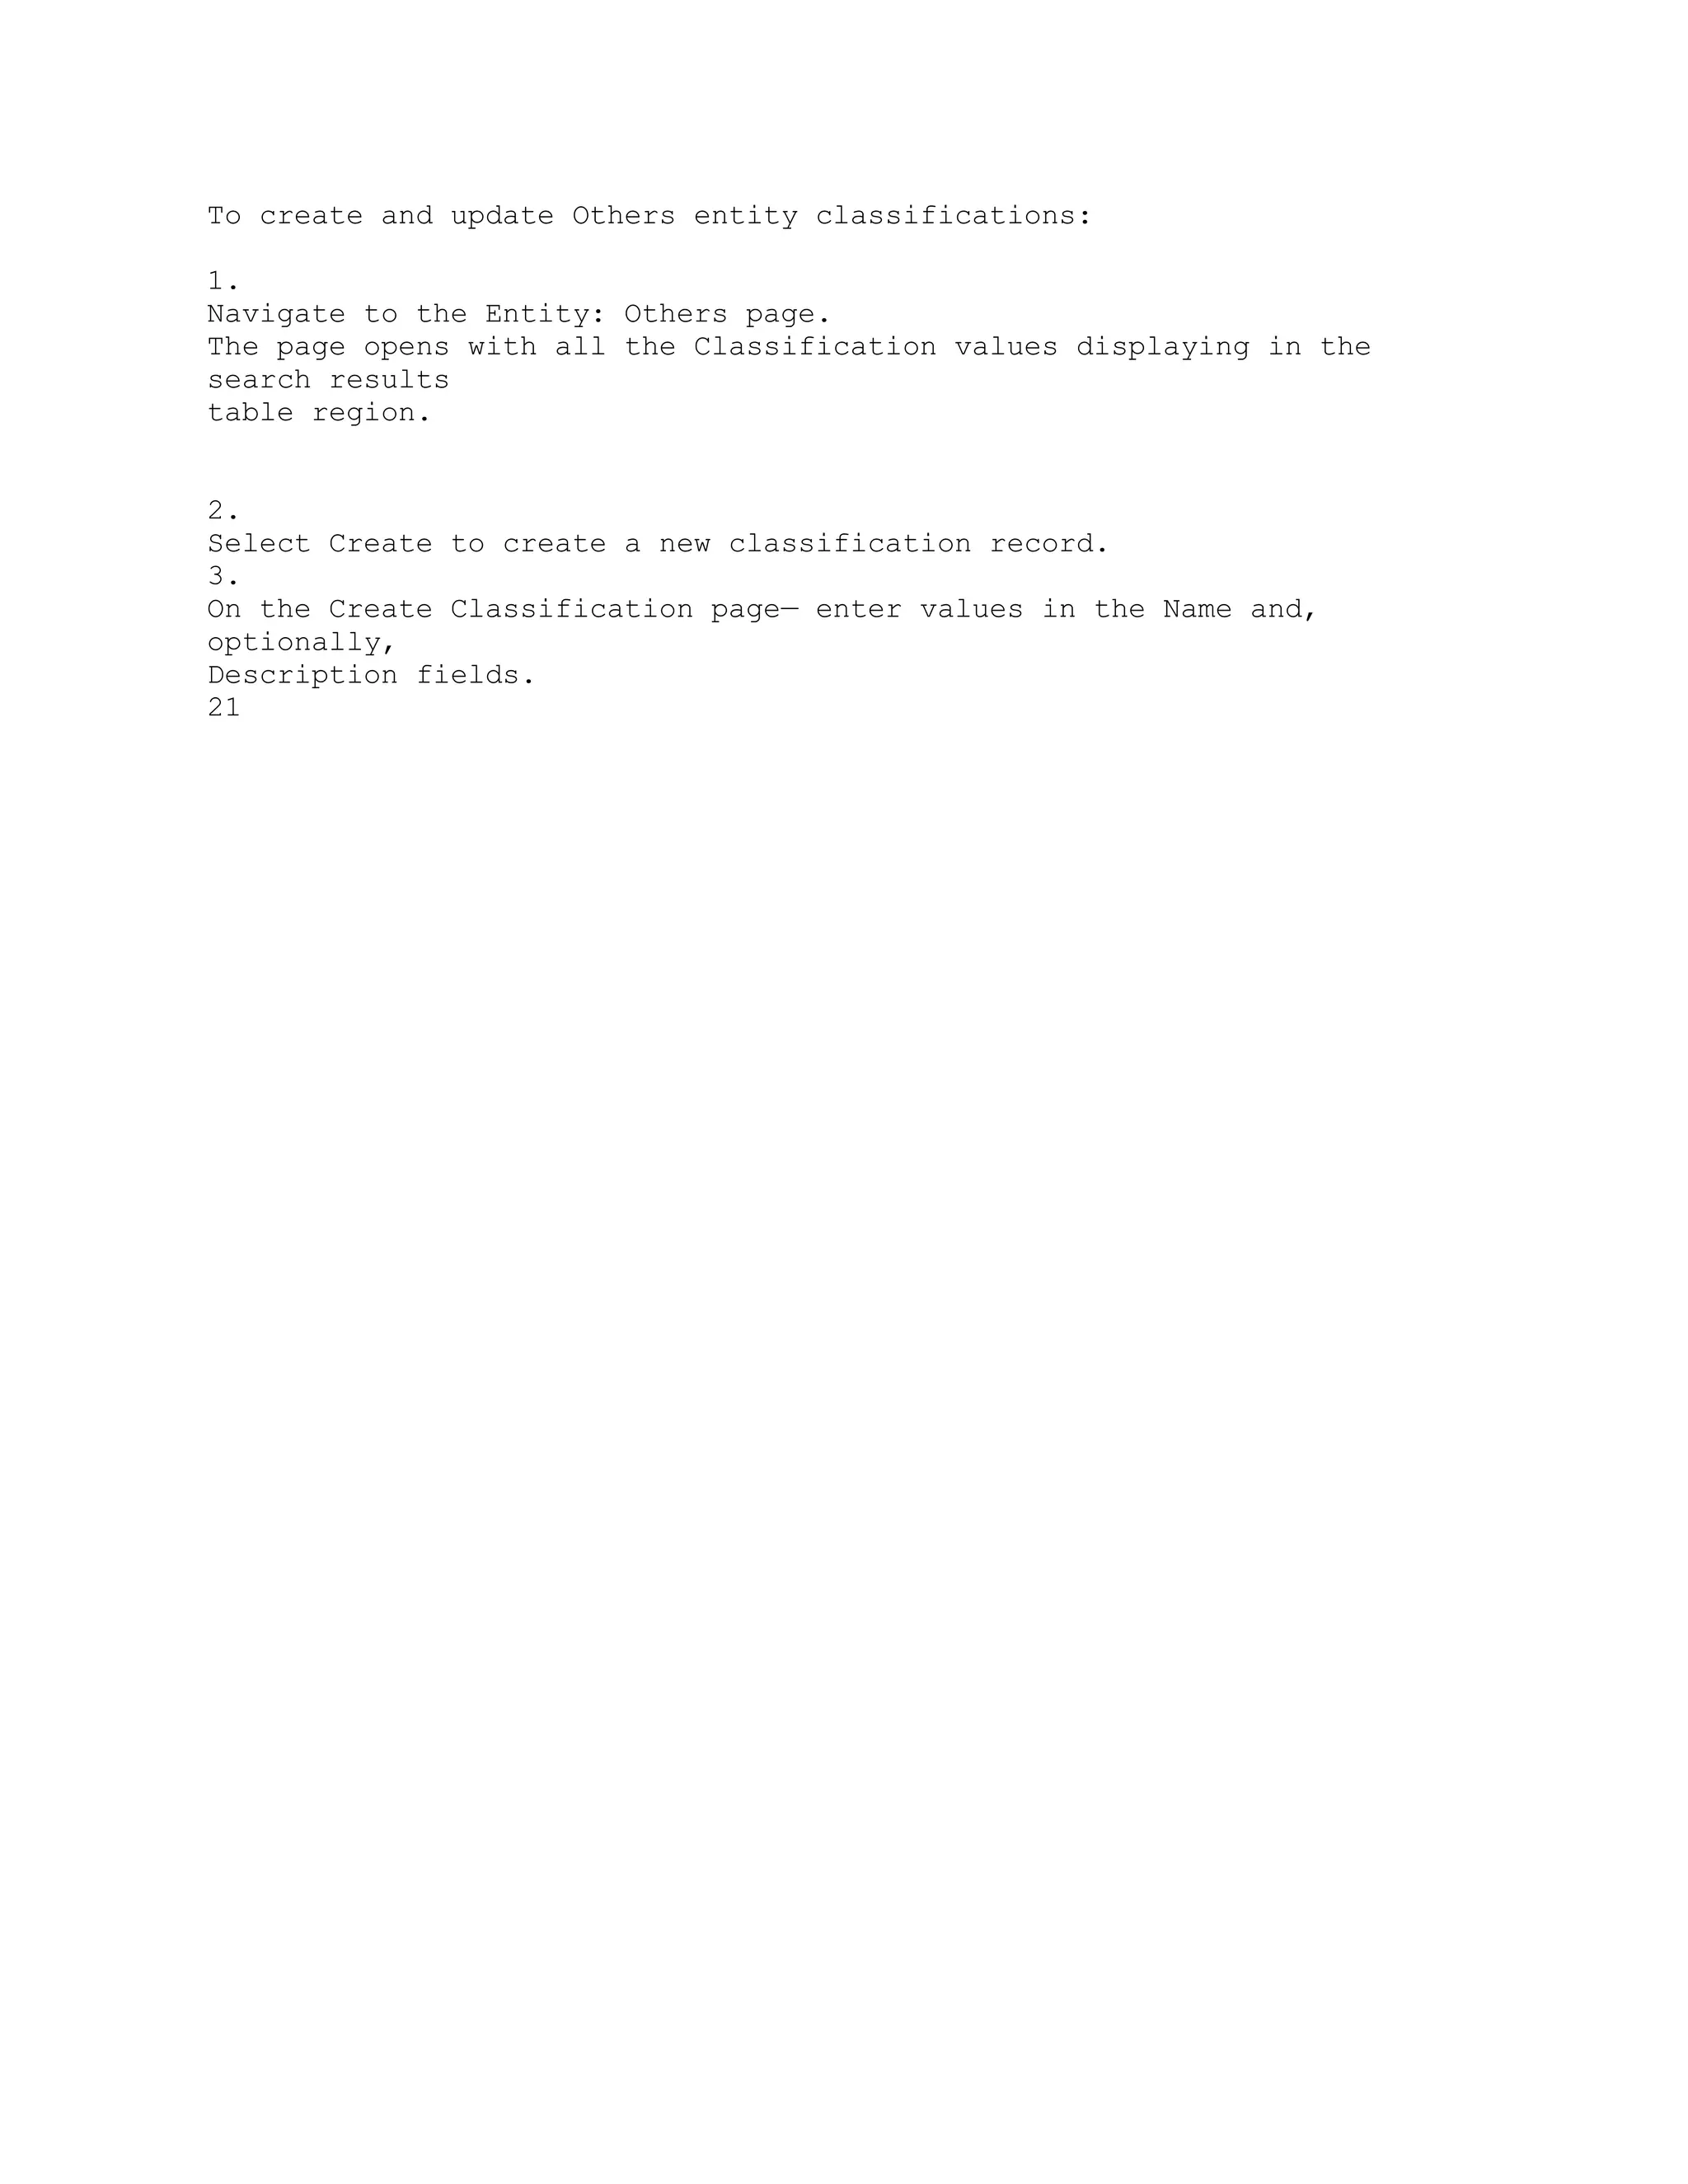
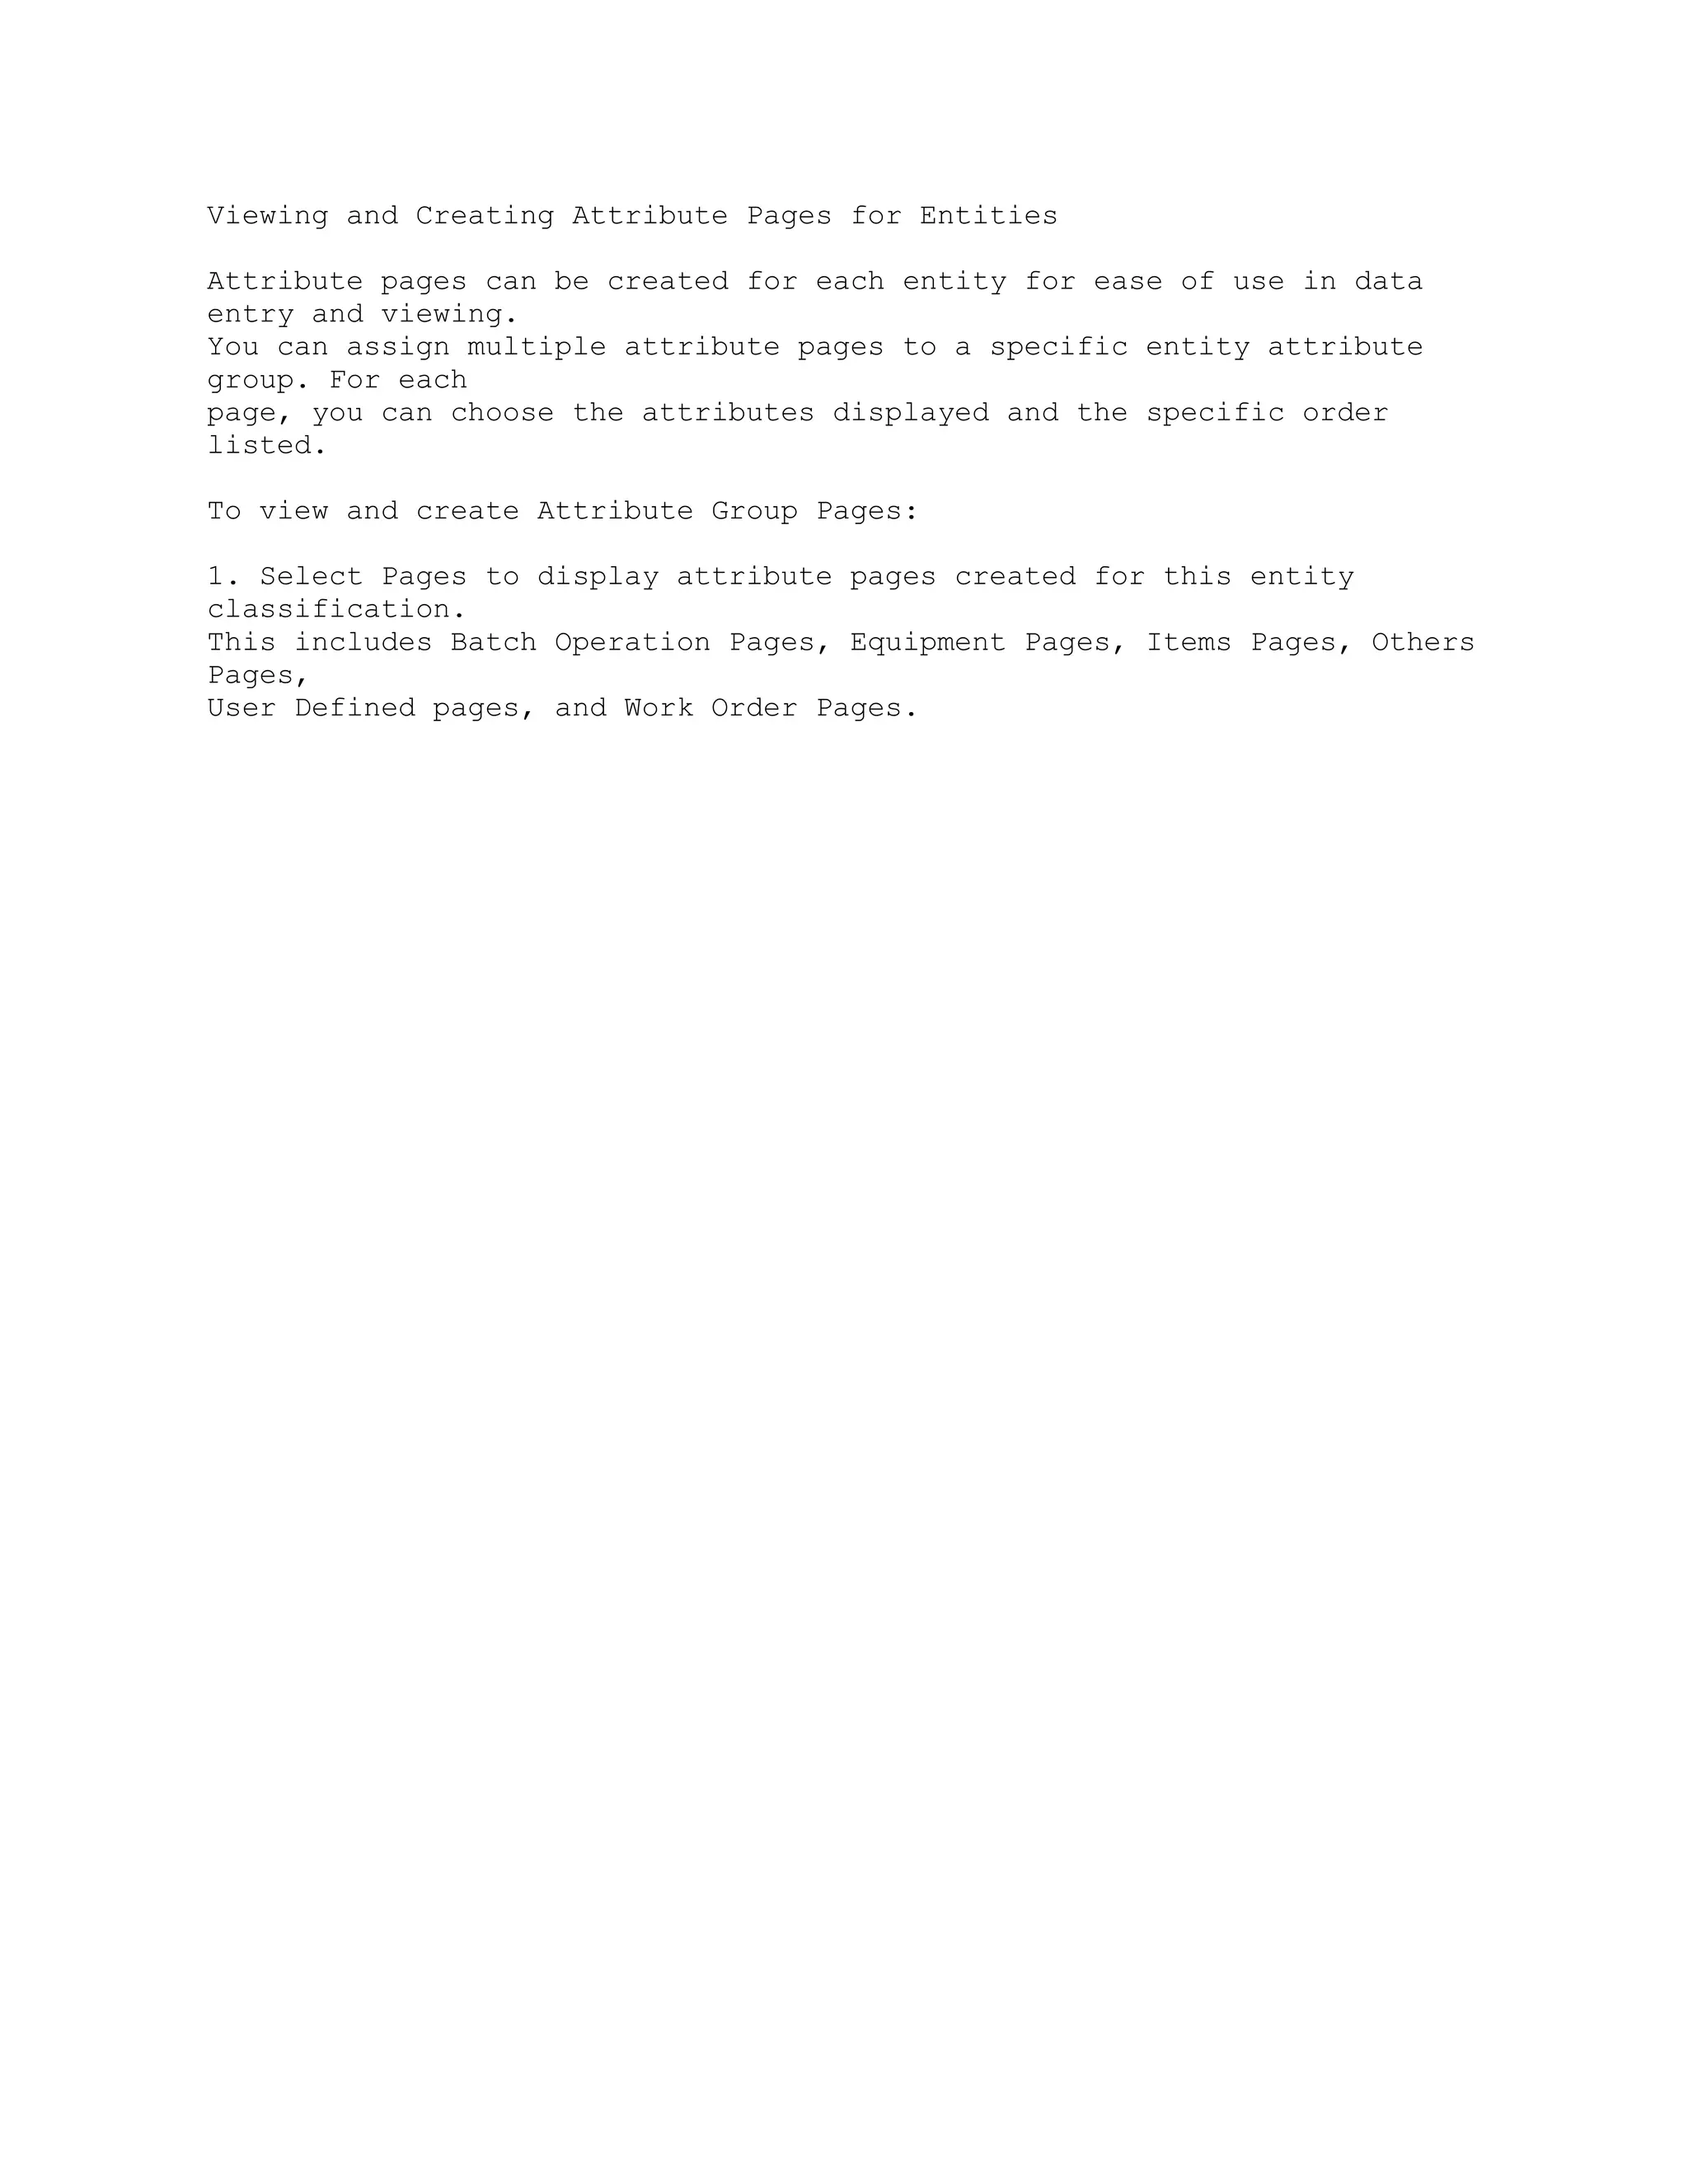
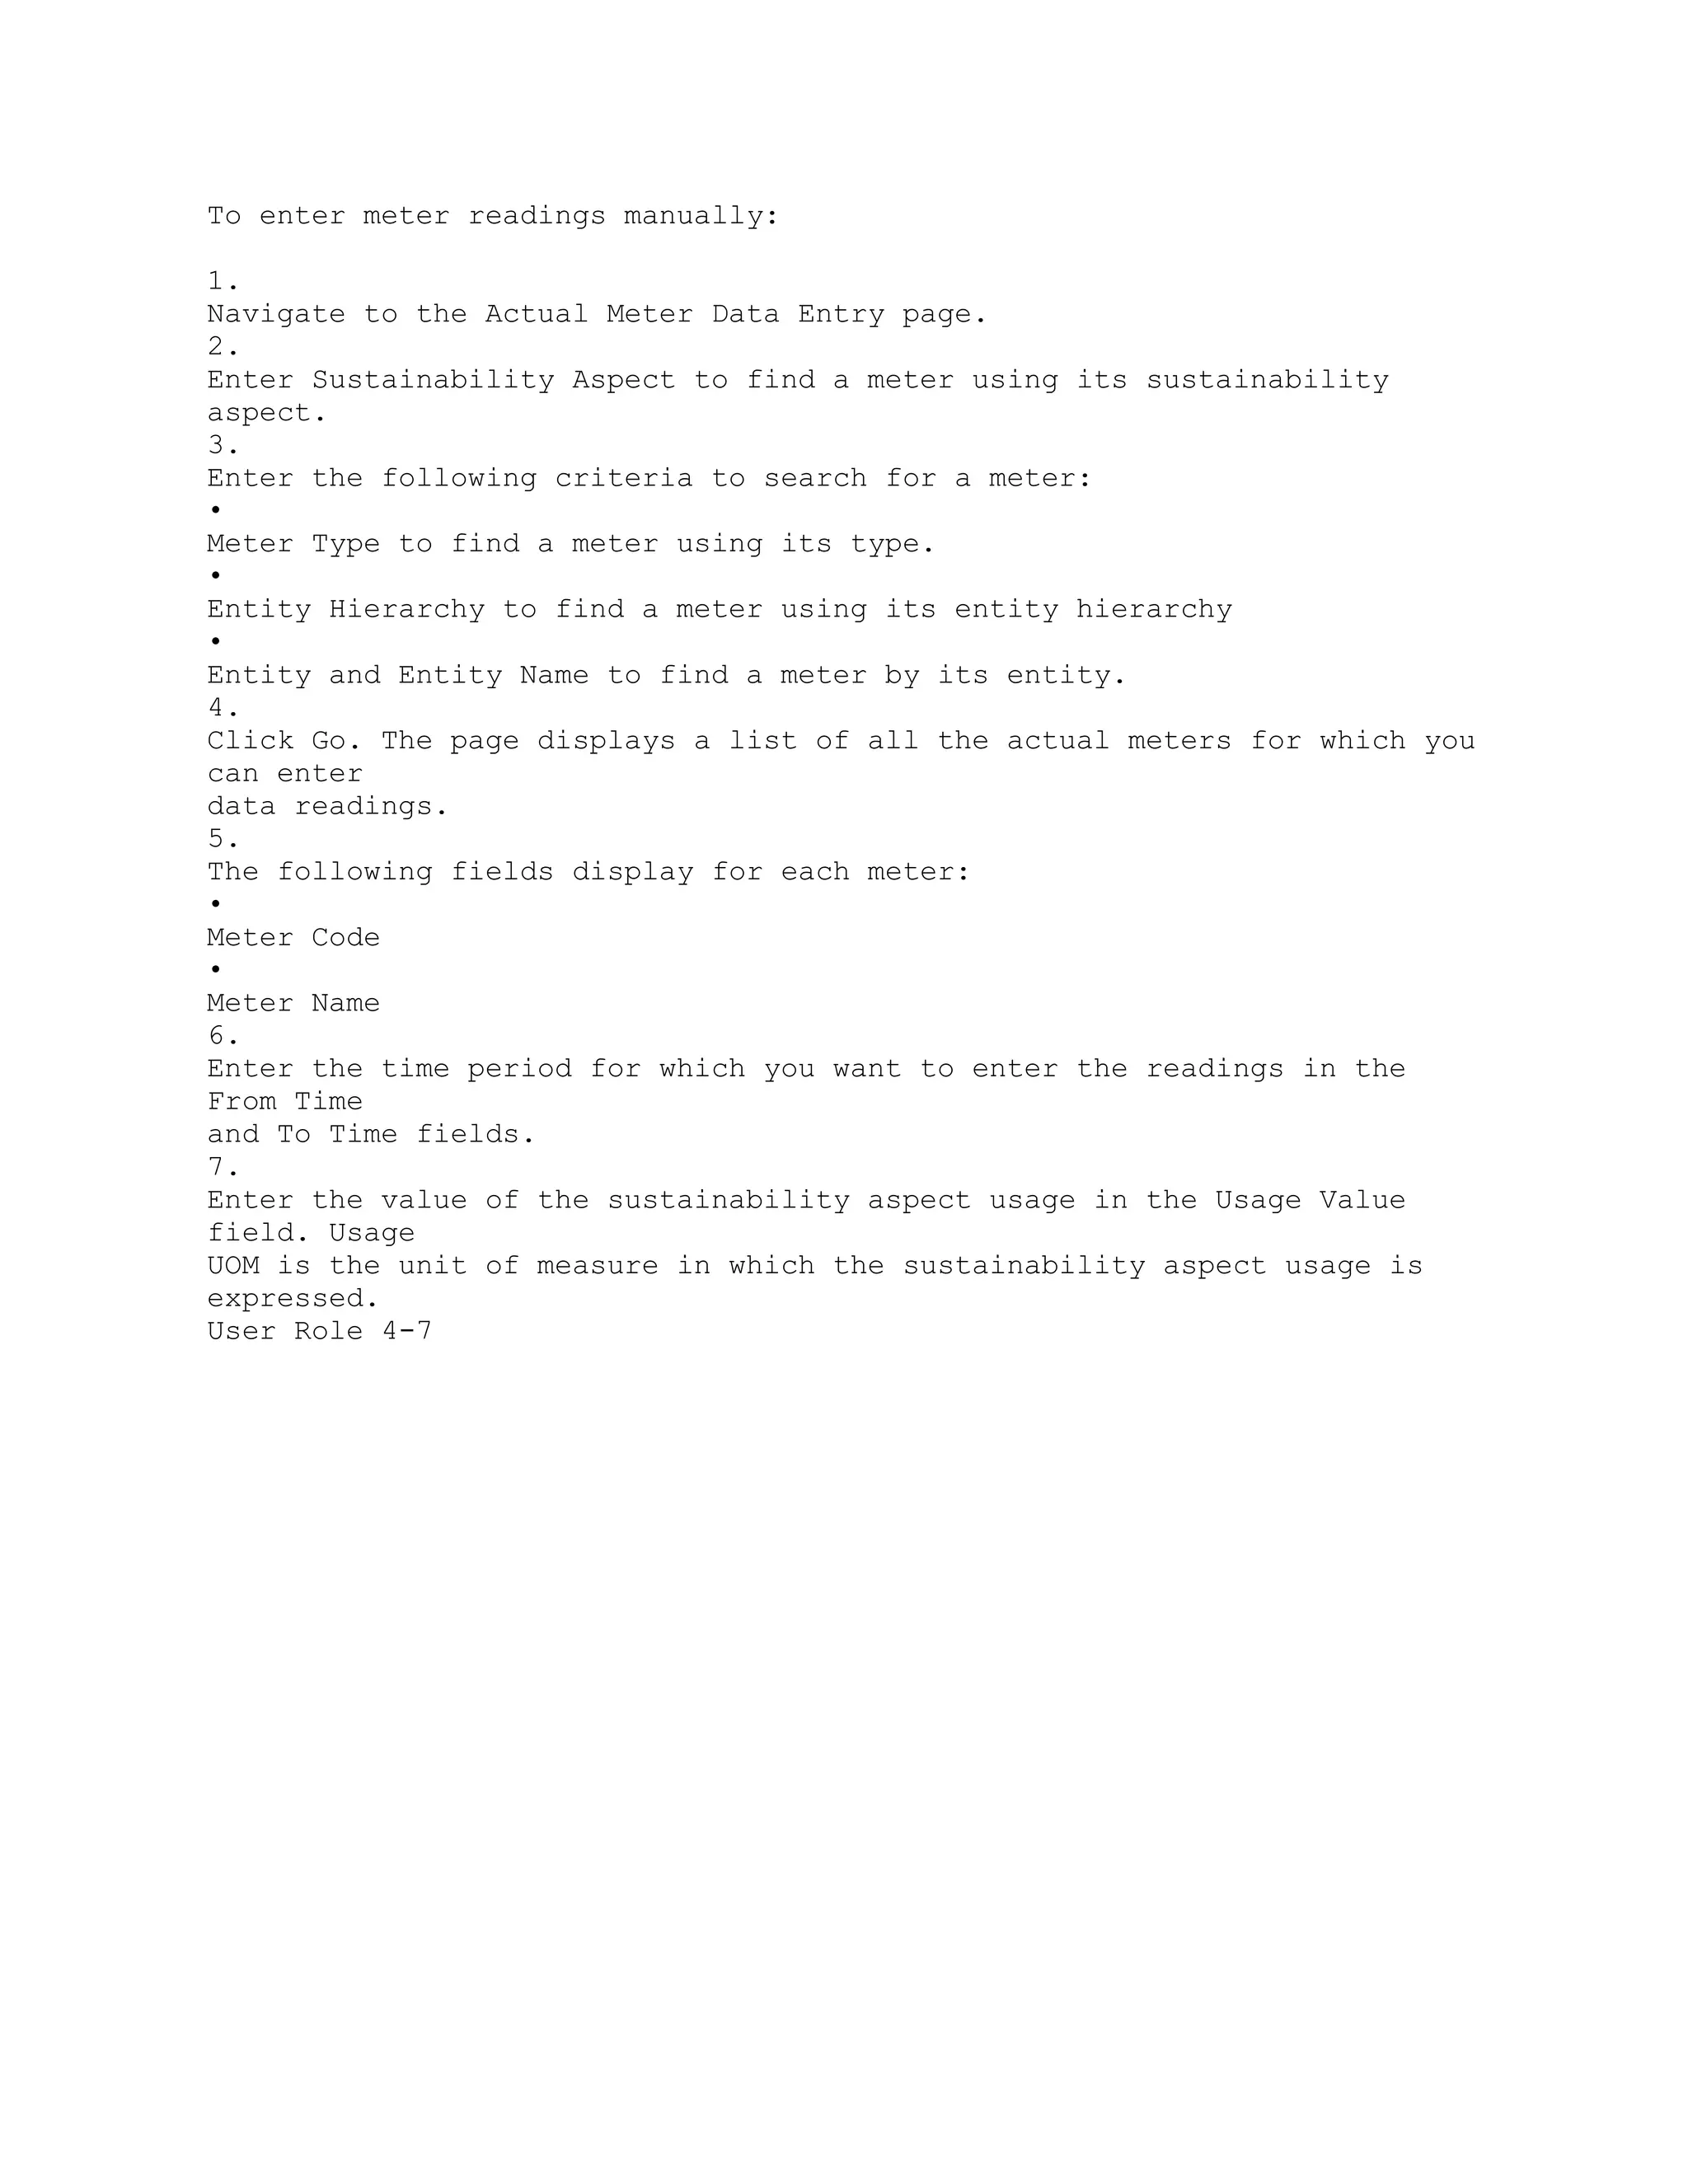
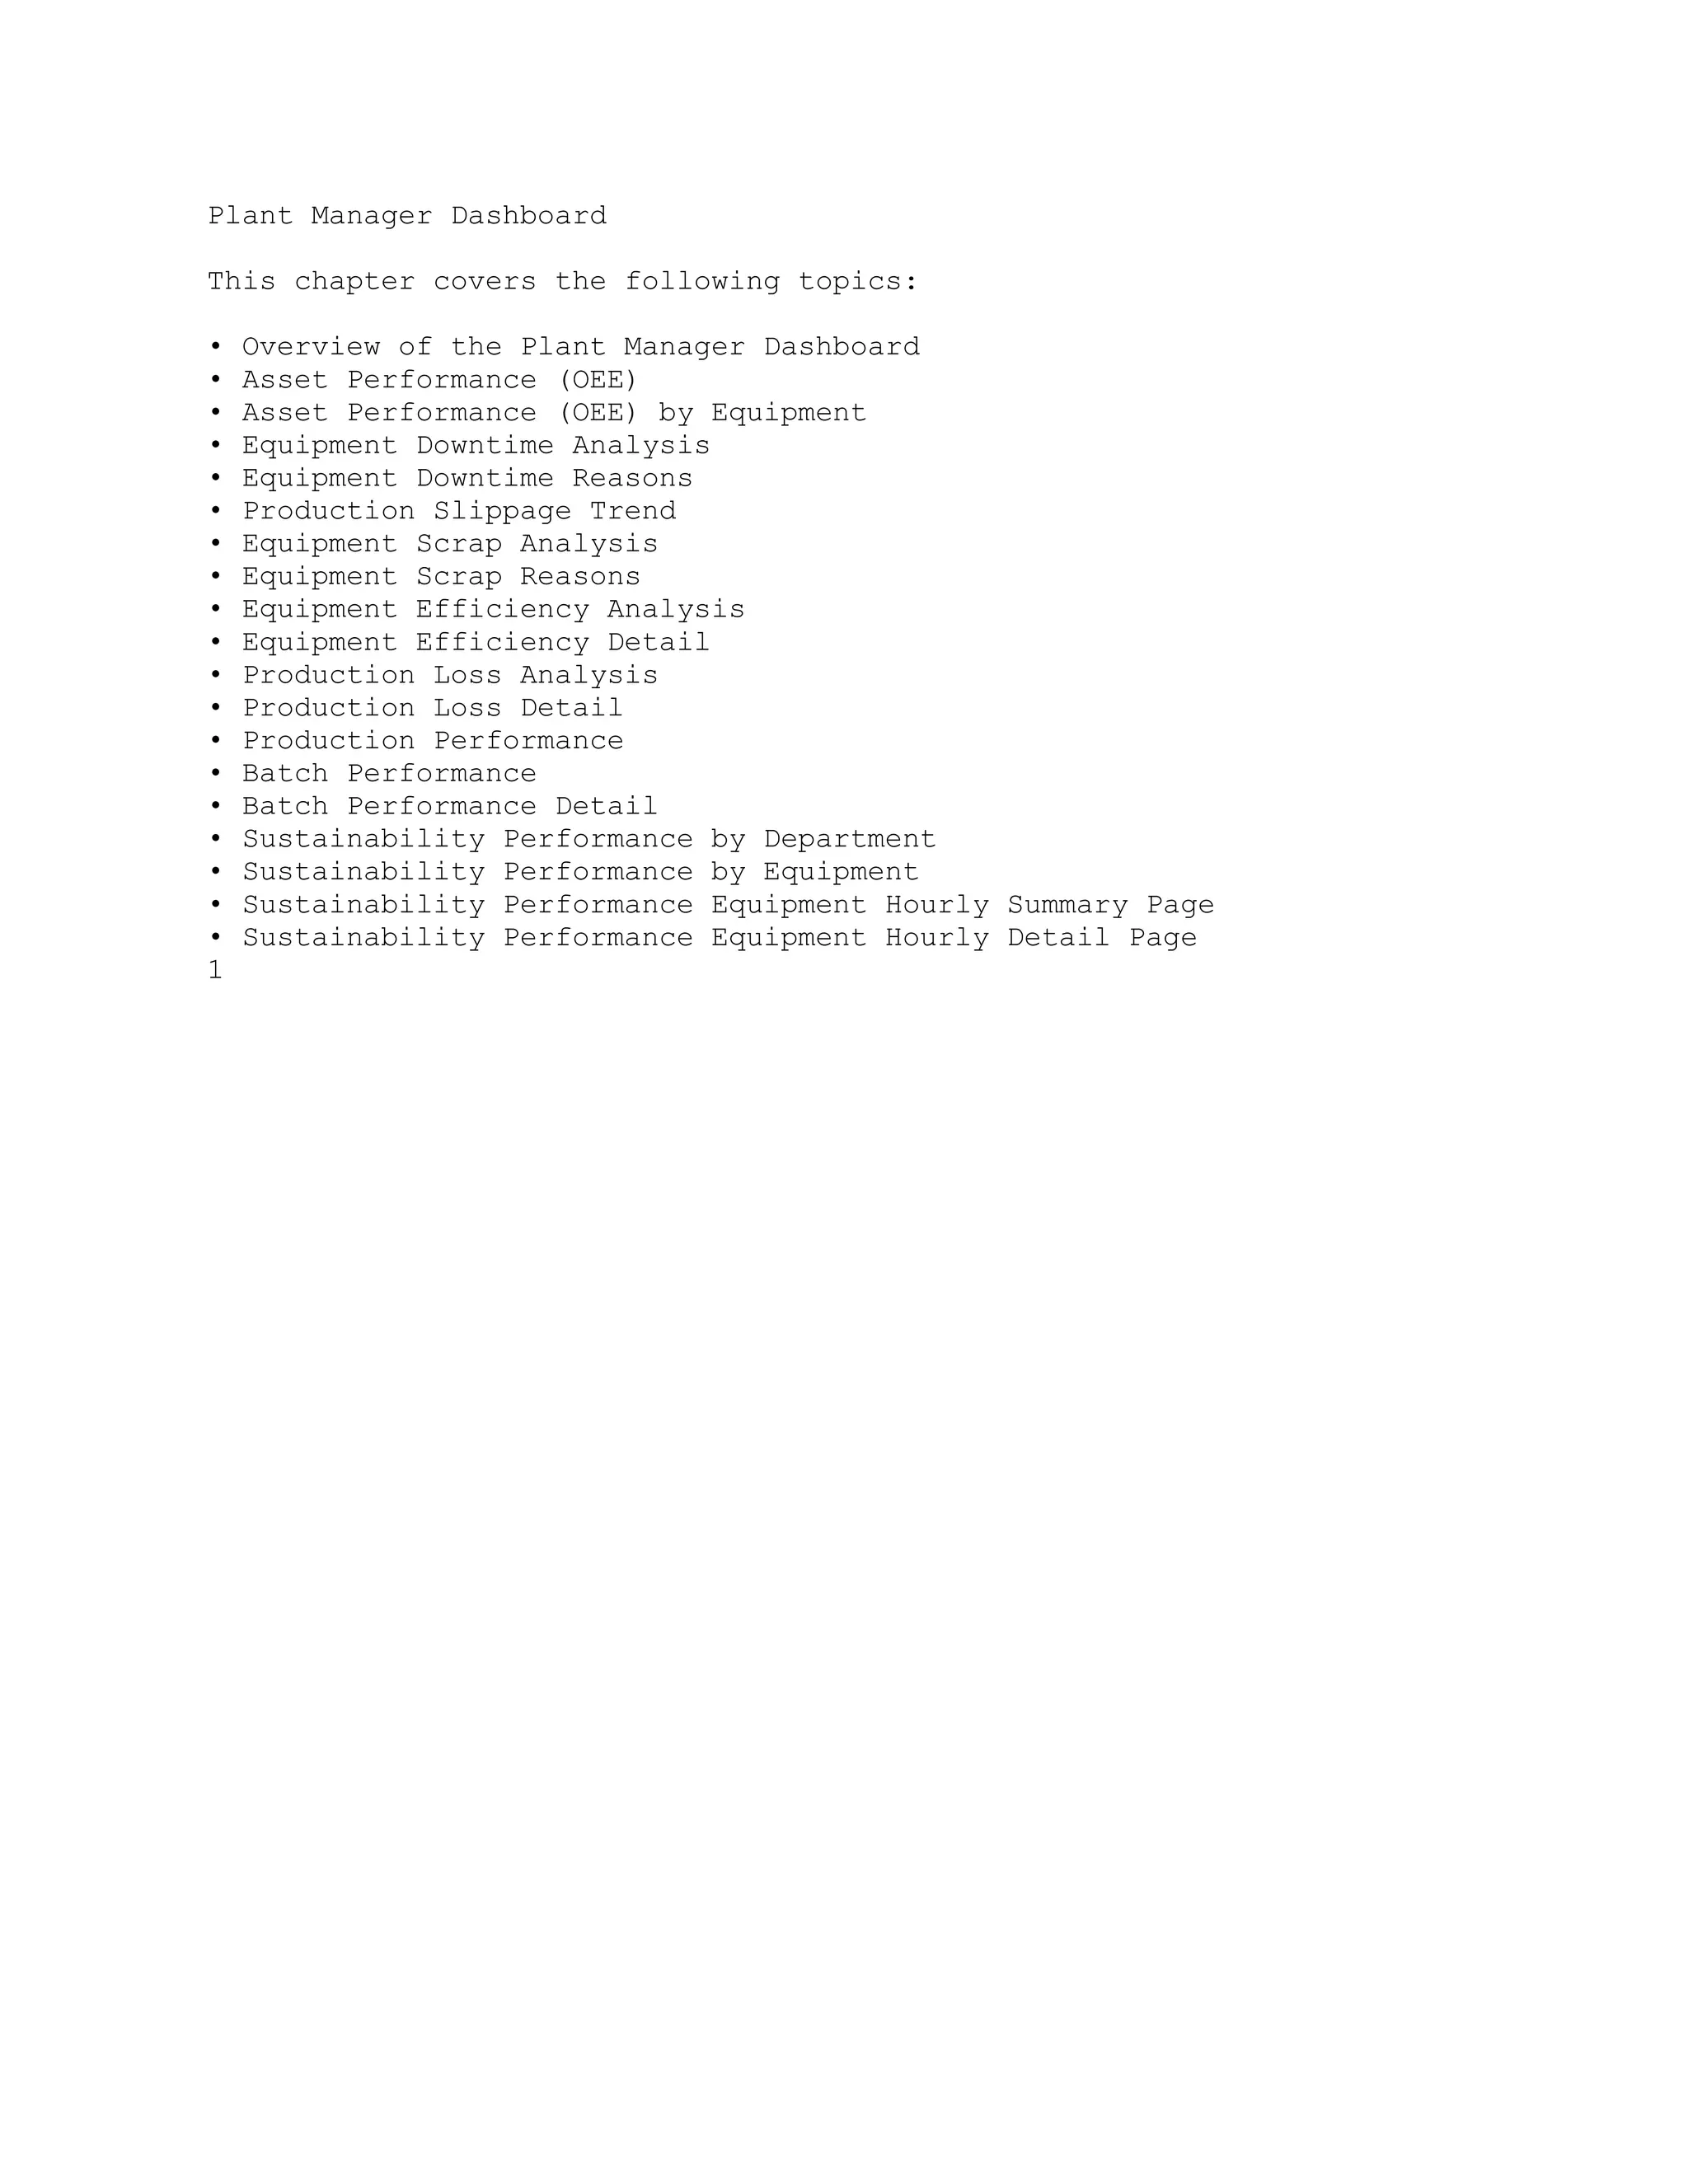
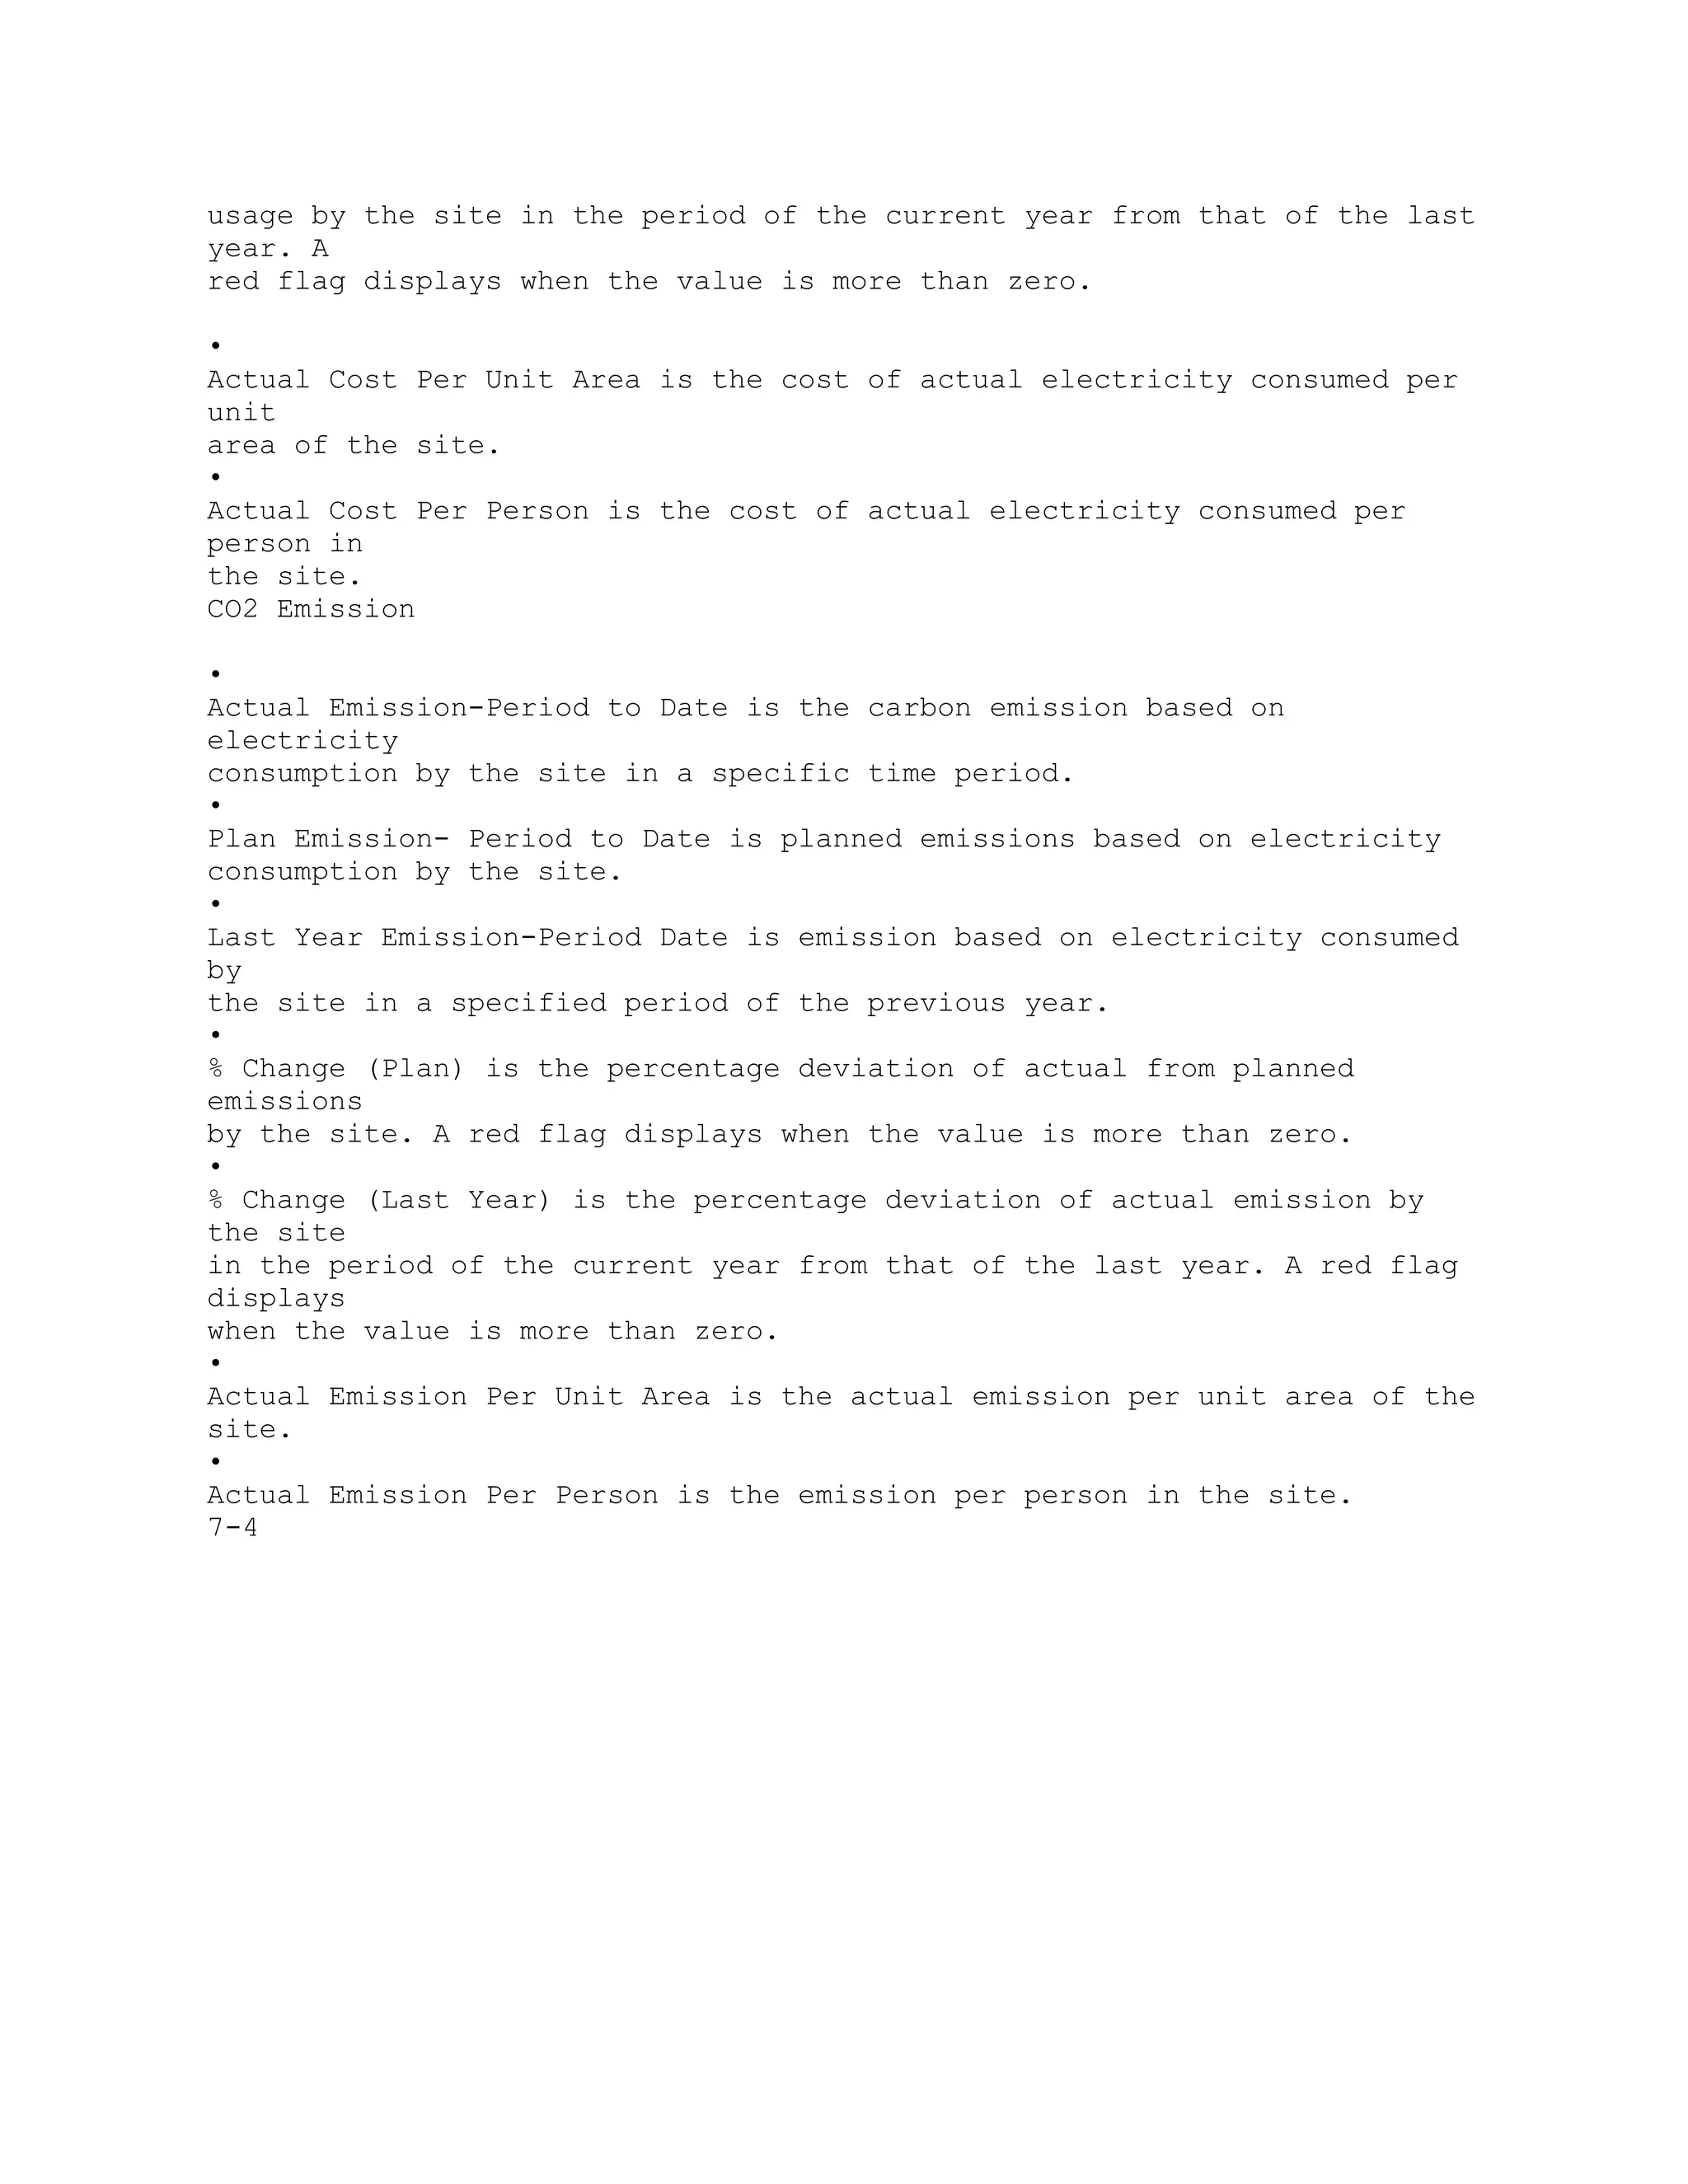
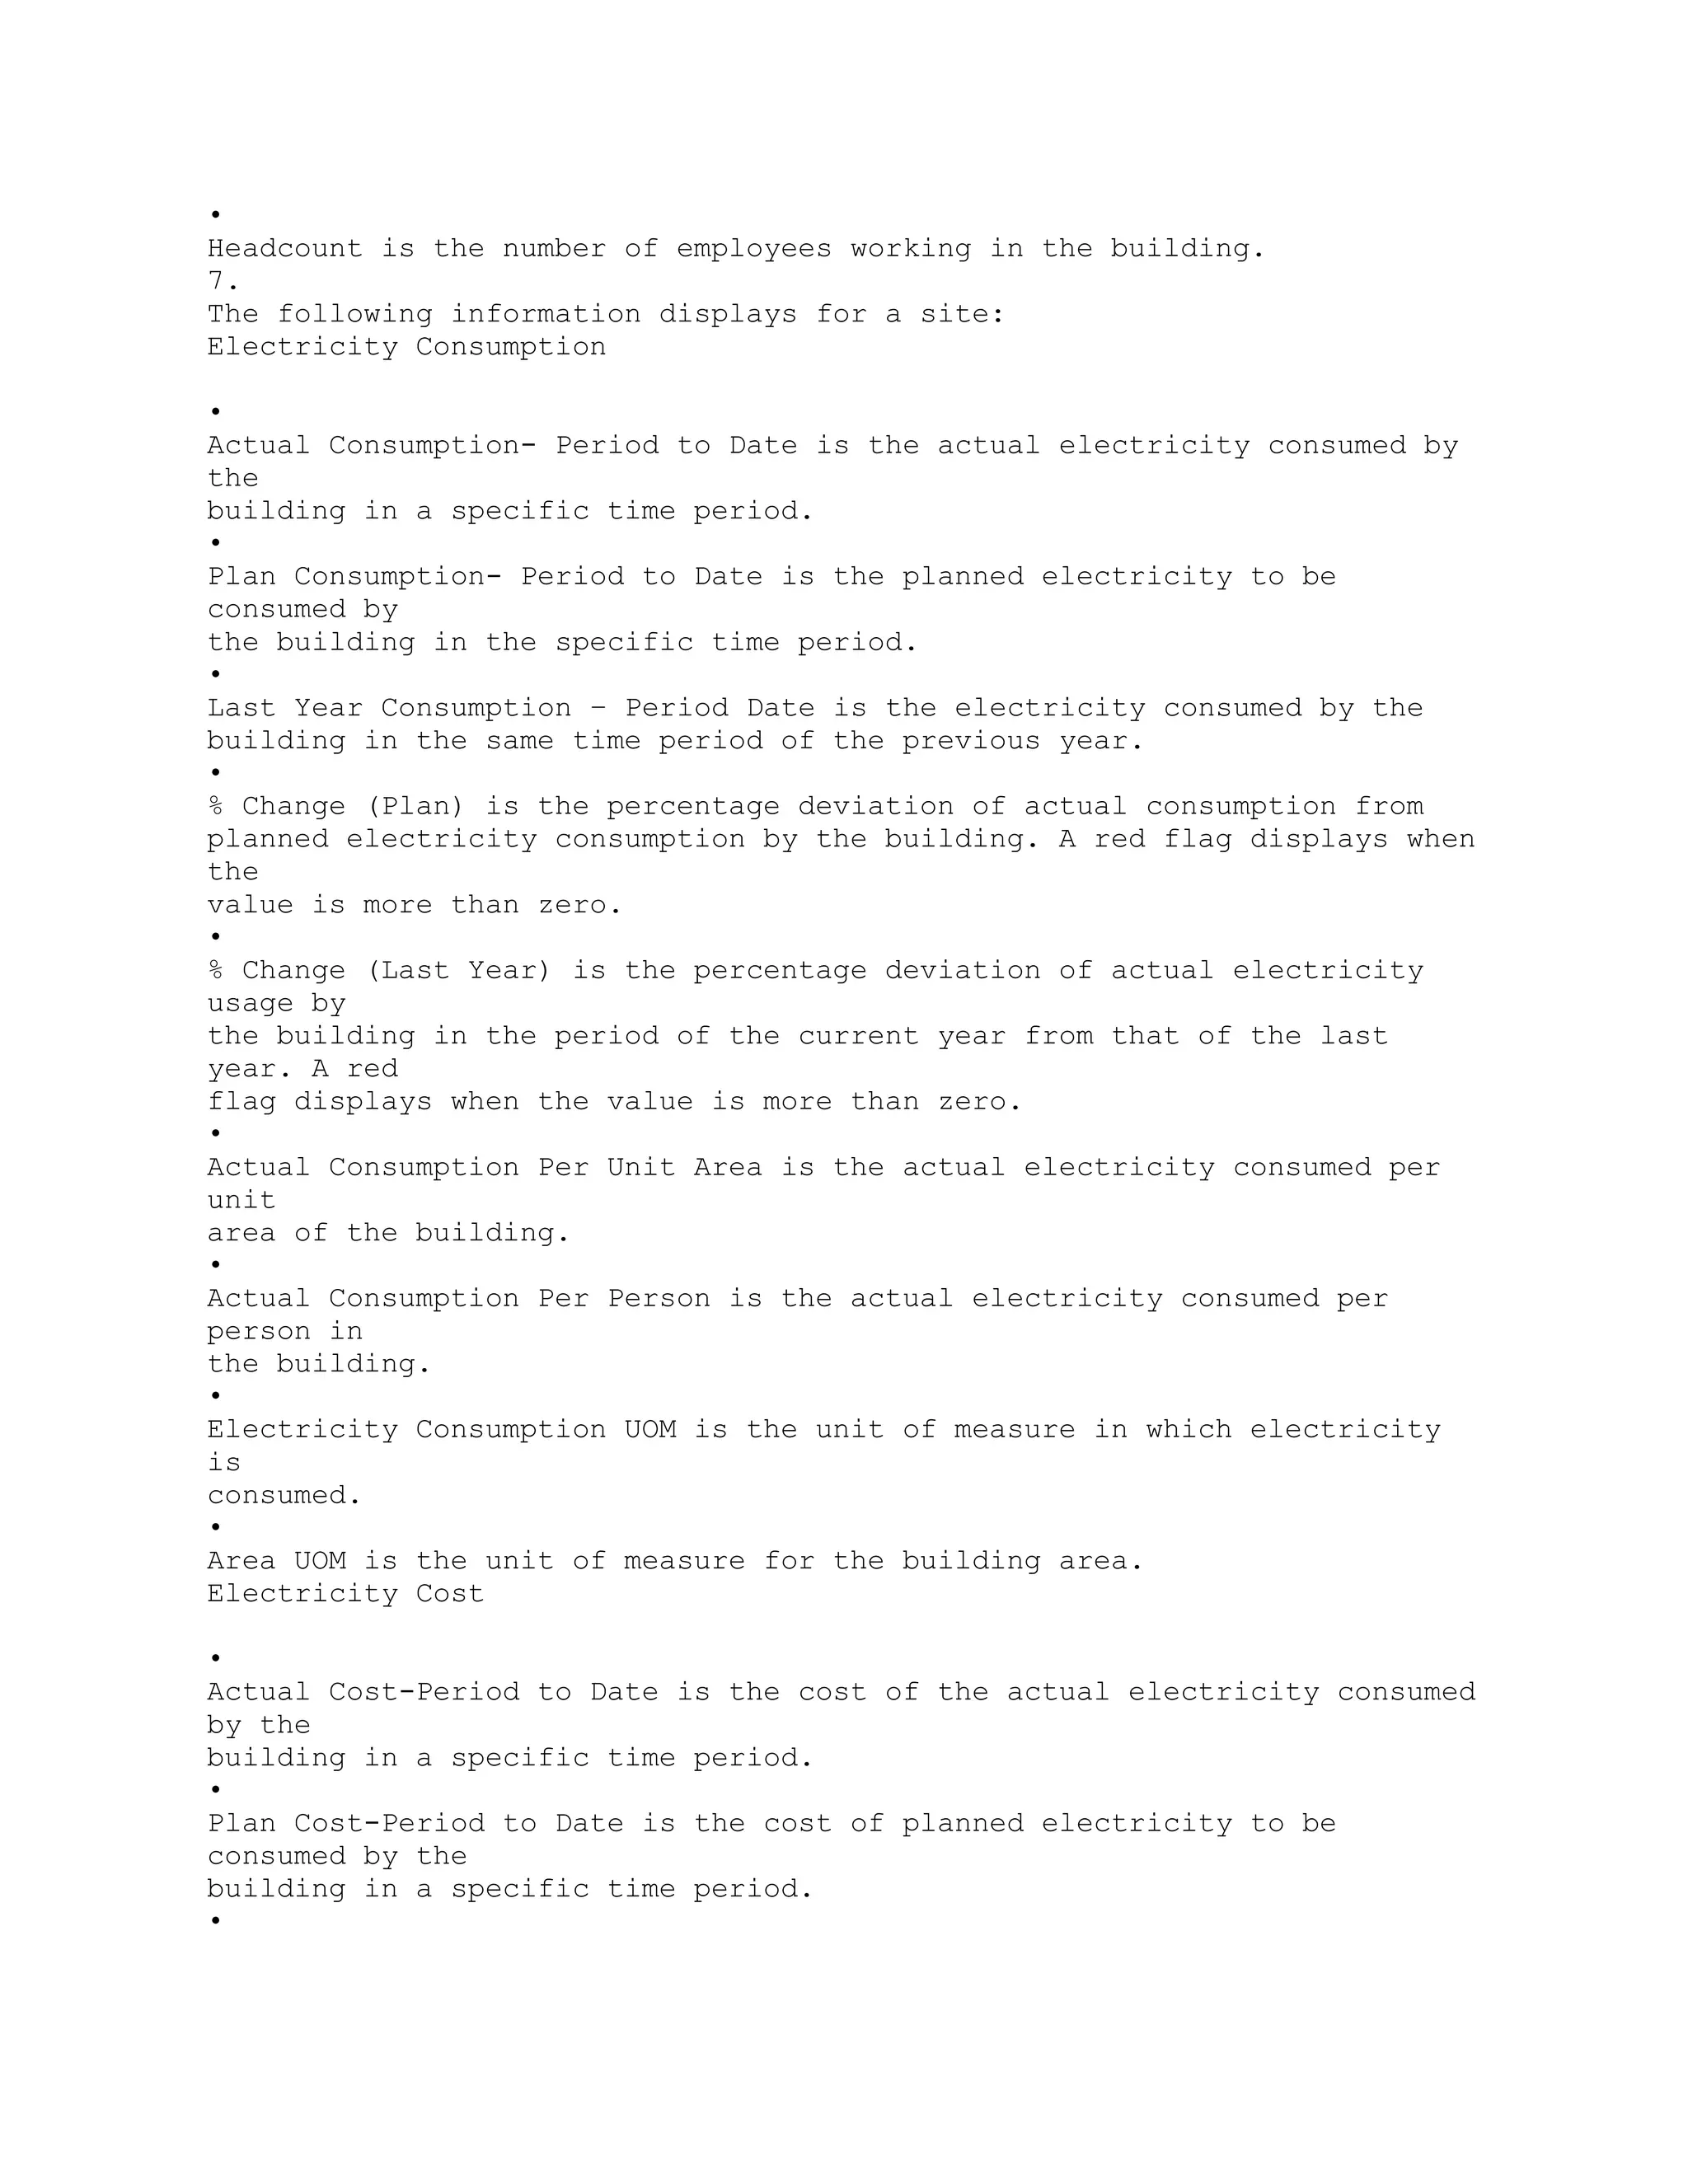
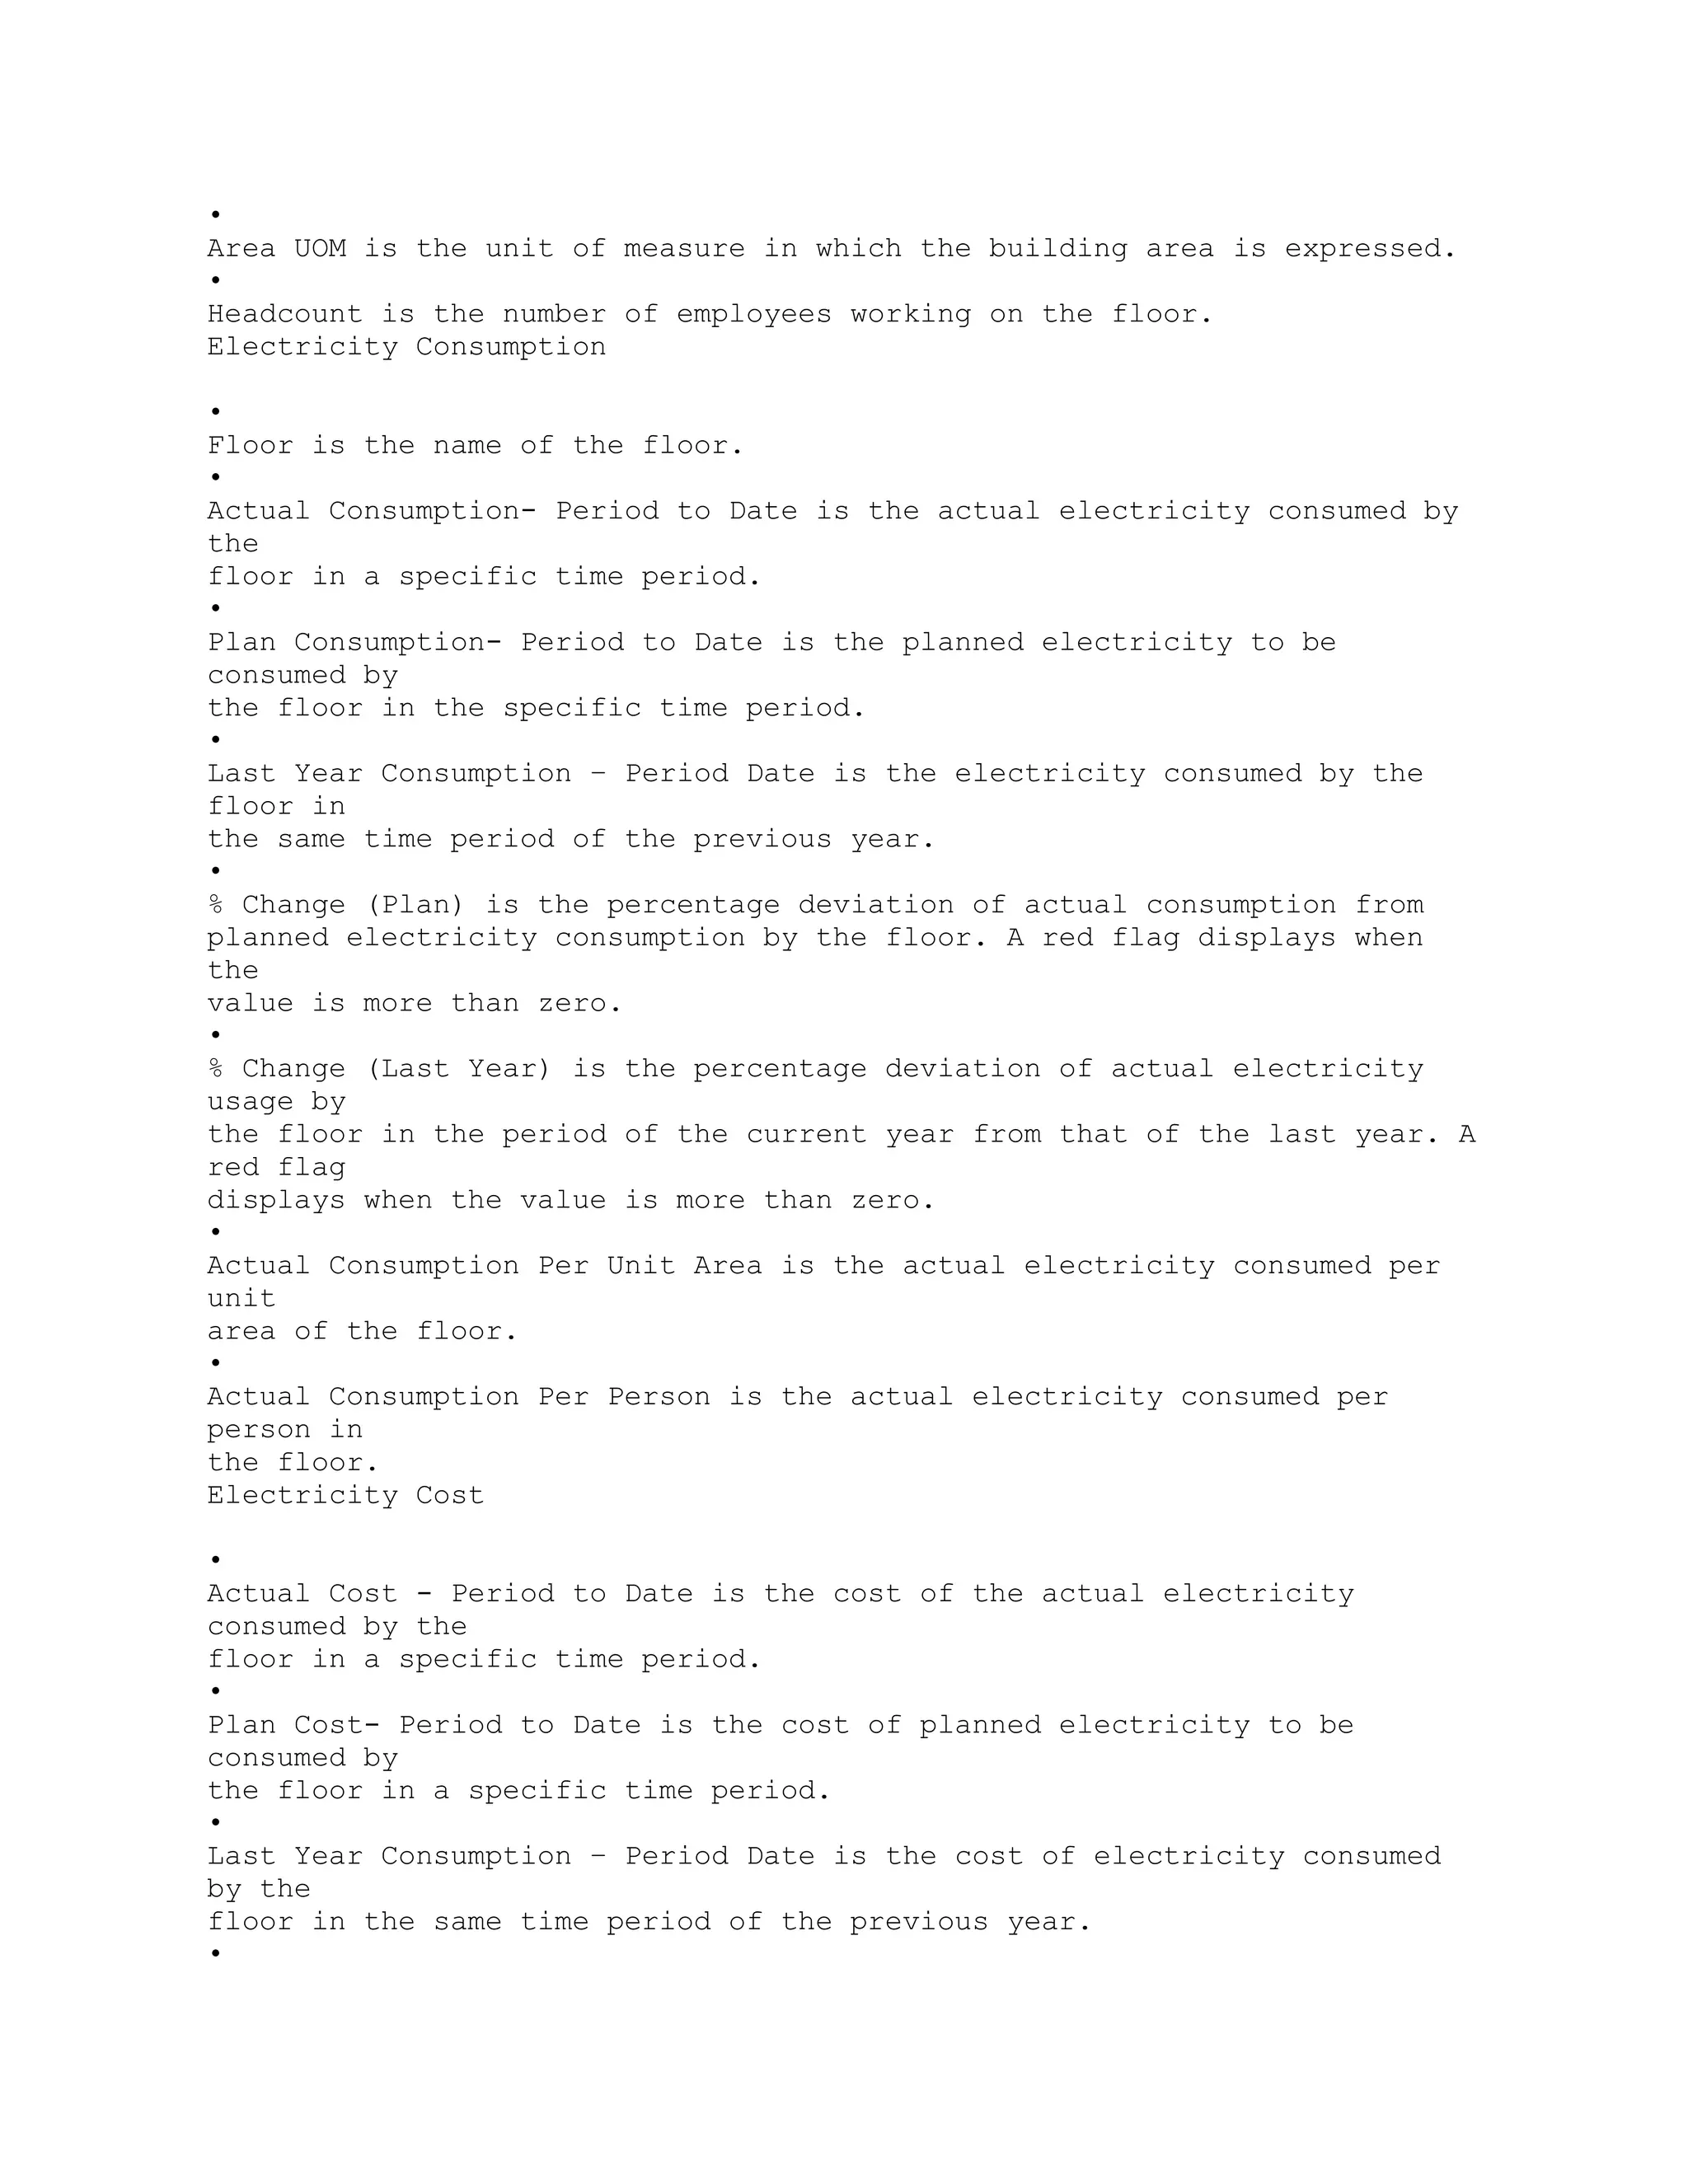
Navigation
Brackets ([ ]) indicate a button or link.
Page Name Navigation Path
Actual Meters Data Entry MOC User > Data Entry > Actual Meters Data Entry
Add Attribute Groups for Batch Operation MOC Administrator > Extensible
Attributes
Workbench > Batch Operations > [select Entity
Name link] > Classifications tab [Attribute
Groups] > [Add Attribute Groups]
Add Attribute Groups for Equipment MOC Administrator > Extensible
Attributes
Workbench > Equipment > [select Entity
Name link] > Classifications tab [Attribute
Groups] > [Add Attribute Groups]
Add Attribute Groups for Item MOC Administrator > Extensible Attributes
Workbench > Items > [select Entity Name link]
> Classifications tab [Attribute Groups] > [Add
Attribute Groups]
1](https://image.slidesharecdn.com/12-1-man-operationcenter-ug2-150223055255-conversion-gate02/75/12-1-man-operation-center-ug-2-161-2048.jpg)
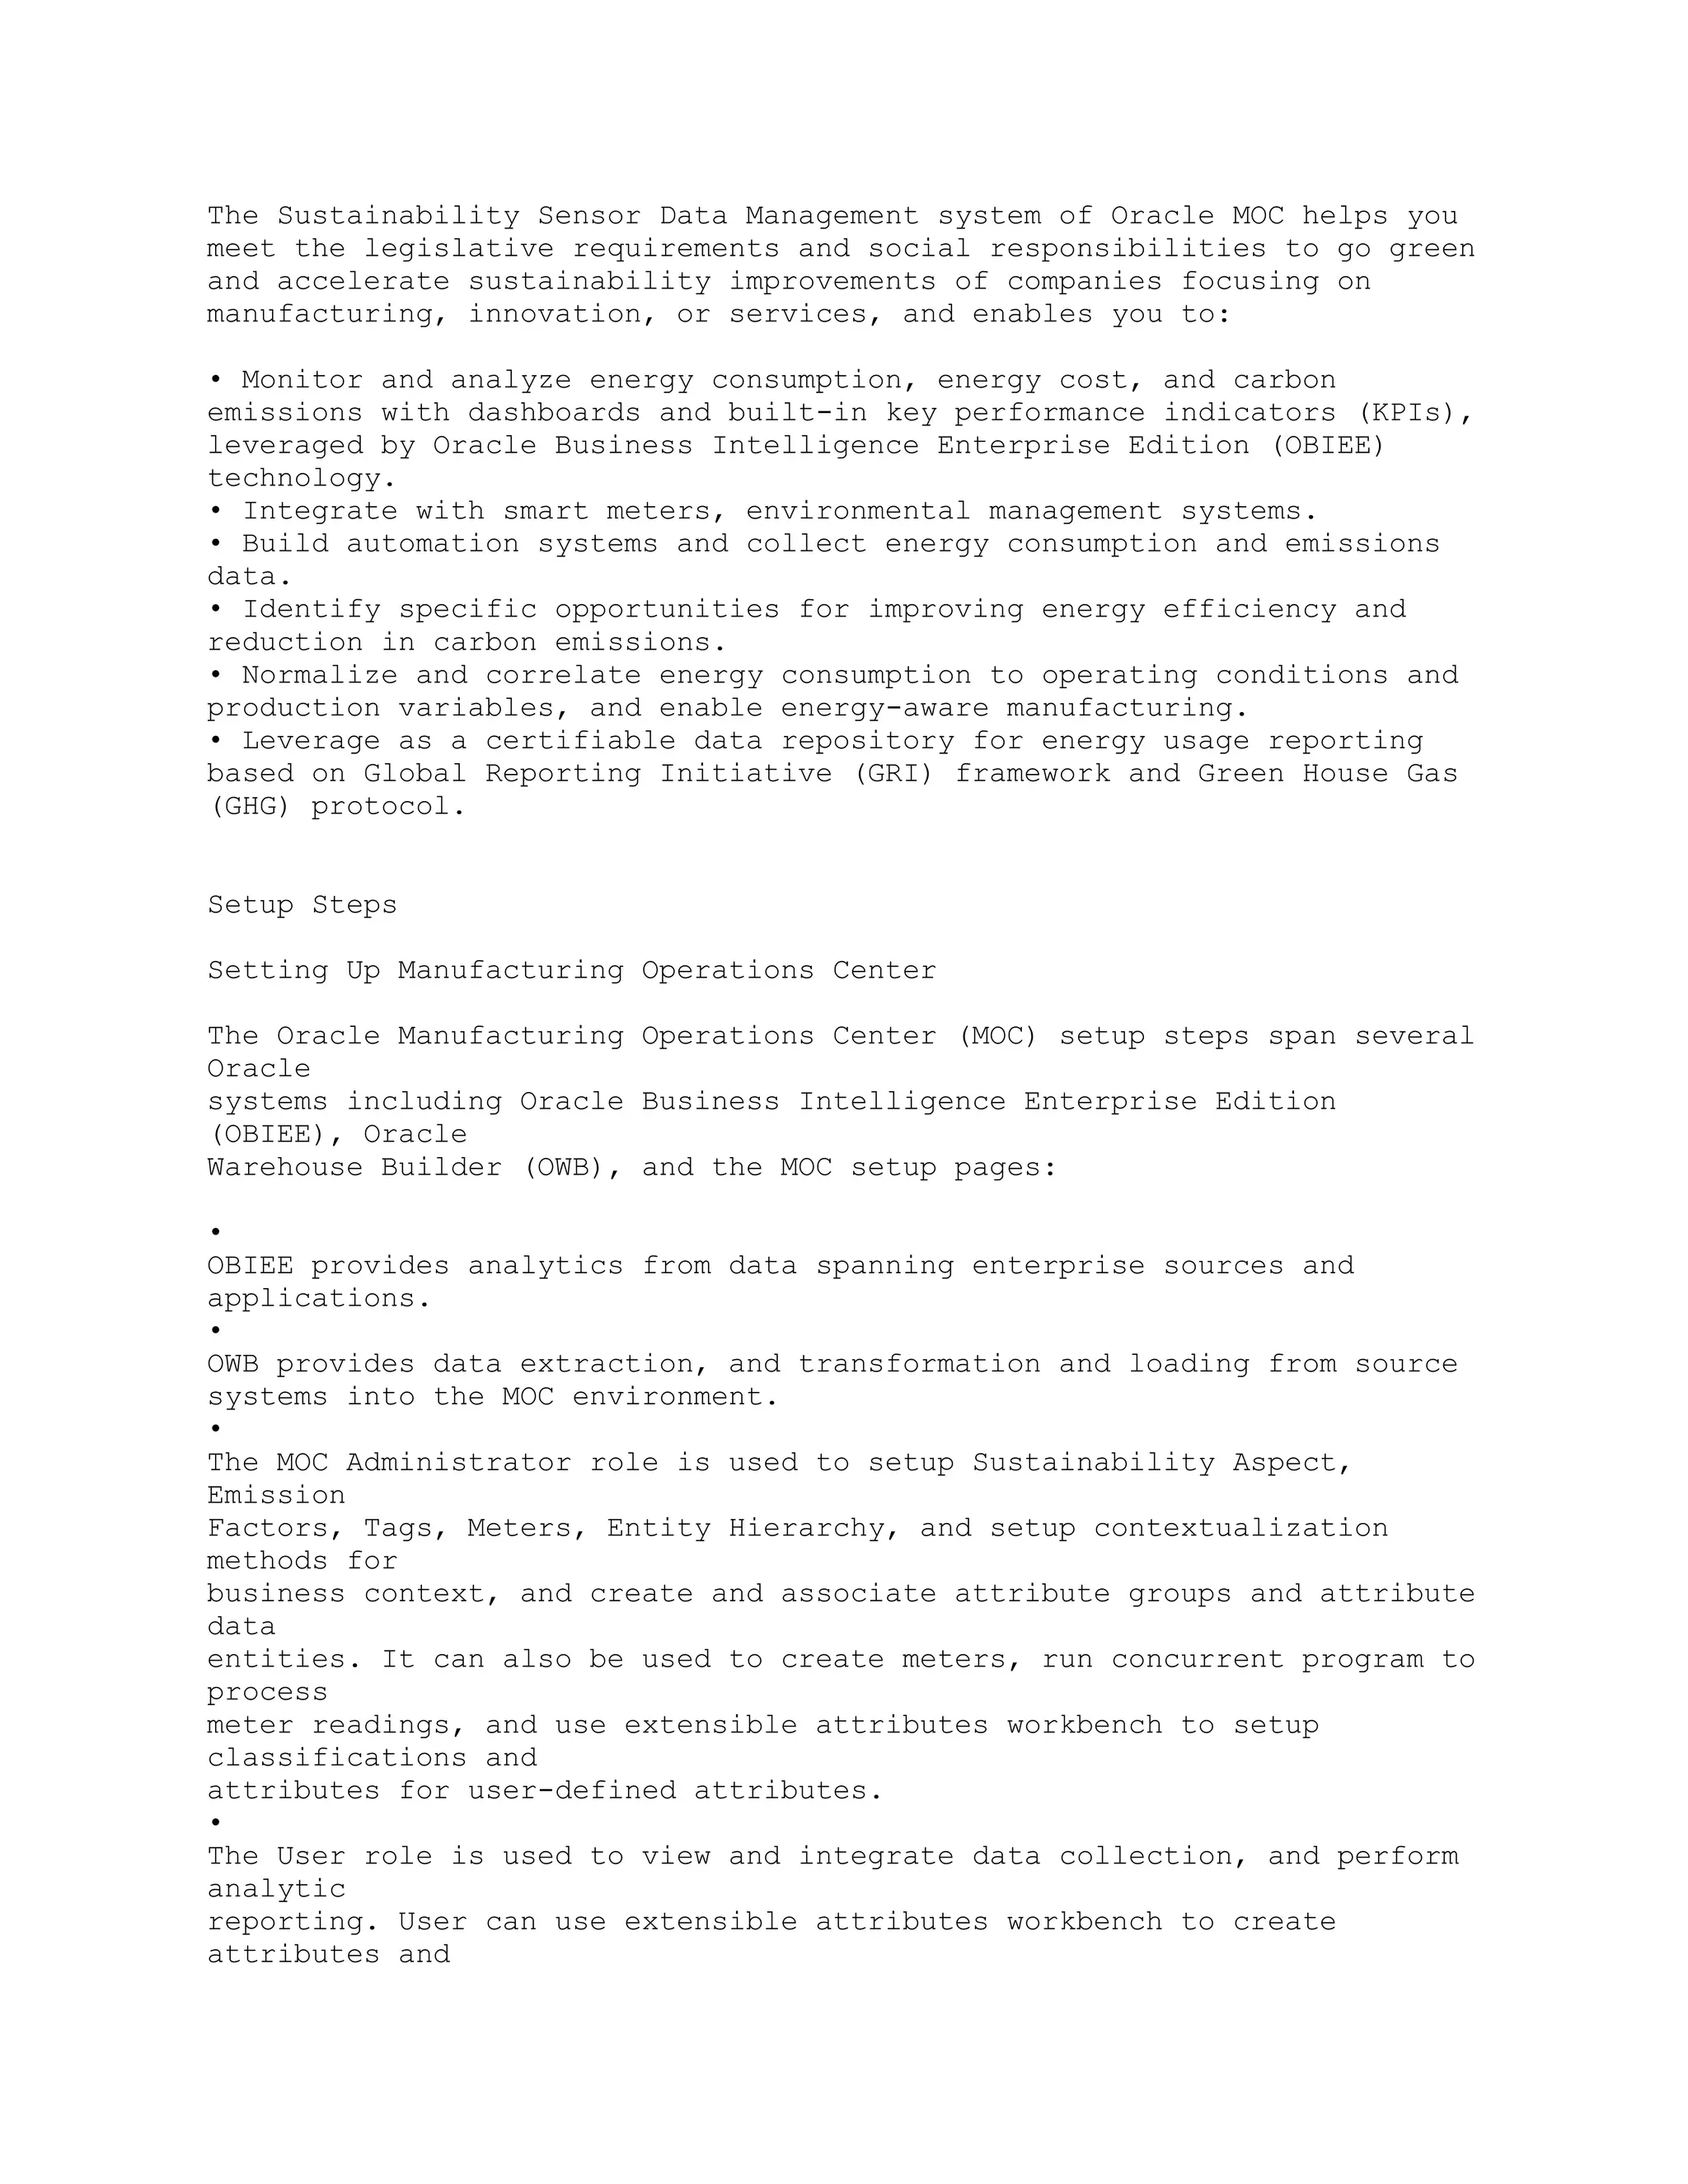
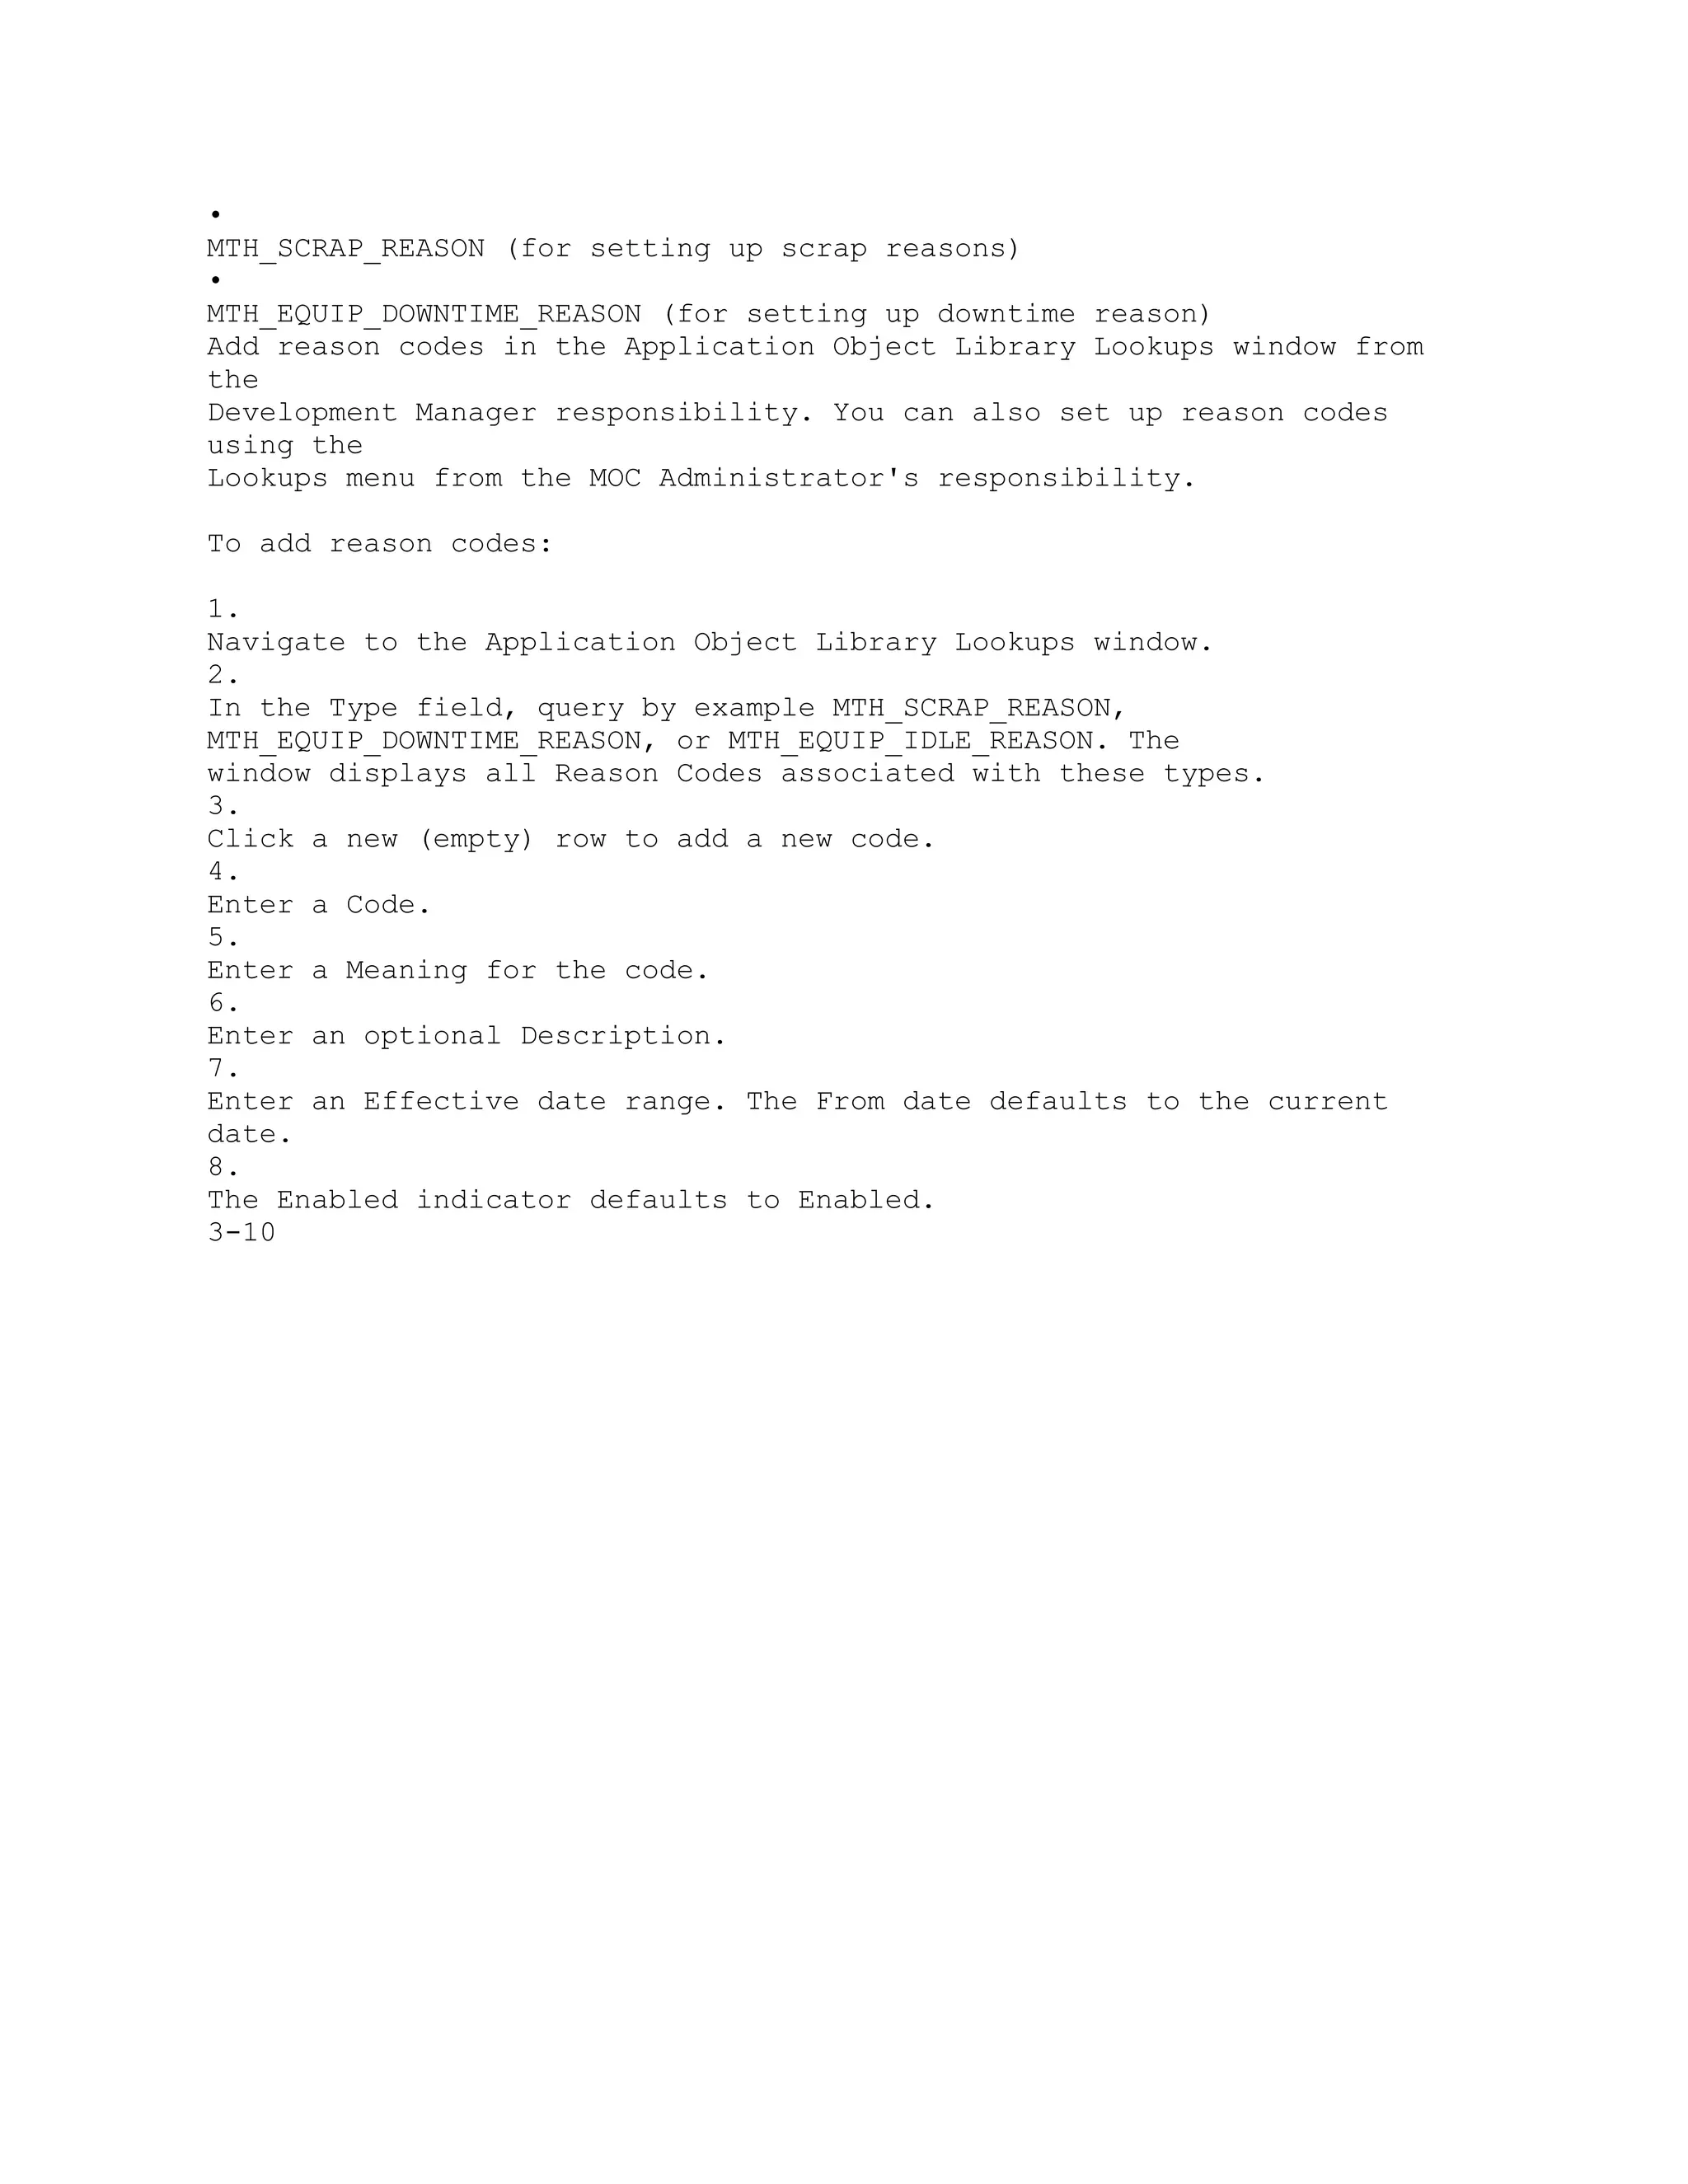
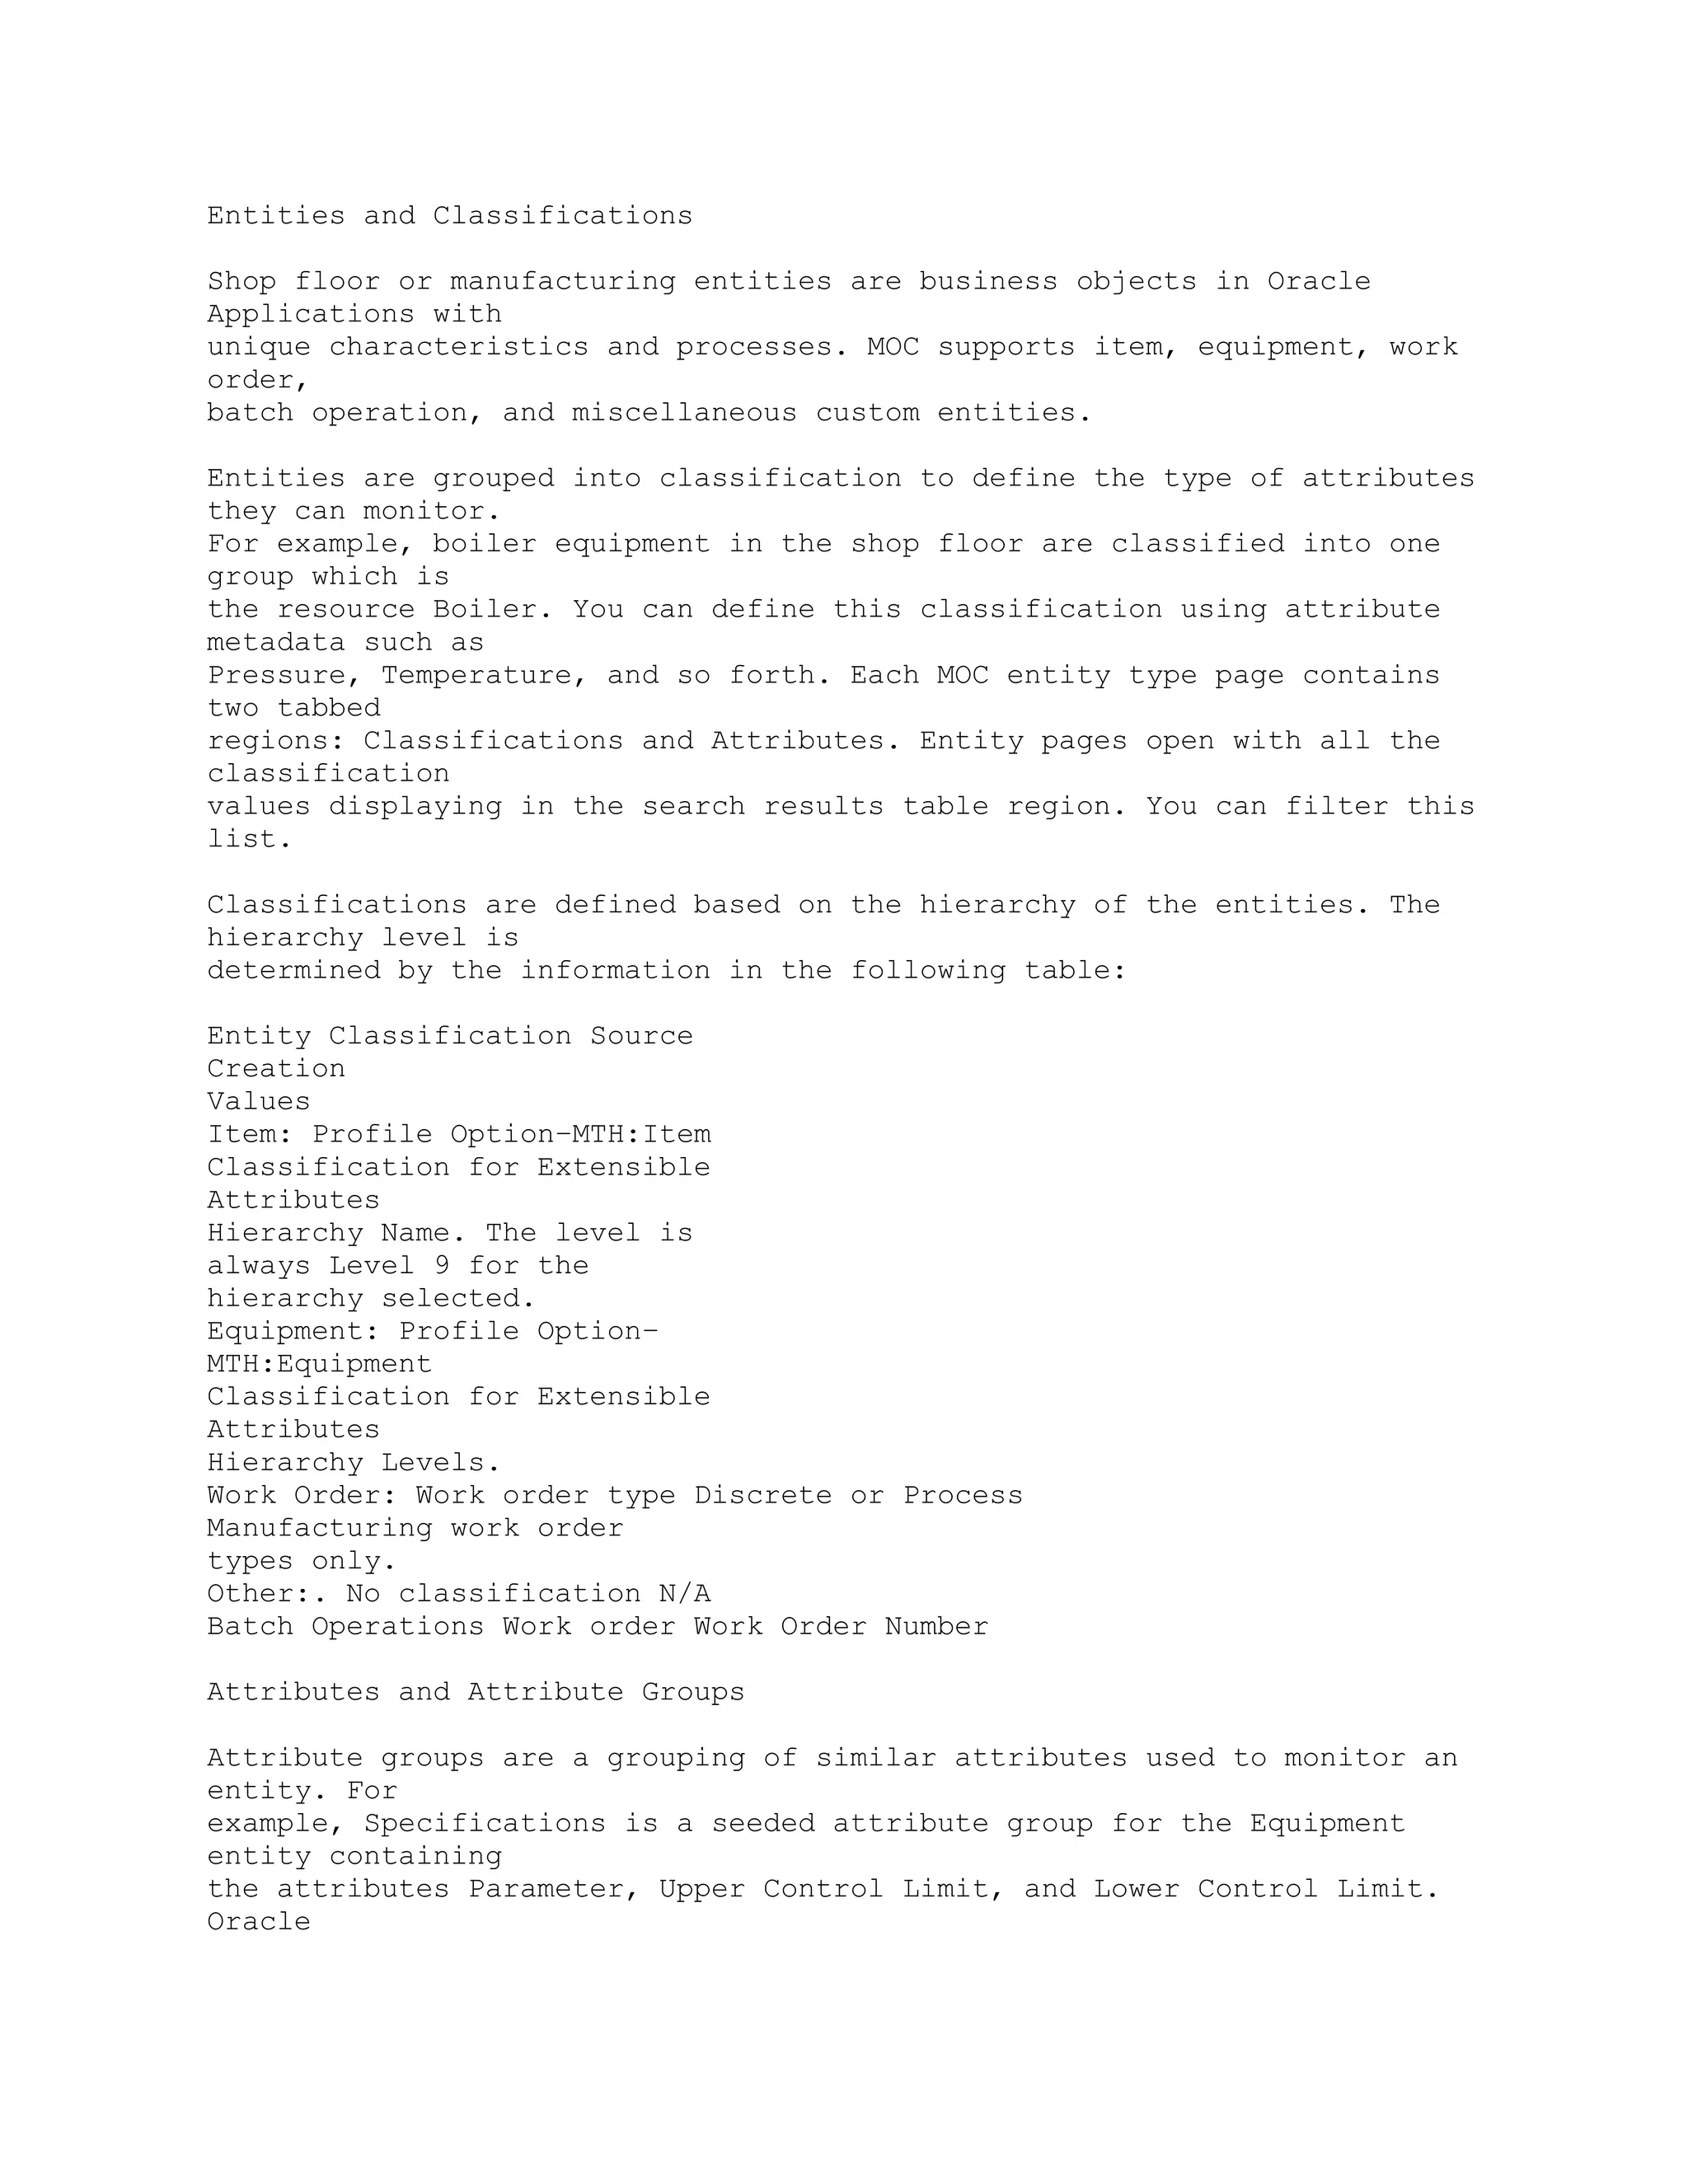
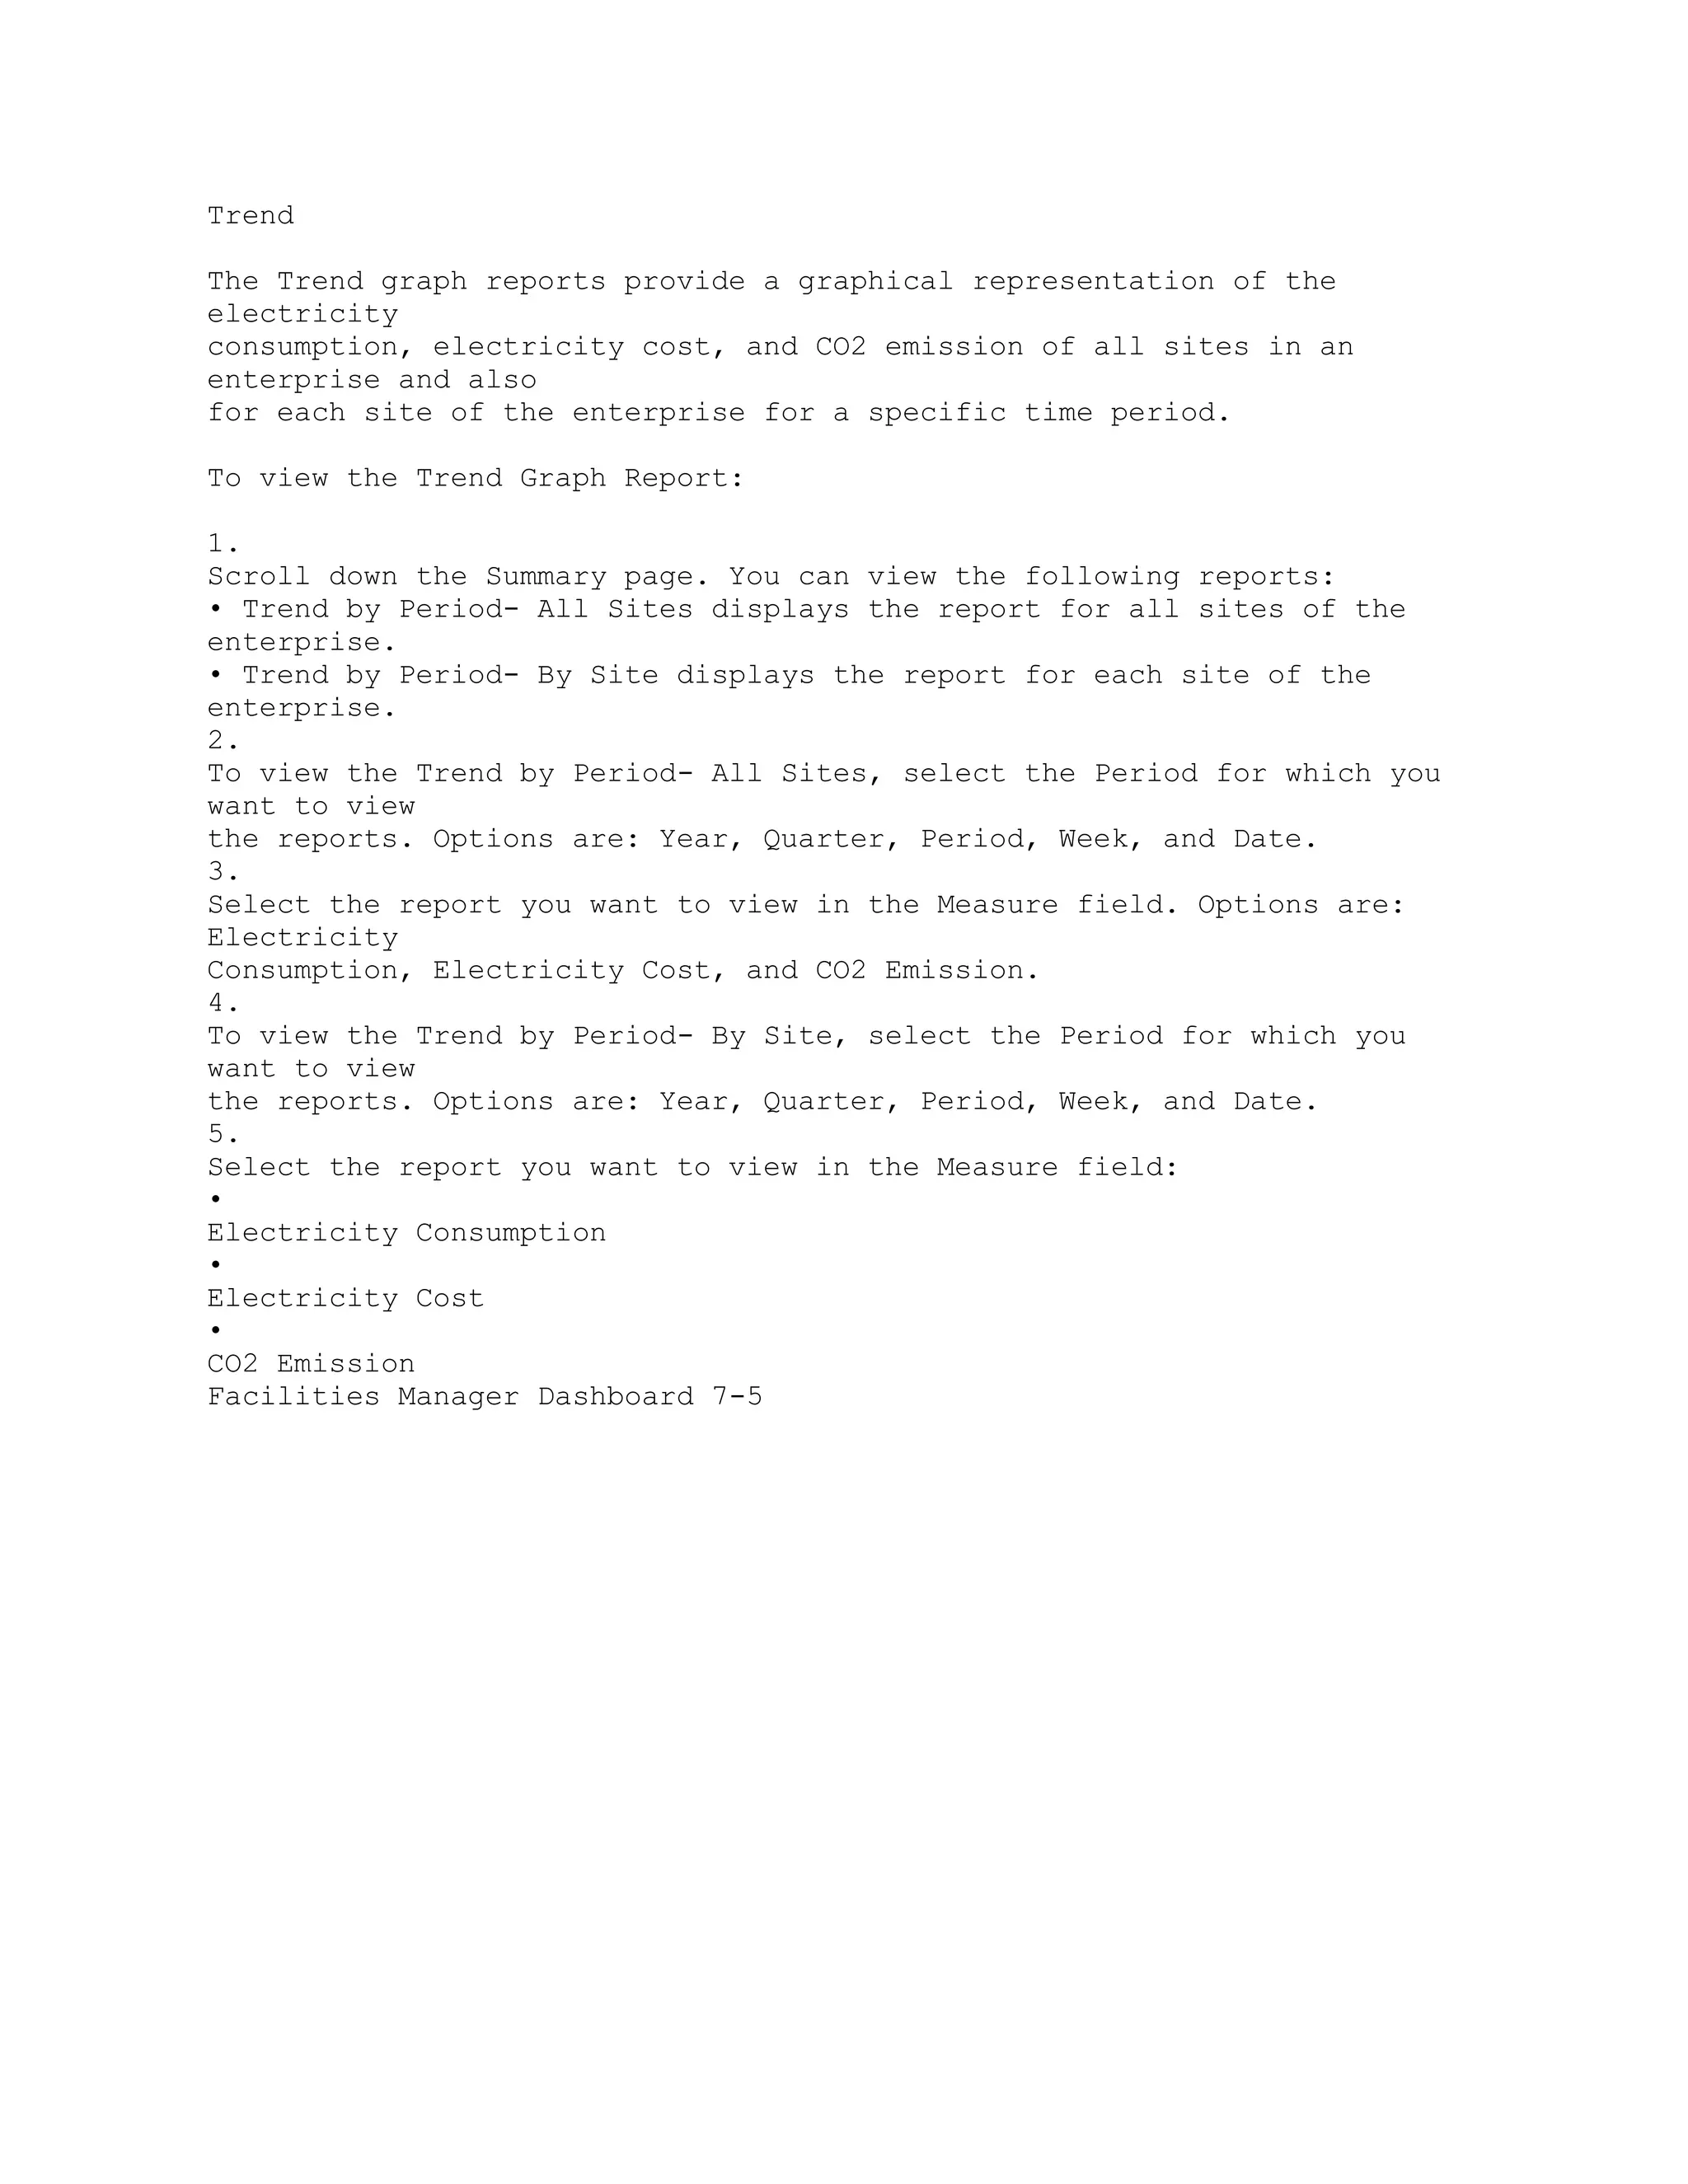
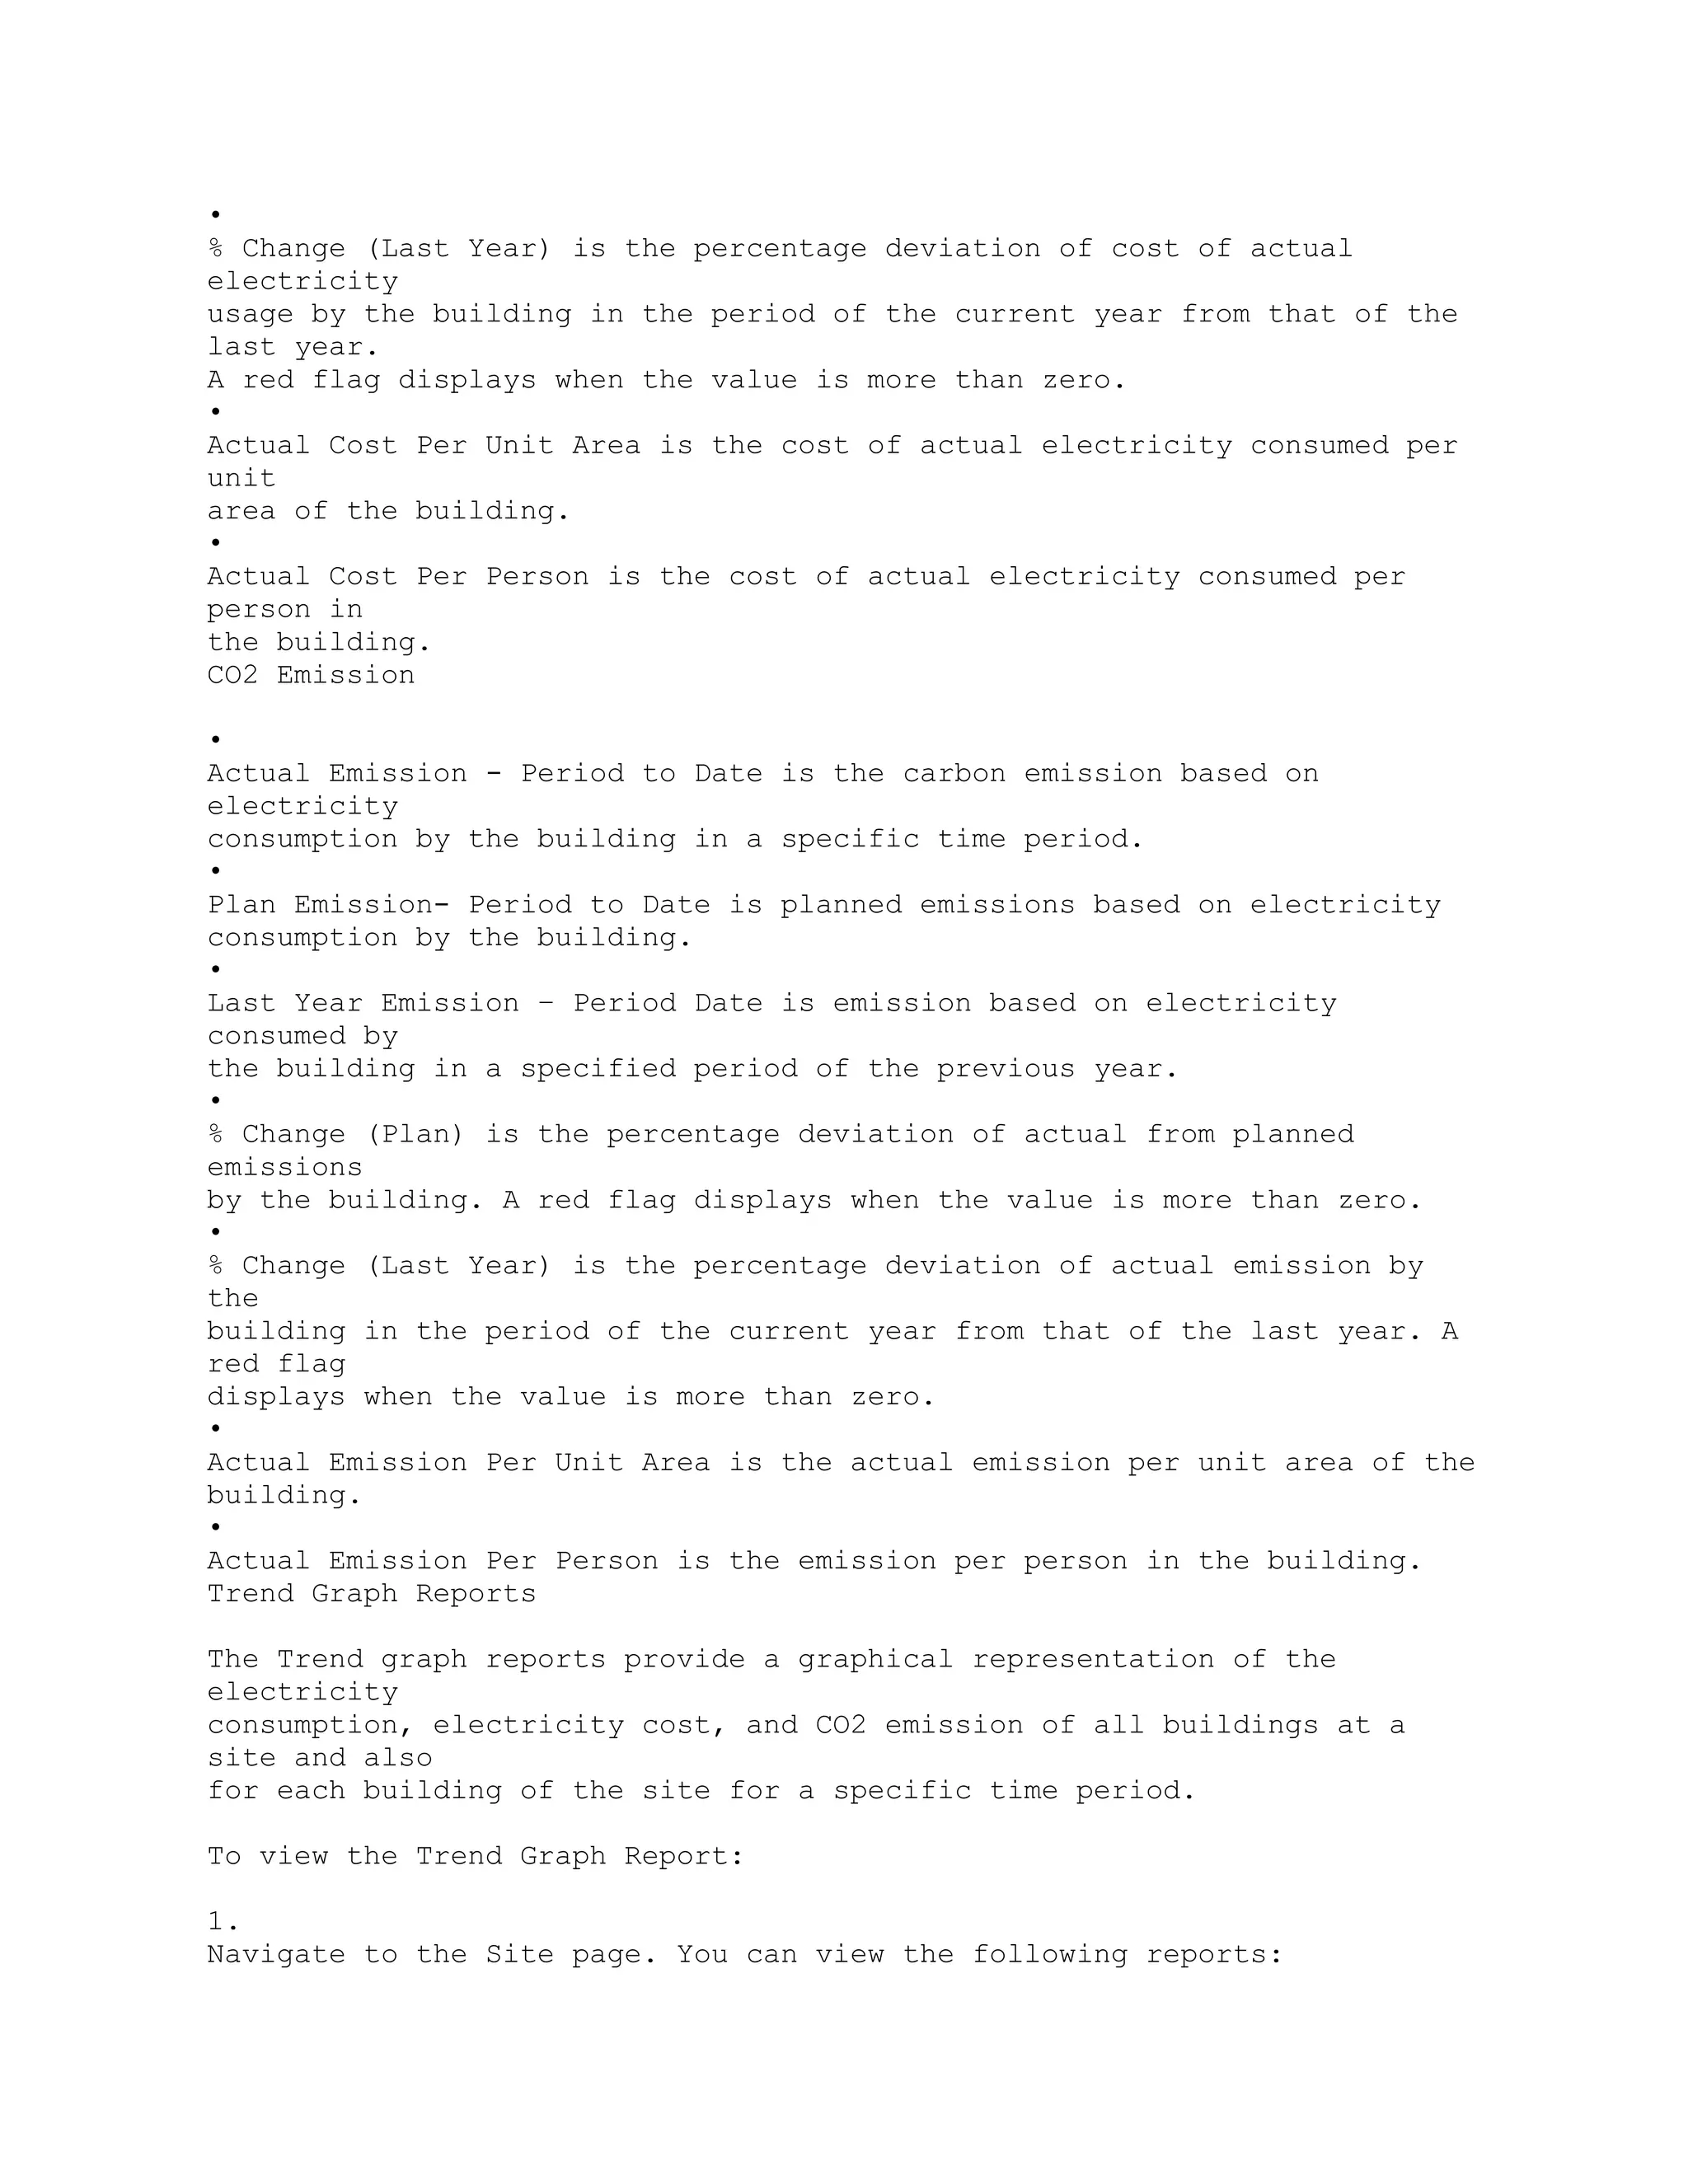
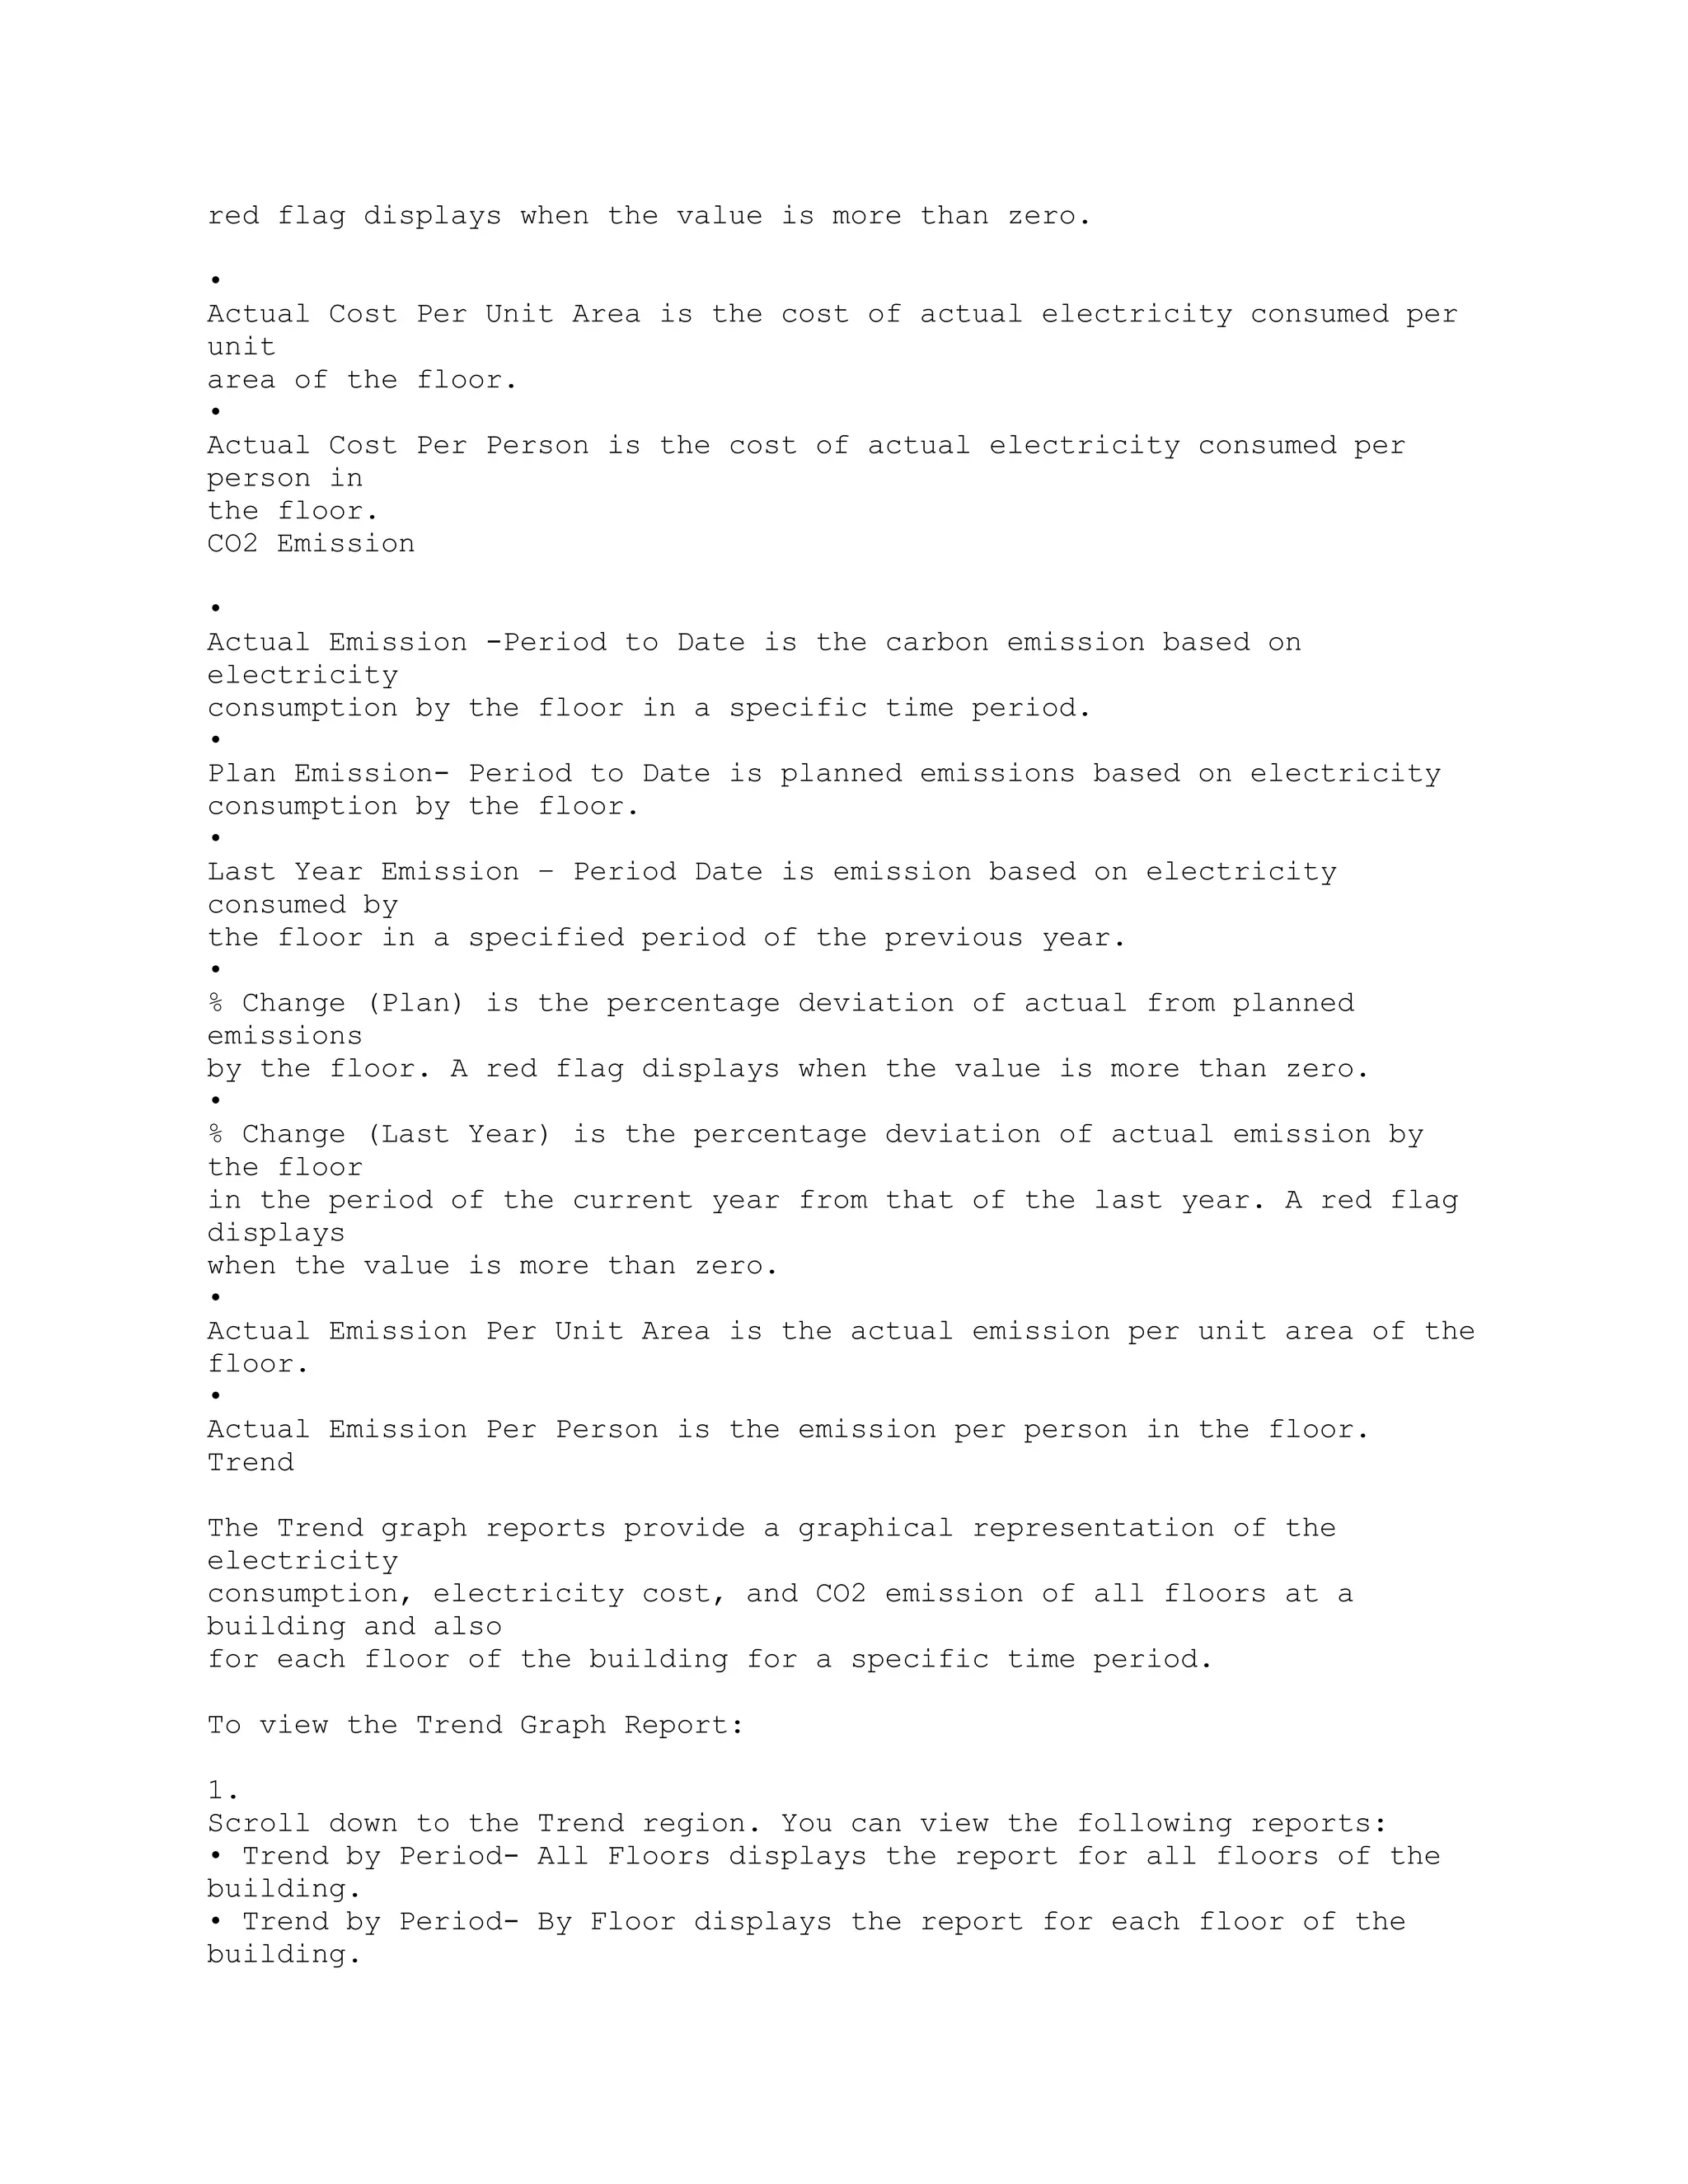
![Page Name Navigation Path
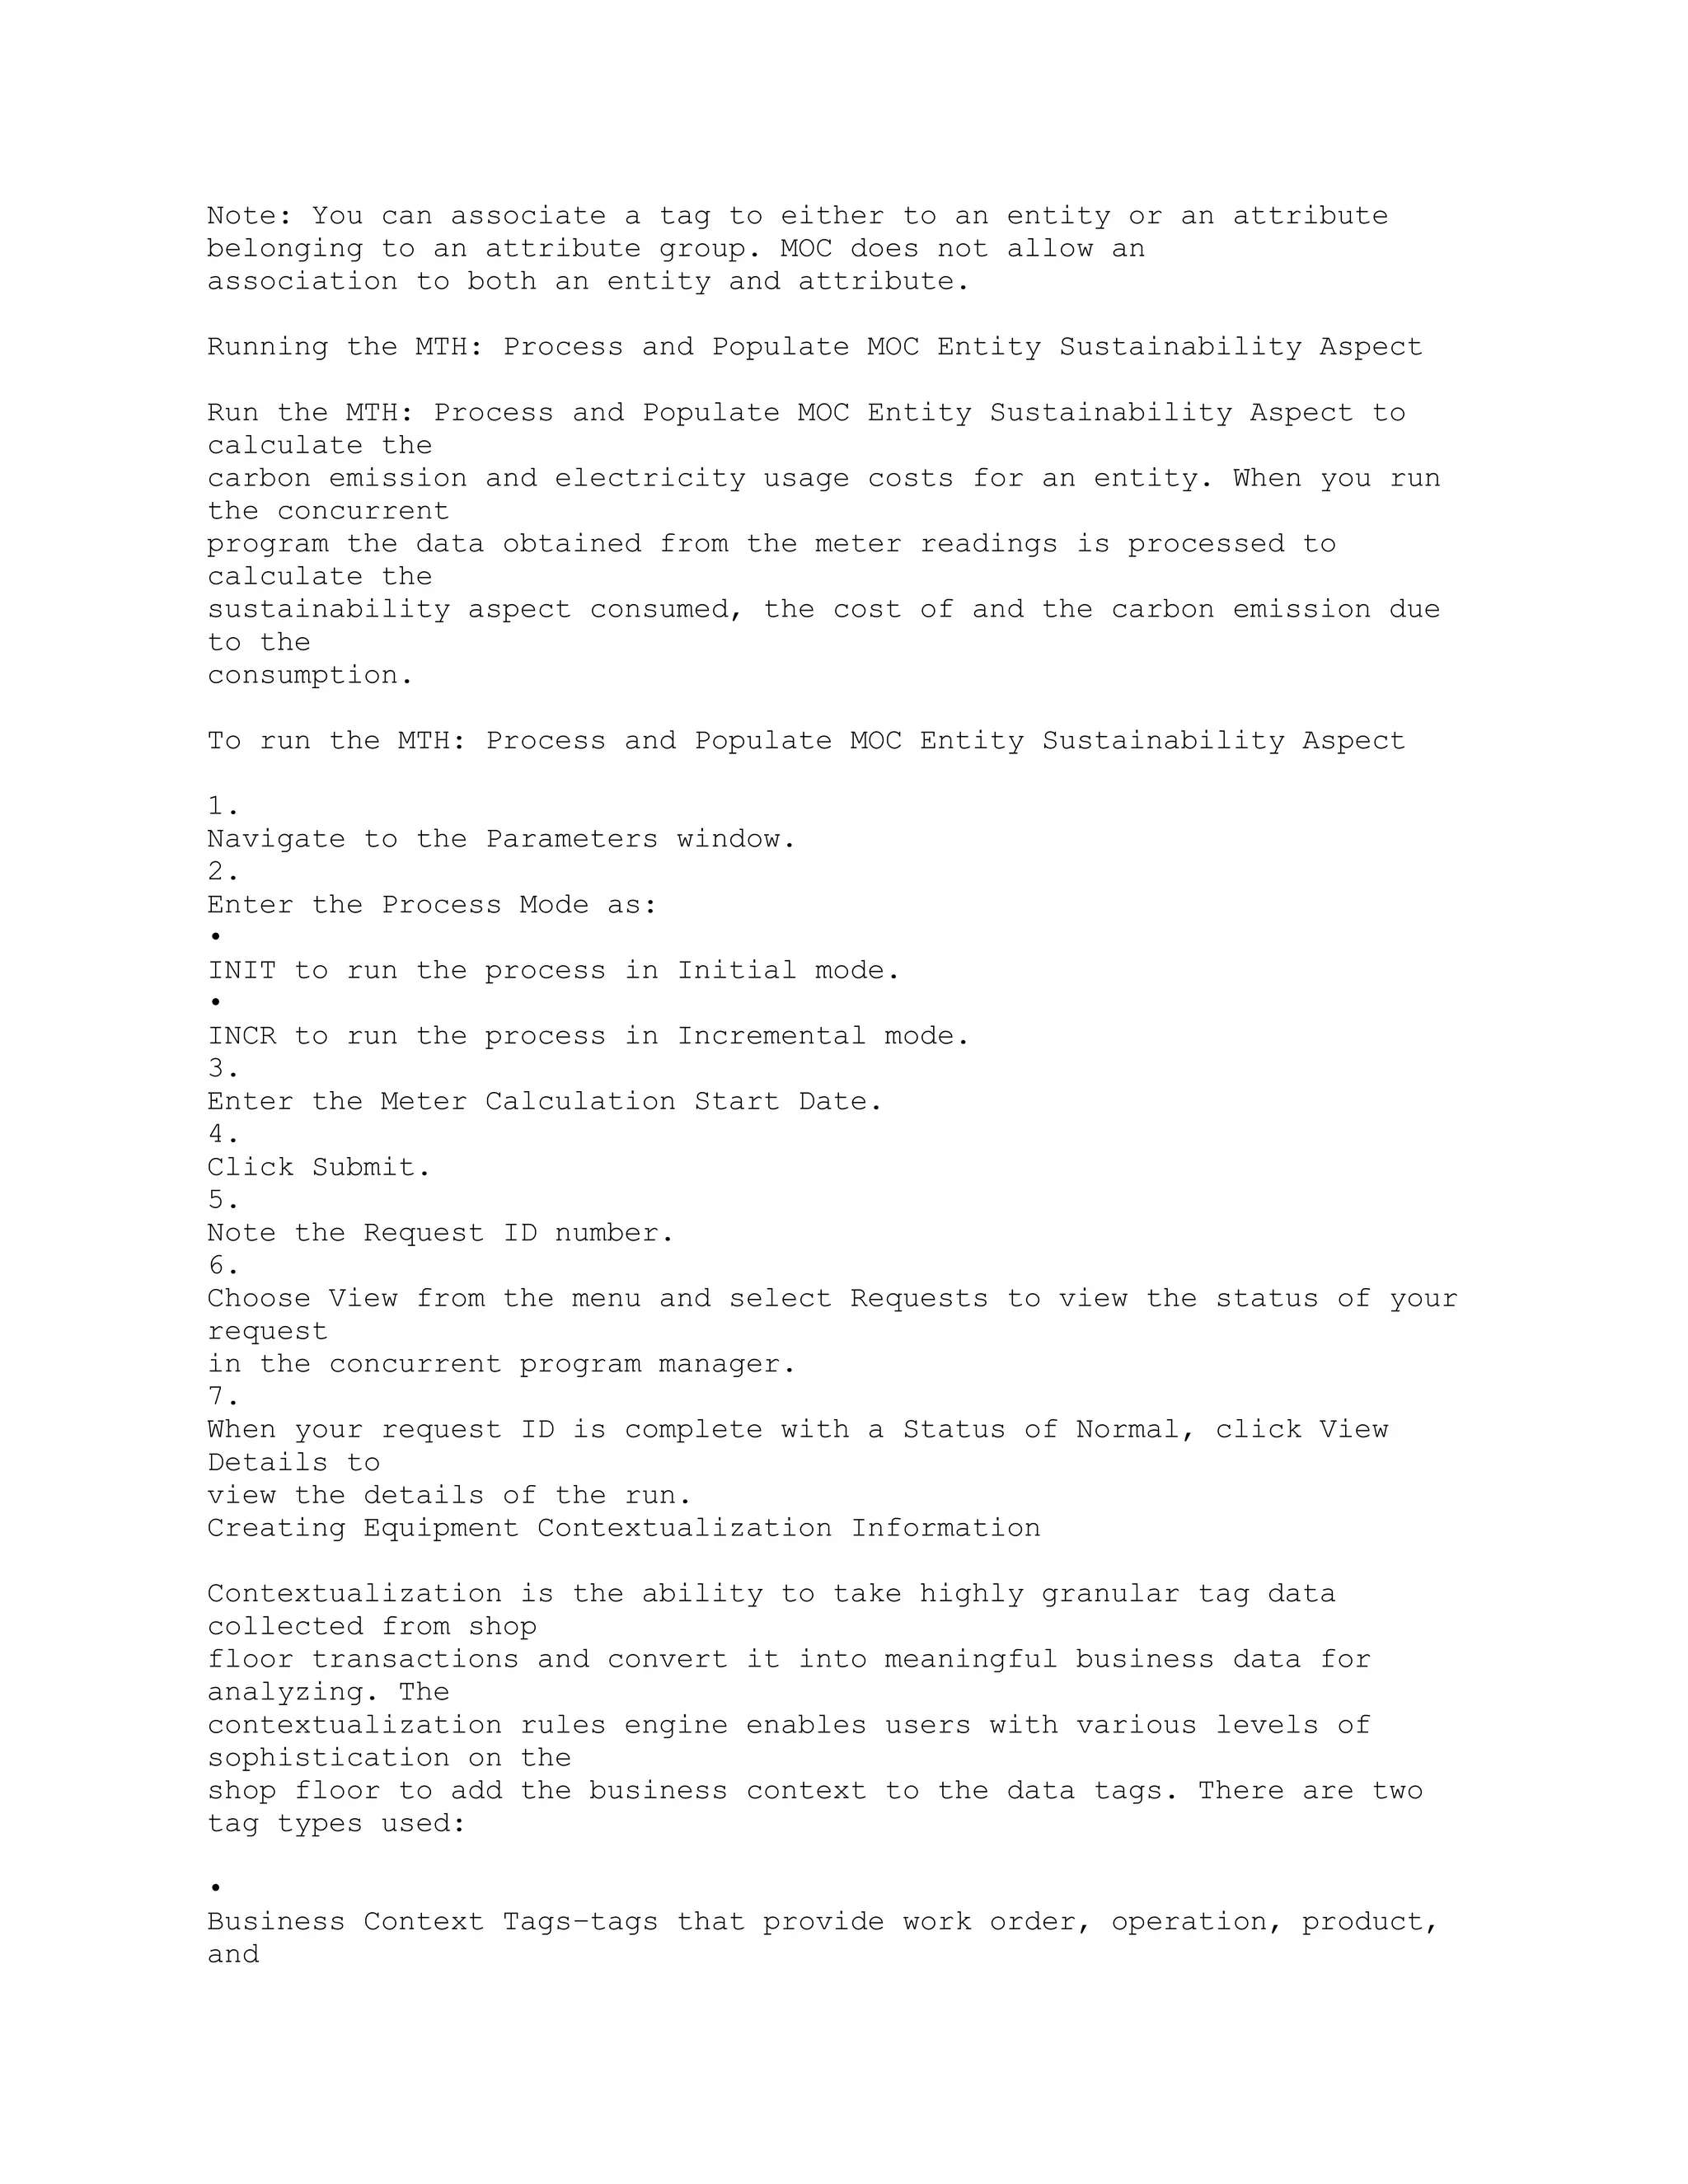
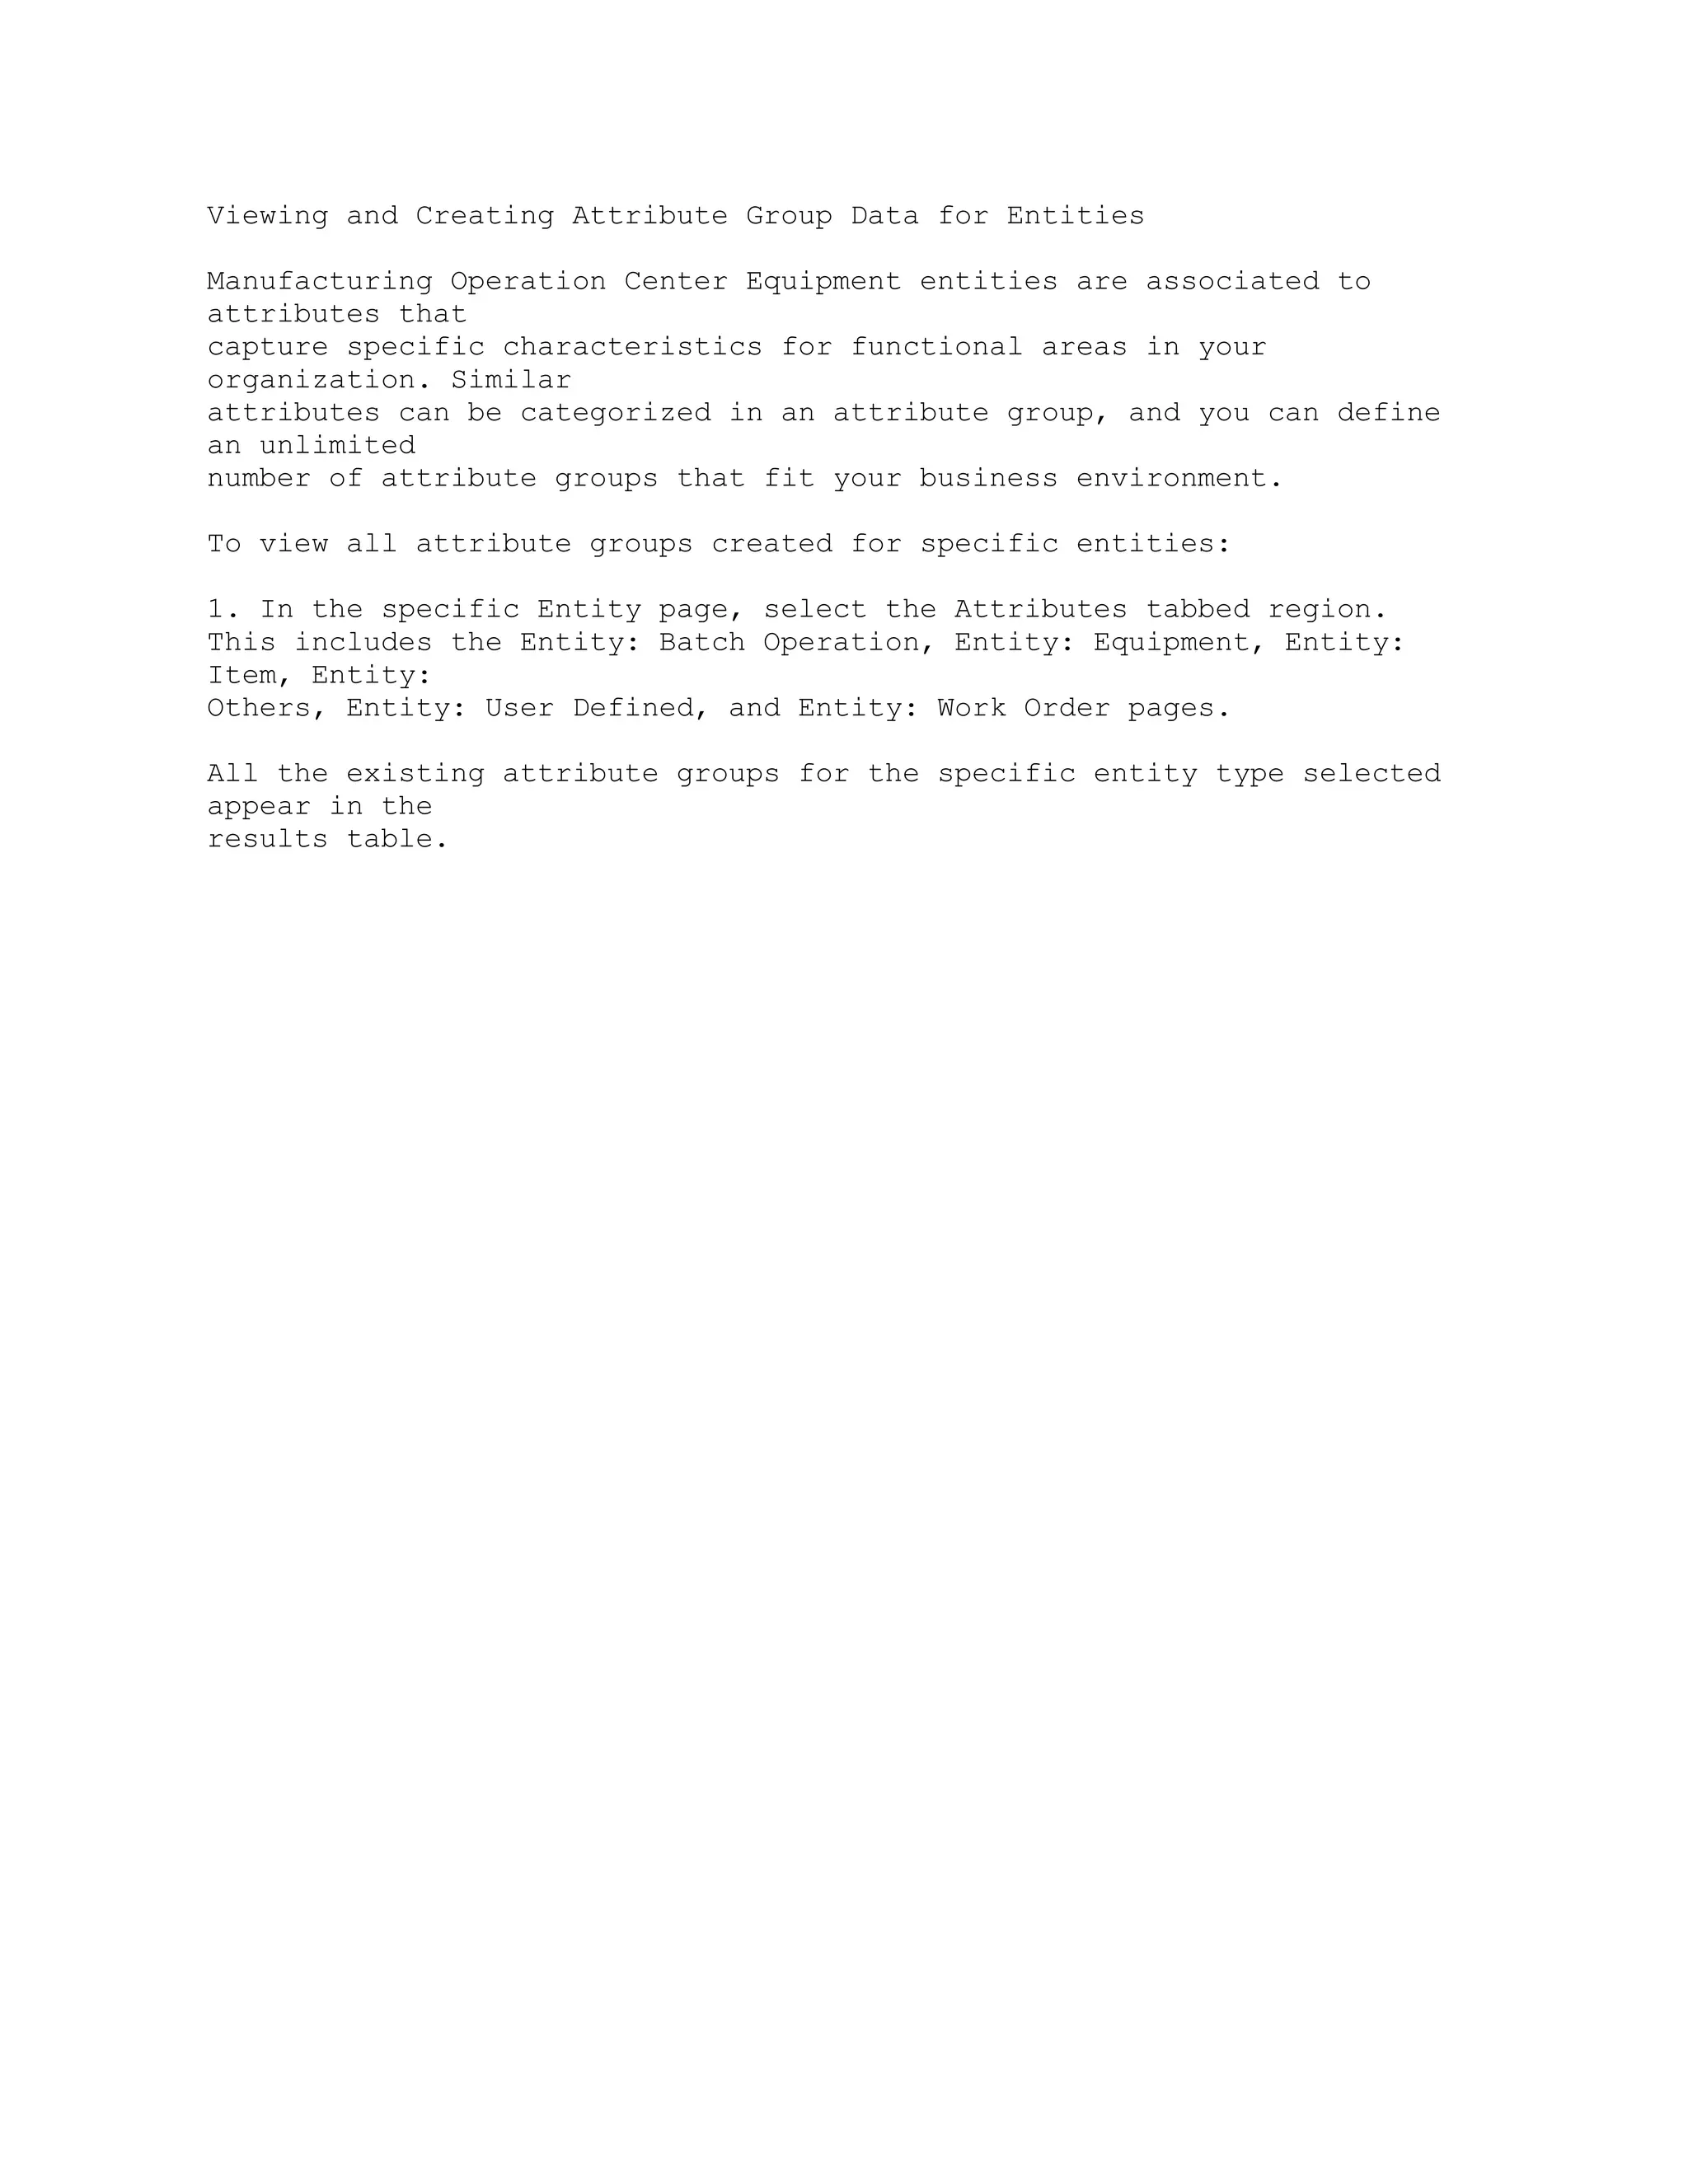
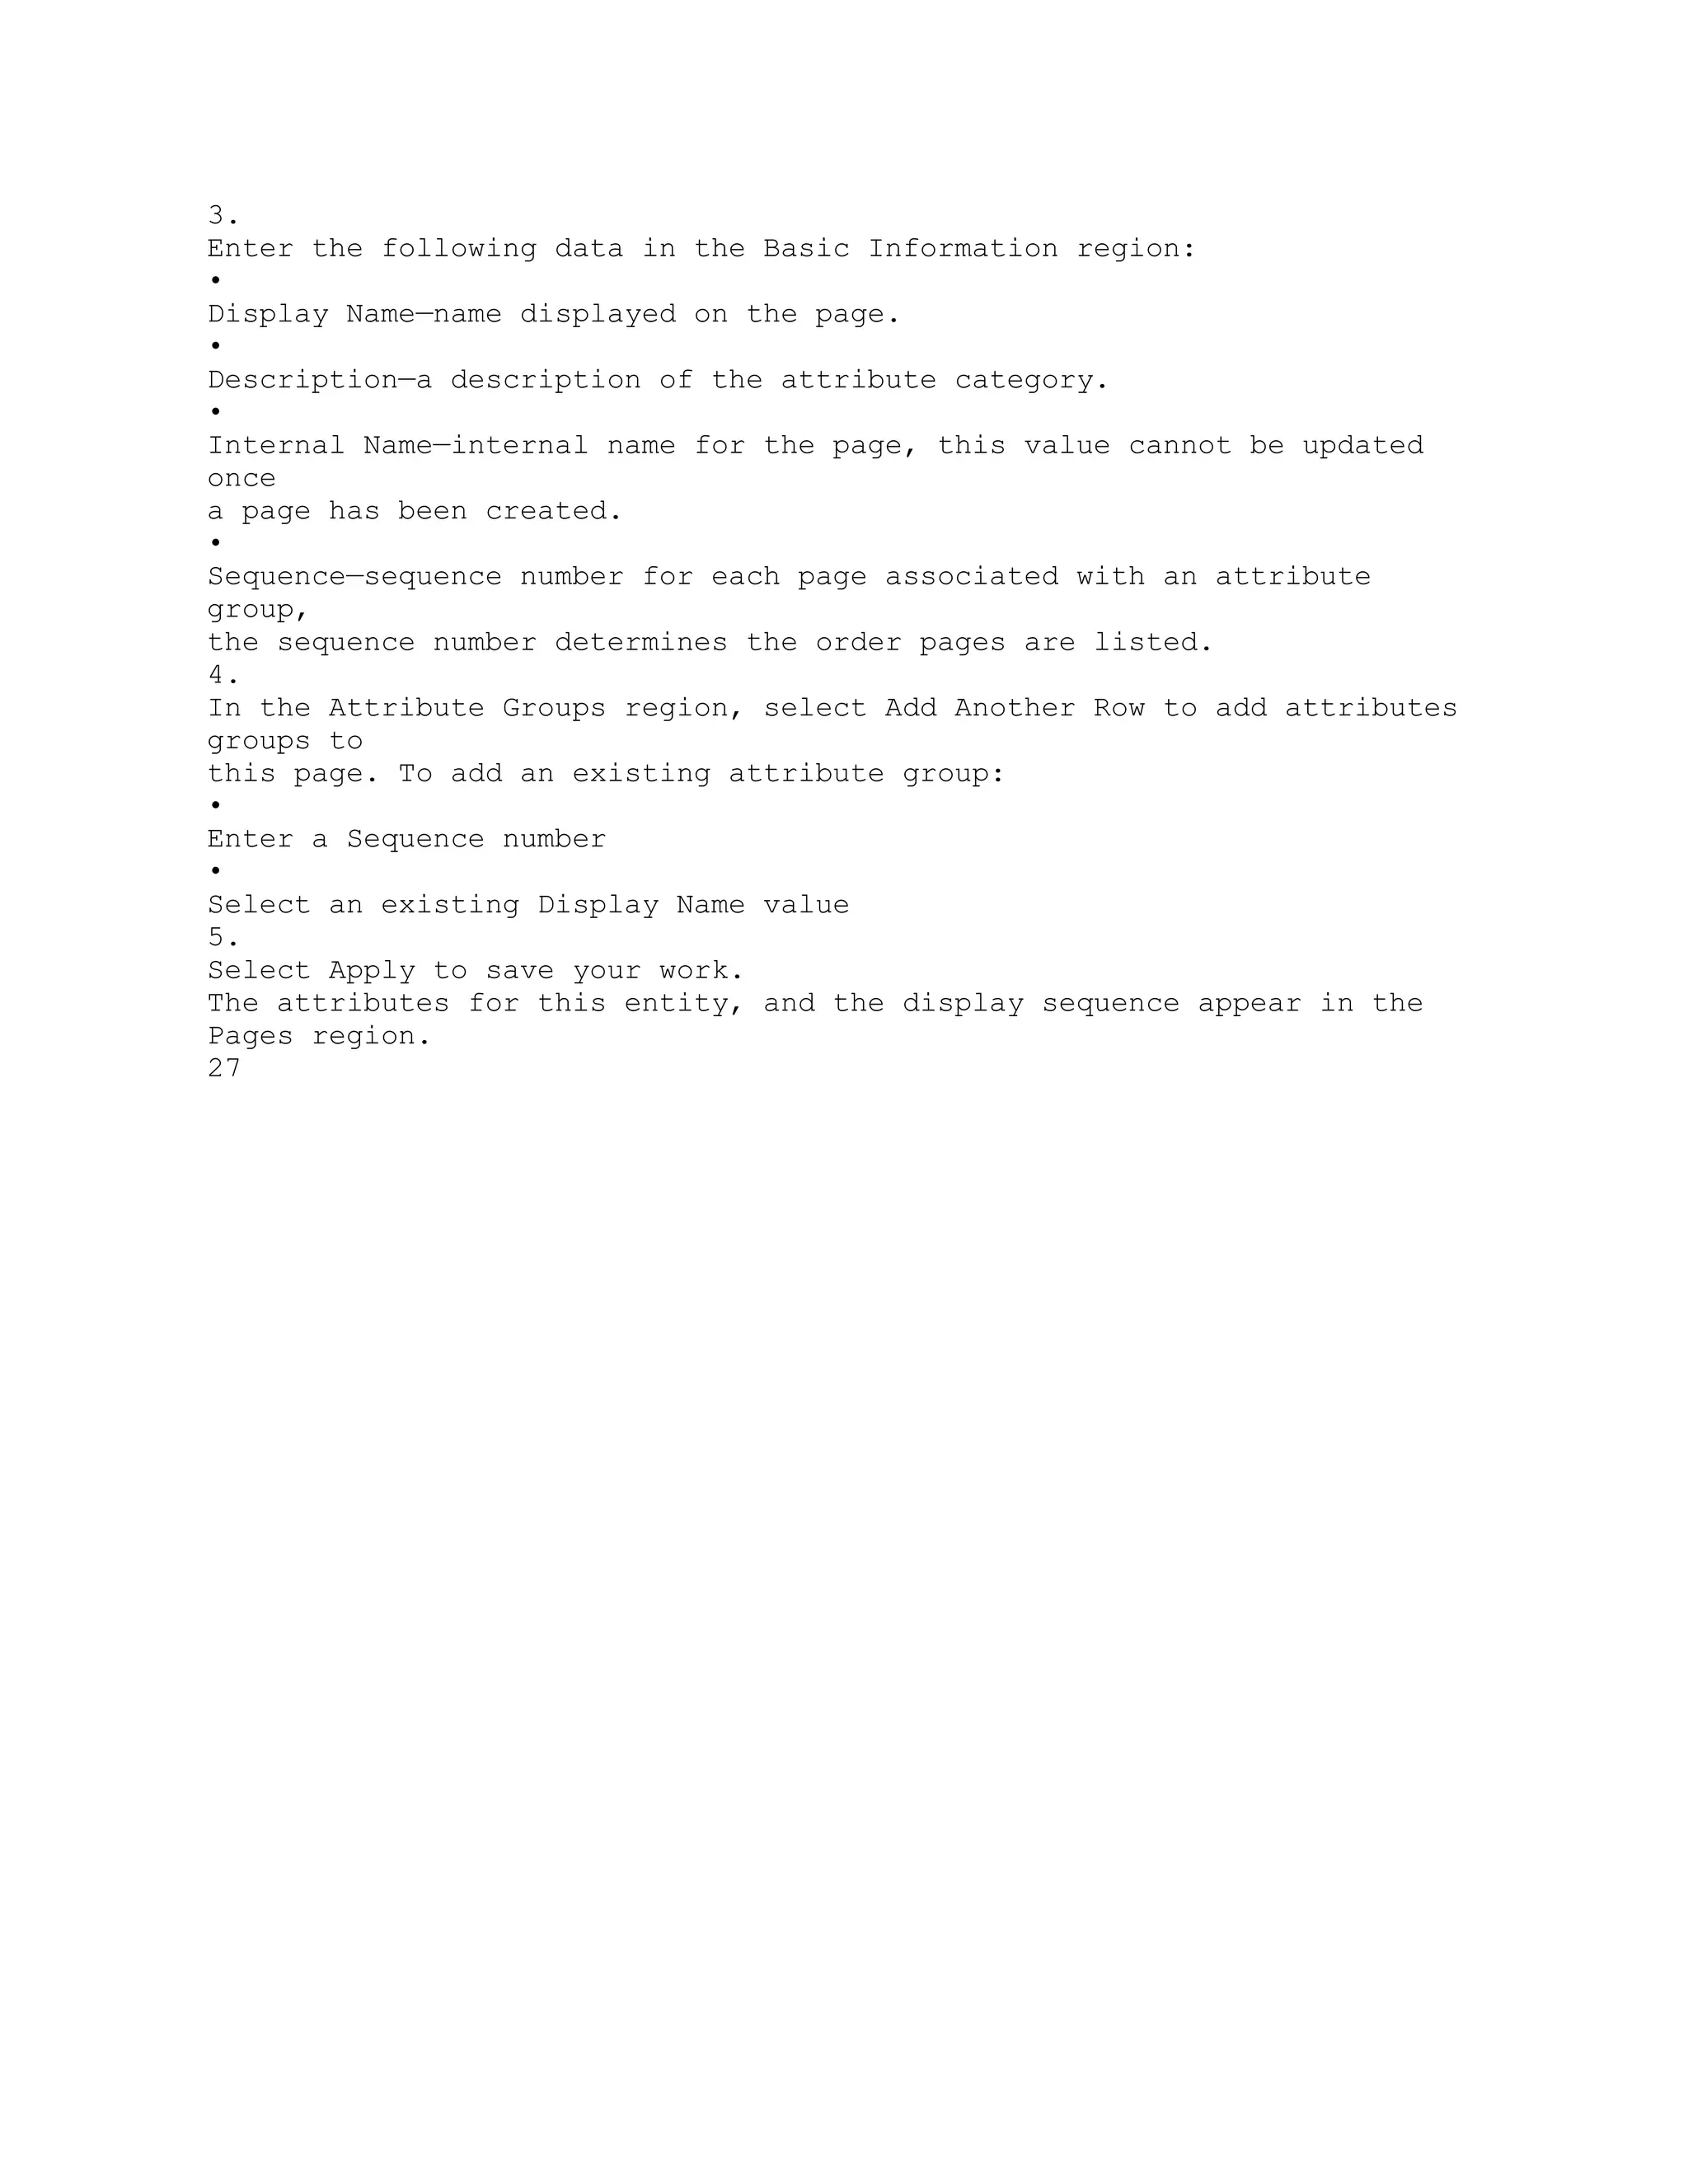
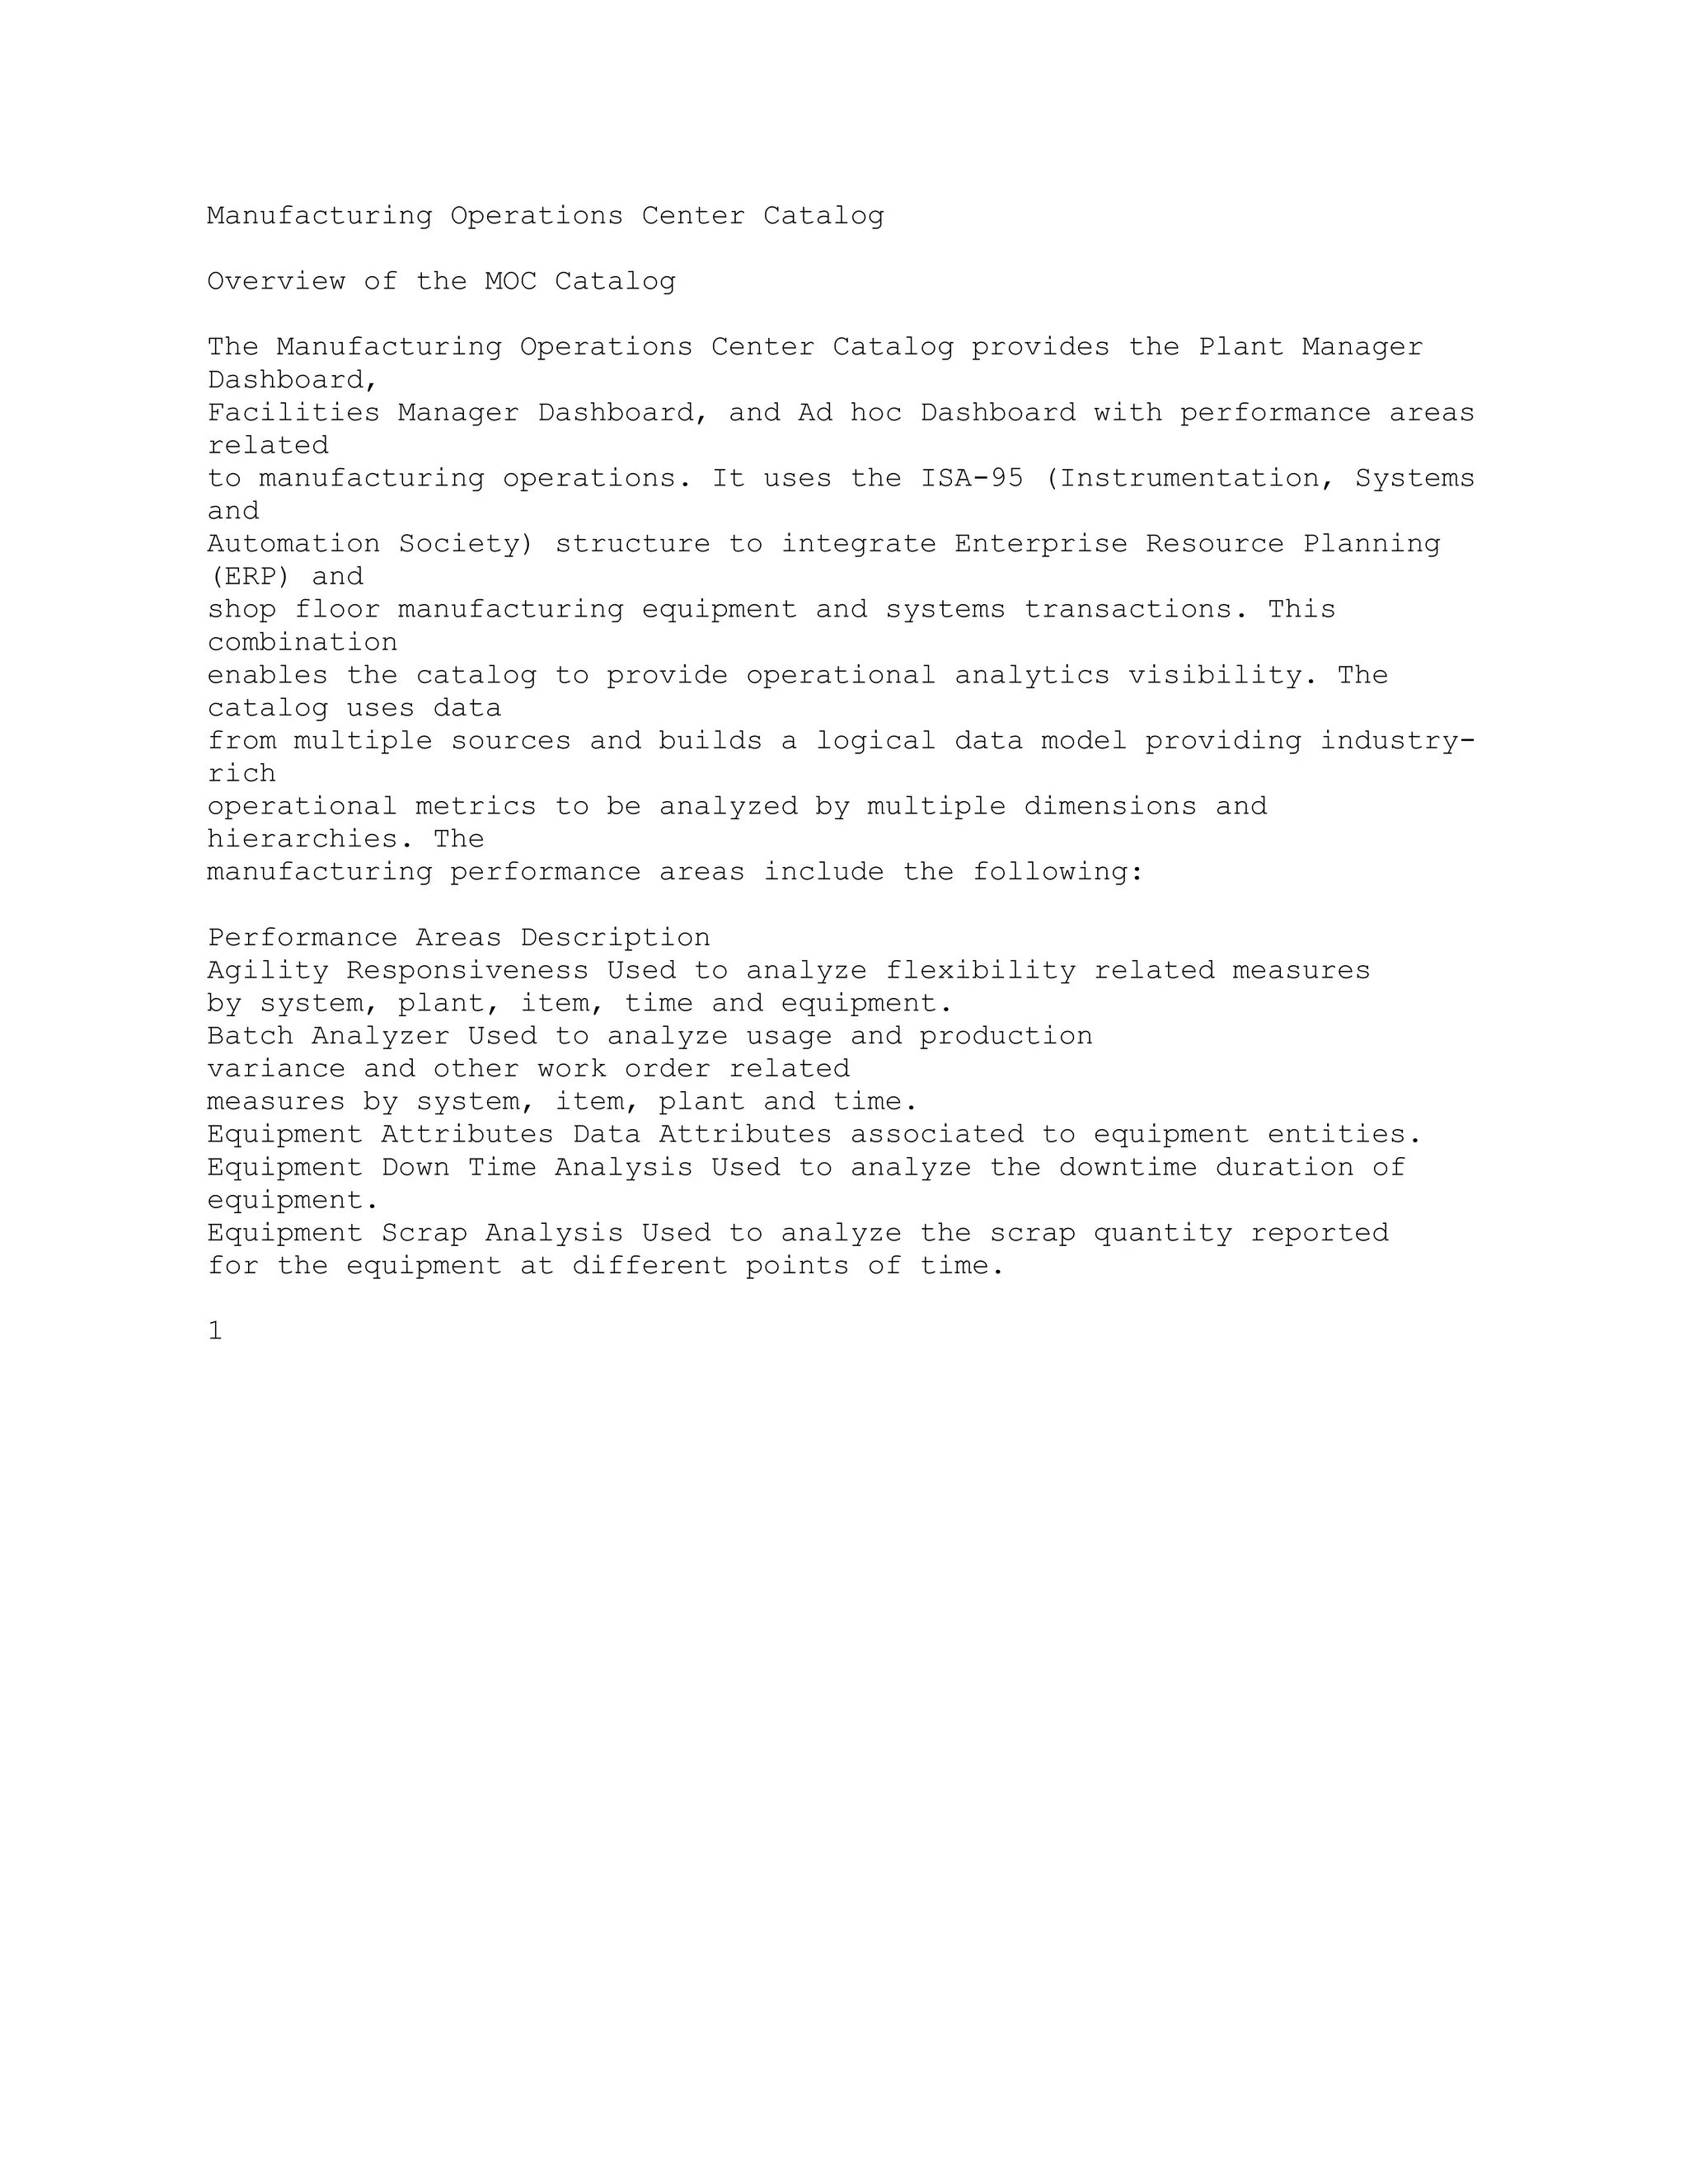
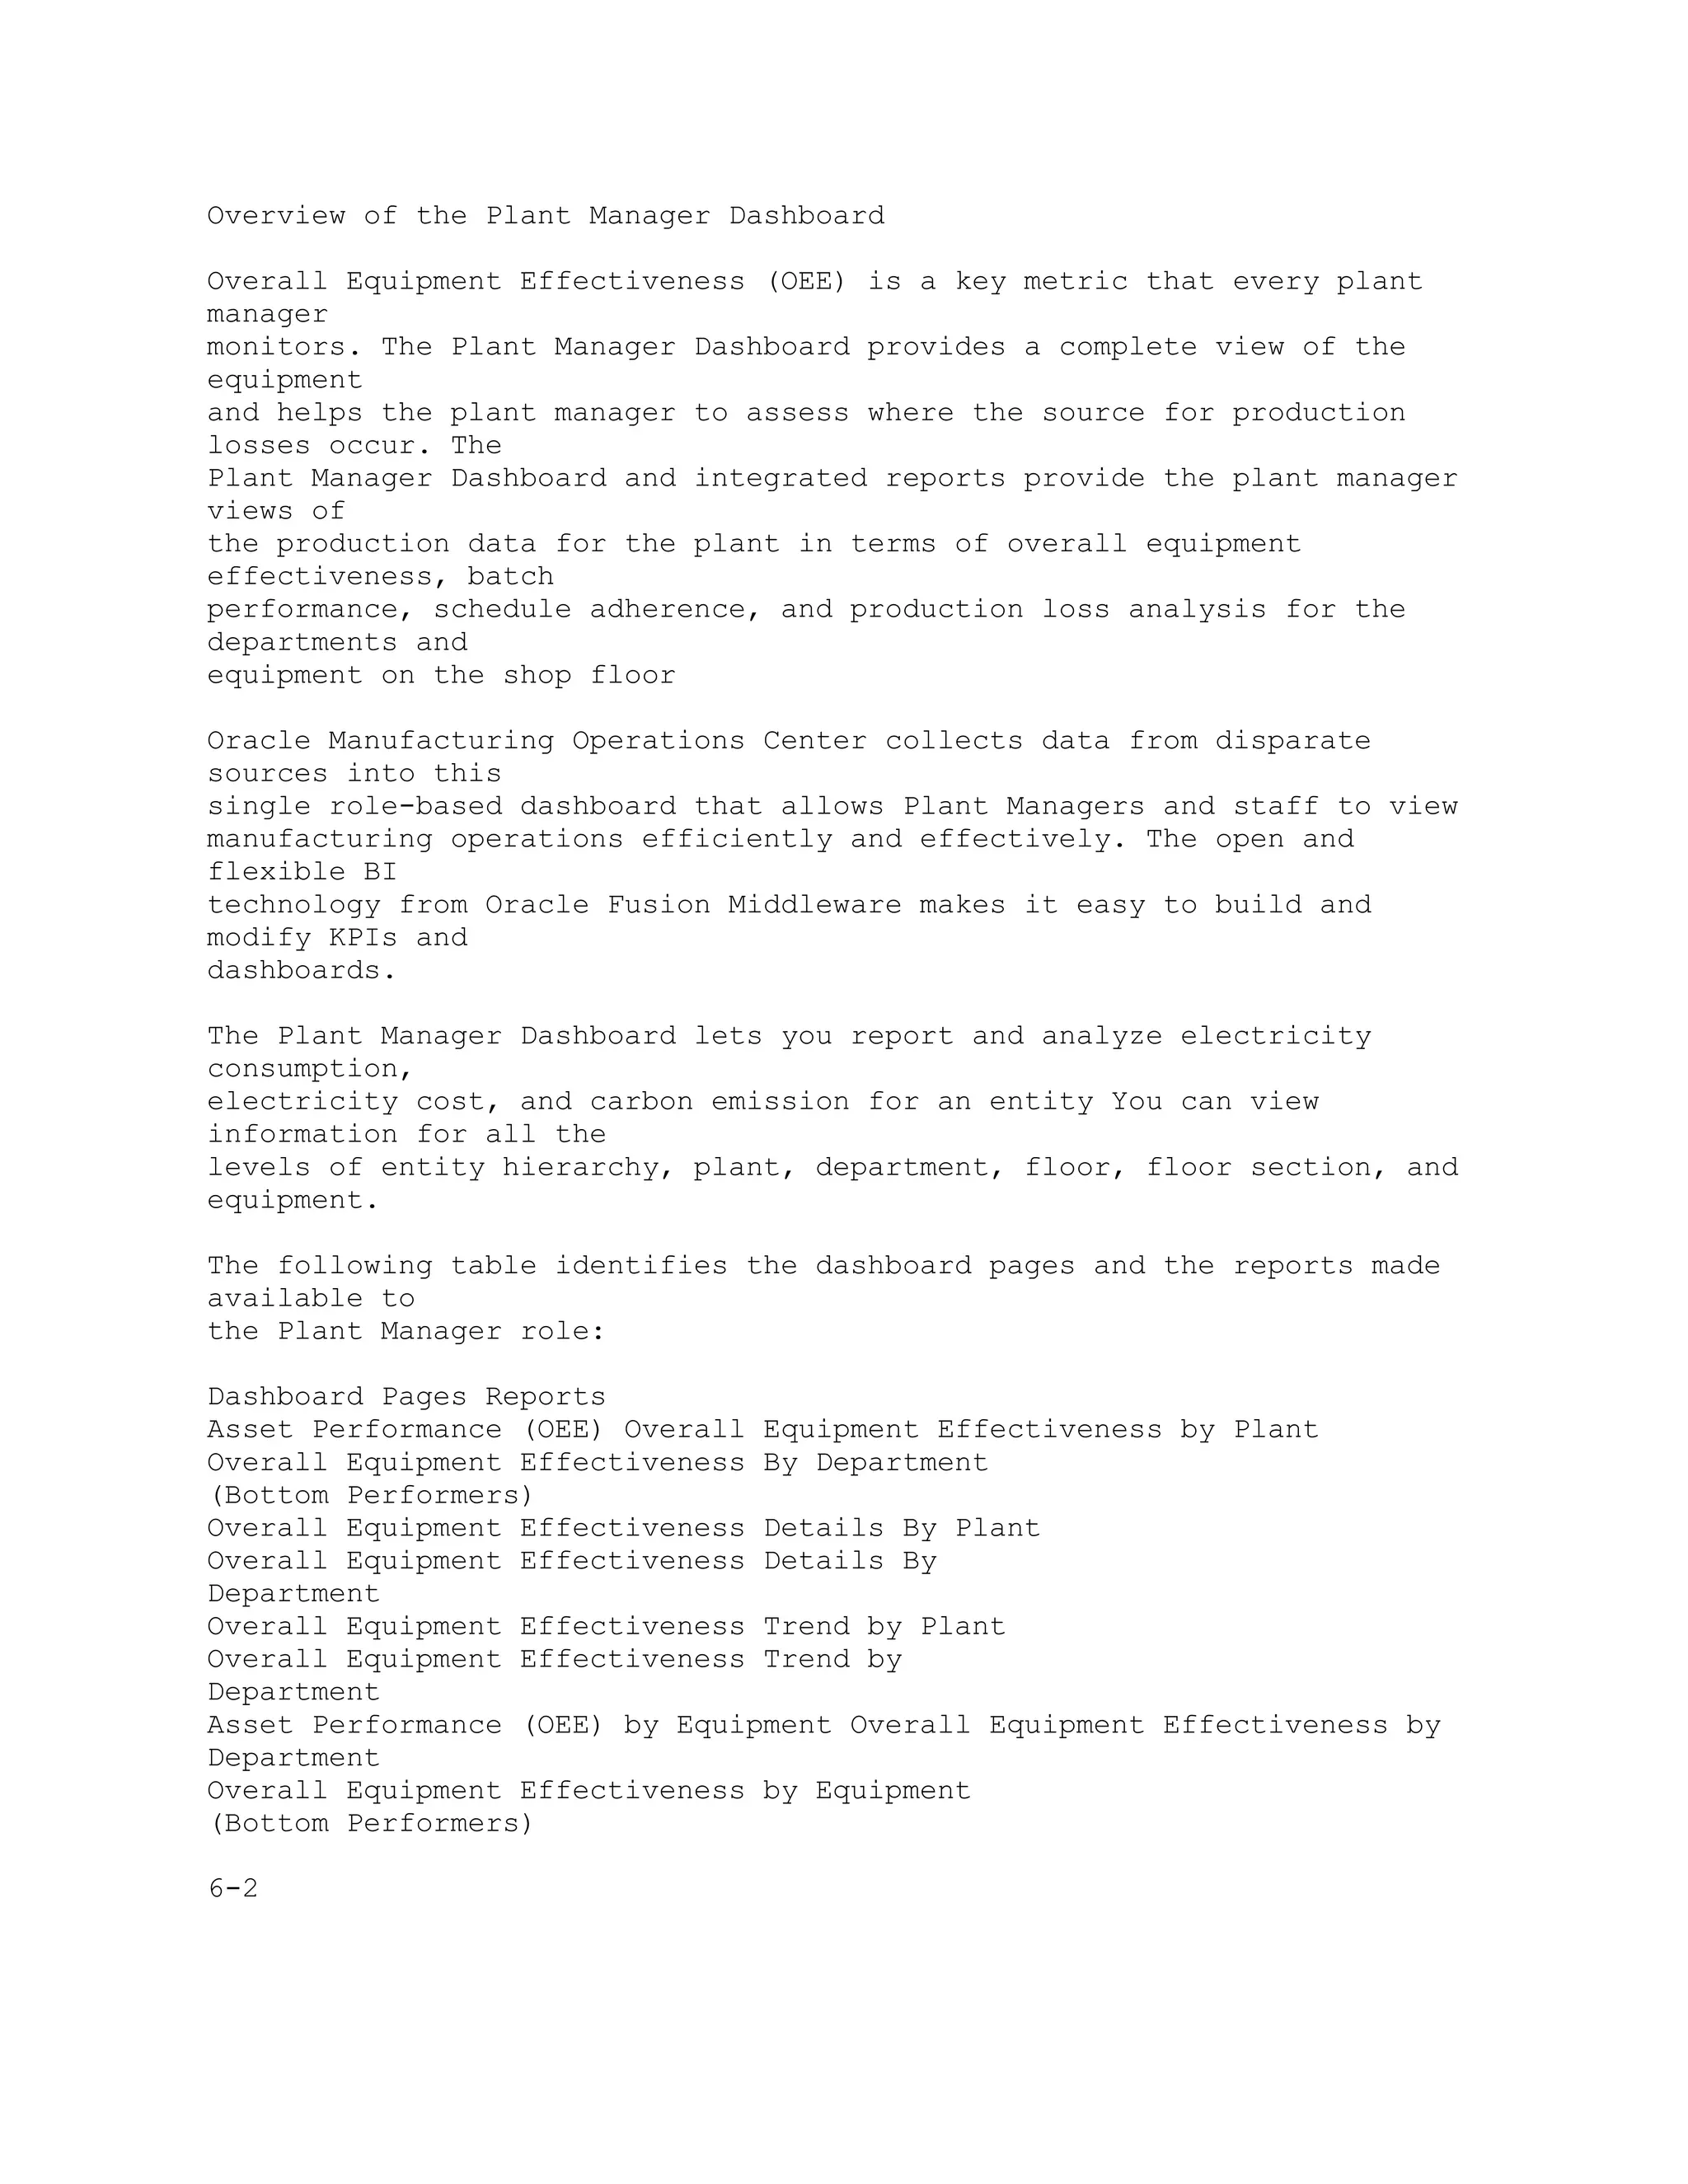
Add Attribute Groups for Others MOC Administrator > Extensible Attributes
Workbench > Others > [select Entity Name
link] > Classifications tab [Attribute Groups] >
[Add Attribute Groups]
Add Attribute Groups for Work Order MOC Administrator > Extensible
Attributes
Workbench > Work Orders > [select Entity
Name link] > Classifications tab [Attribute
Groups] > [Add Attribute Groups]
Add Pages for Batch Operation MOC Administrator > Extensible Attributes
Workbench > Batch Operations > [select Entity
Name link] > Classifications tab [Pages] >
[Add Pages for Batch Operation] > [Create
Page]
Add Pages for Equipment MOC Administrator > Extensible Attributes
Workbench > Equipment > [select Entity
Name link] > Classifications tab [Pages] >
[Add Pages for Equipment] > [Create Page]
Add Pages for Item MOC Administrator > Extensible Attributes
Workbench > Items > [select Entity Name link]
> Classifications tab [Pages] > [Add Pages for
Item] > [Create Page]
Add Pages for Others MOC Administrator > Extensible Attributes
Workbench > Others > [select Entity Name
link] > Classifications tab [Pages] > [Add
Pages for Others] > [Create Page]
Add Pages for Work Order MOC Administrator > Extensible Attributes
Workbench >Work Orders > [select Entity
Name link] > Classifications tab [Pages] >
[Add Pages for Work Order] > [Create Page]
Application Object Library Lookups Development Manager Responsibility >
Lookups
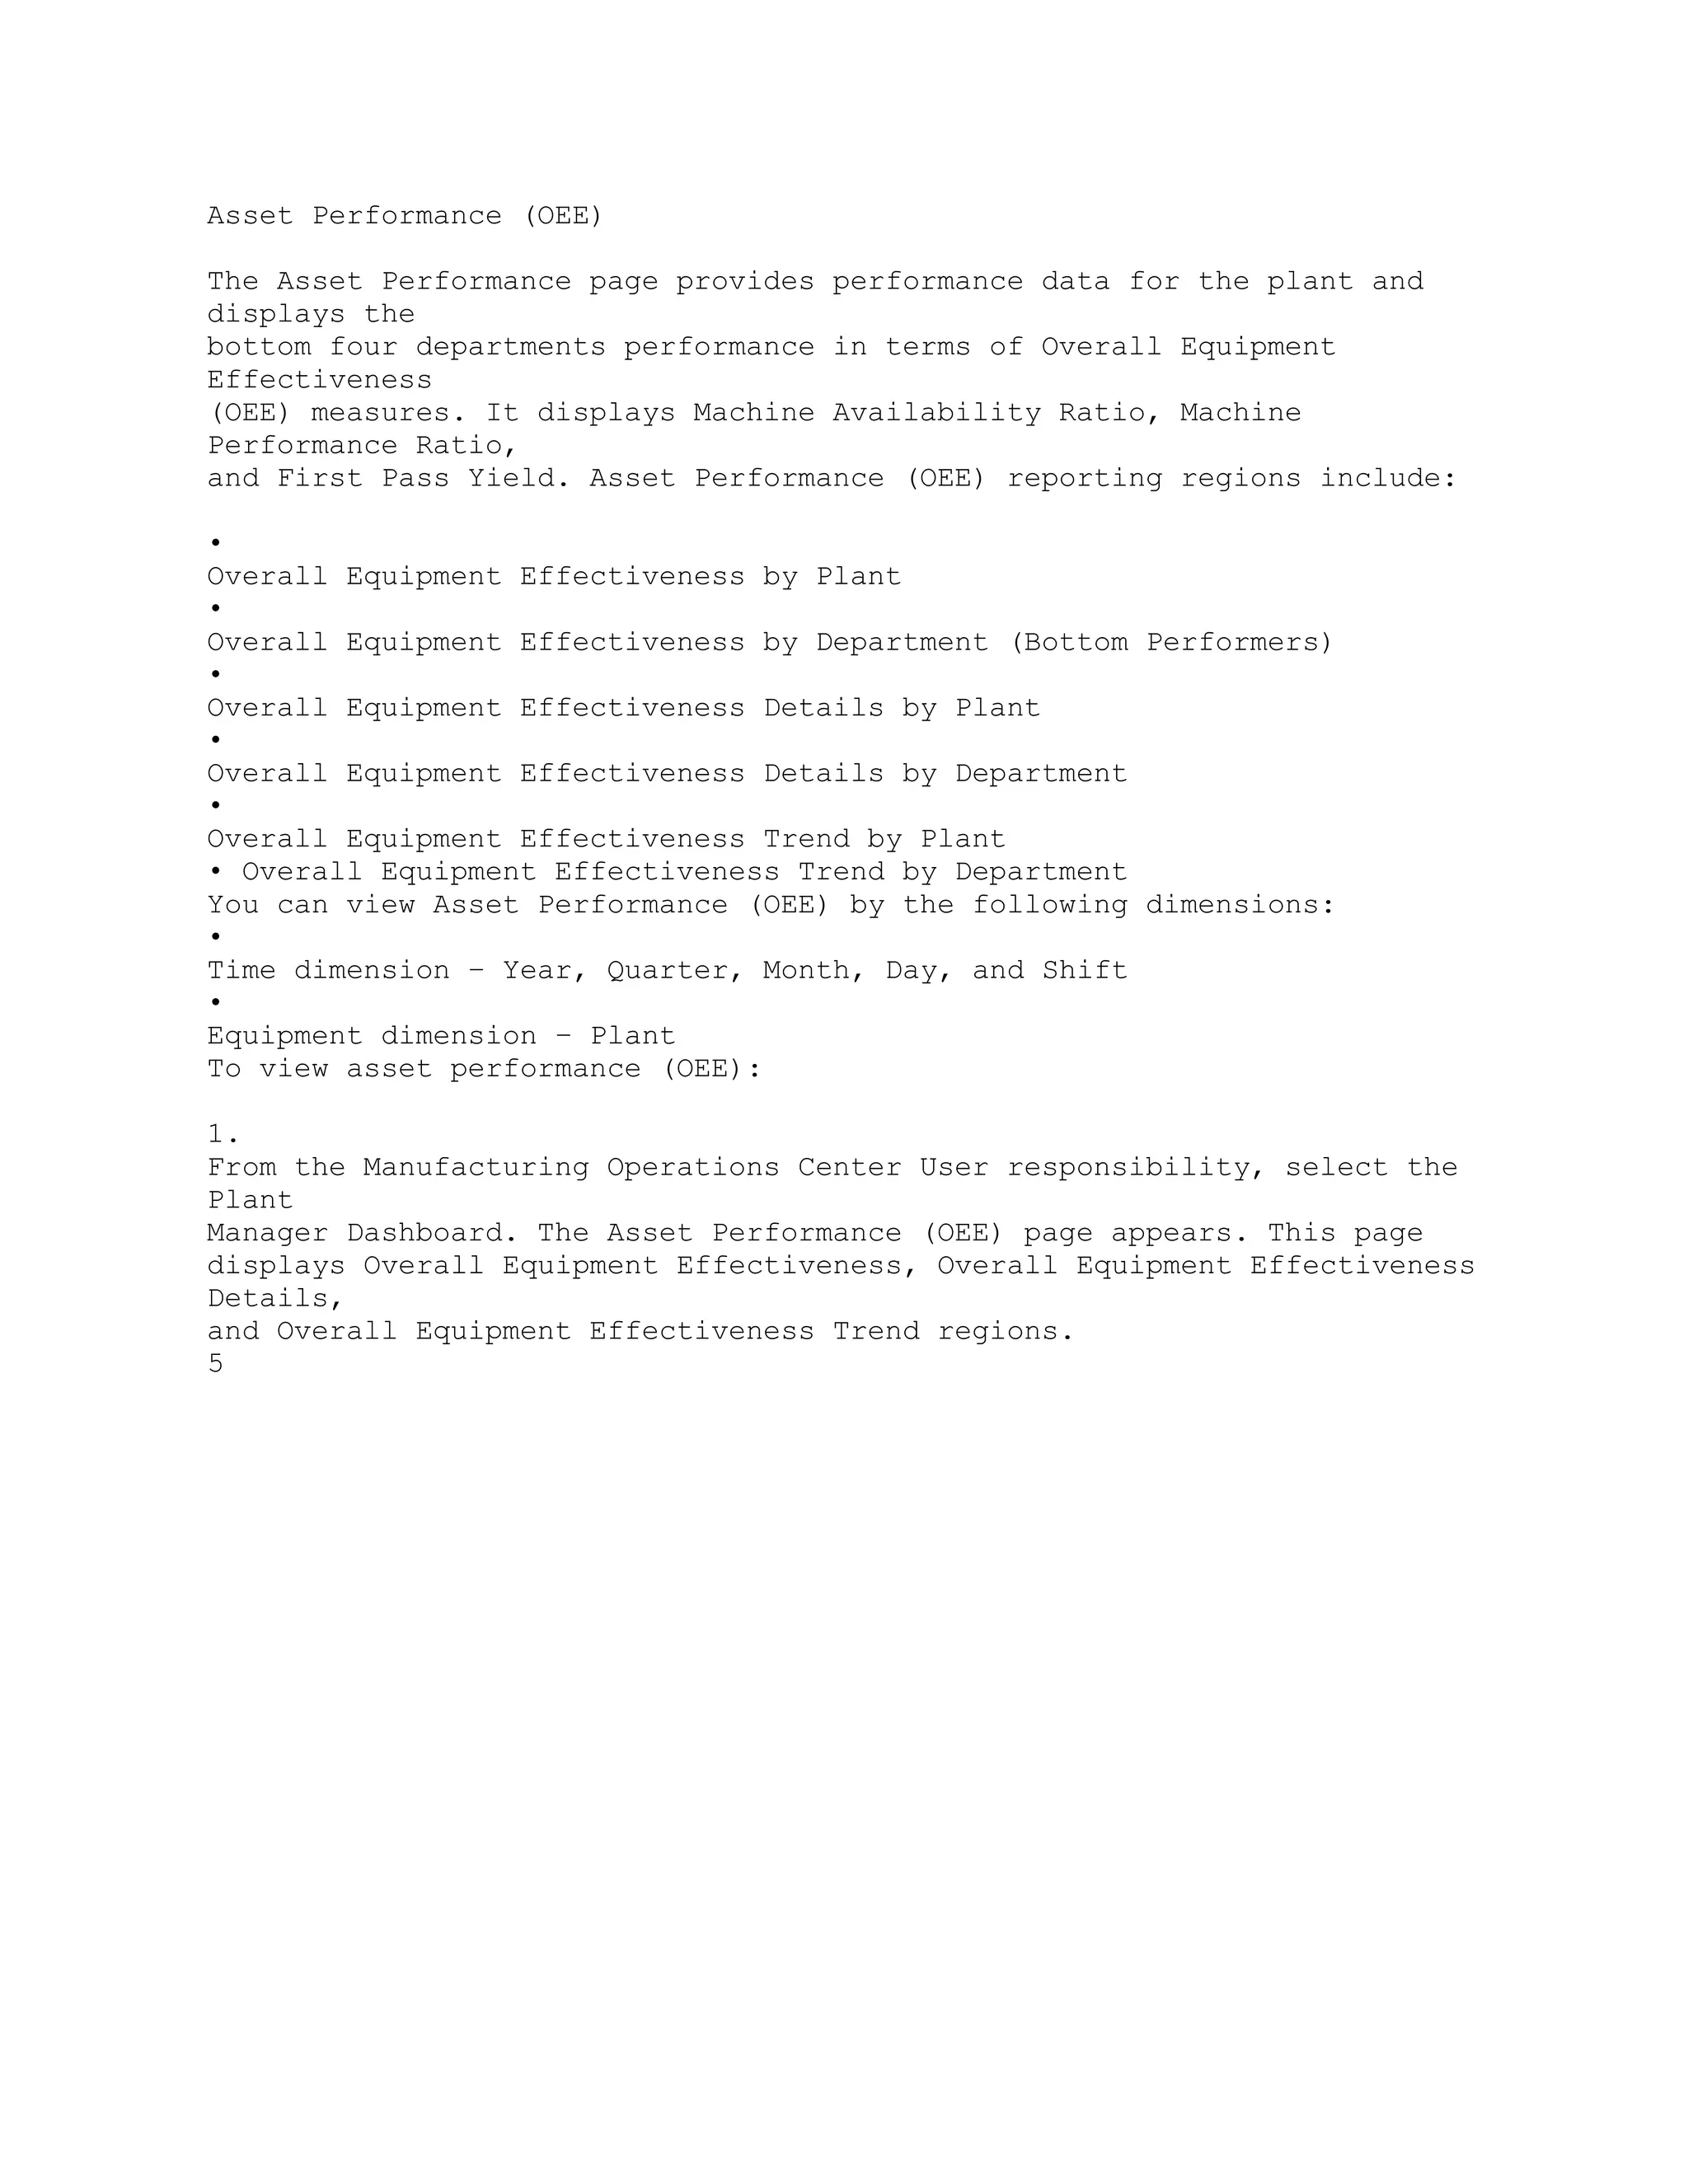
Asset Performance (OEE) MOC User > Manufacturing Operations
Center Analytics > Plant Manager Dashboard
A-2](https://image.slidesharecdn.com/12-1-man-operationcenter-ug2-150223055255-conversion-gate02/75/12-1-man-operation-center-ug-2-162-2048.jpg)
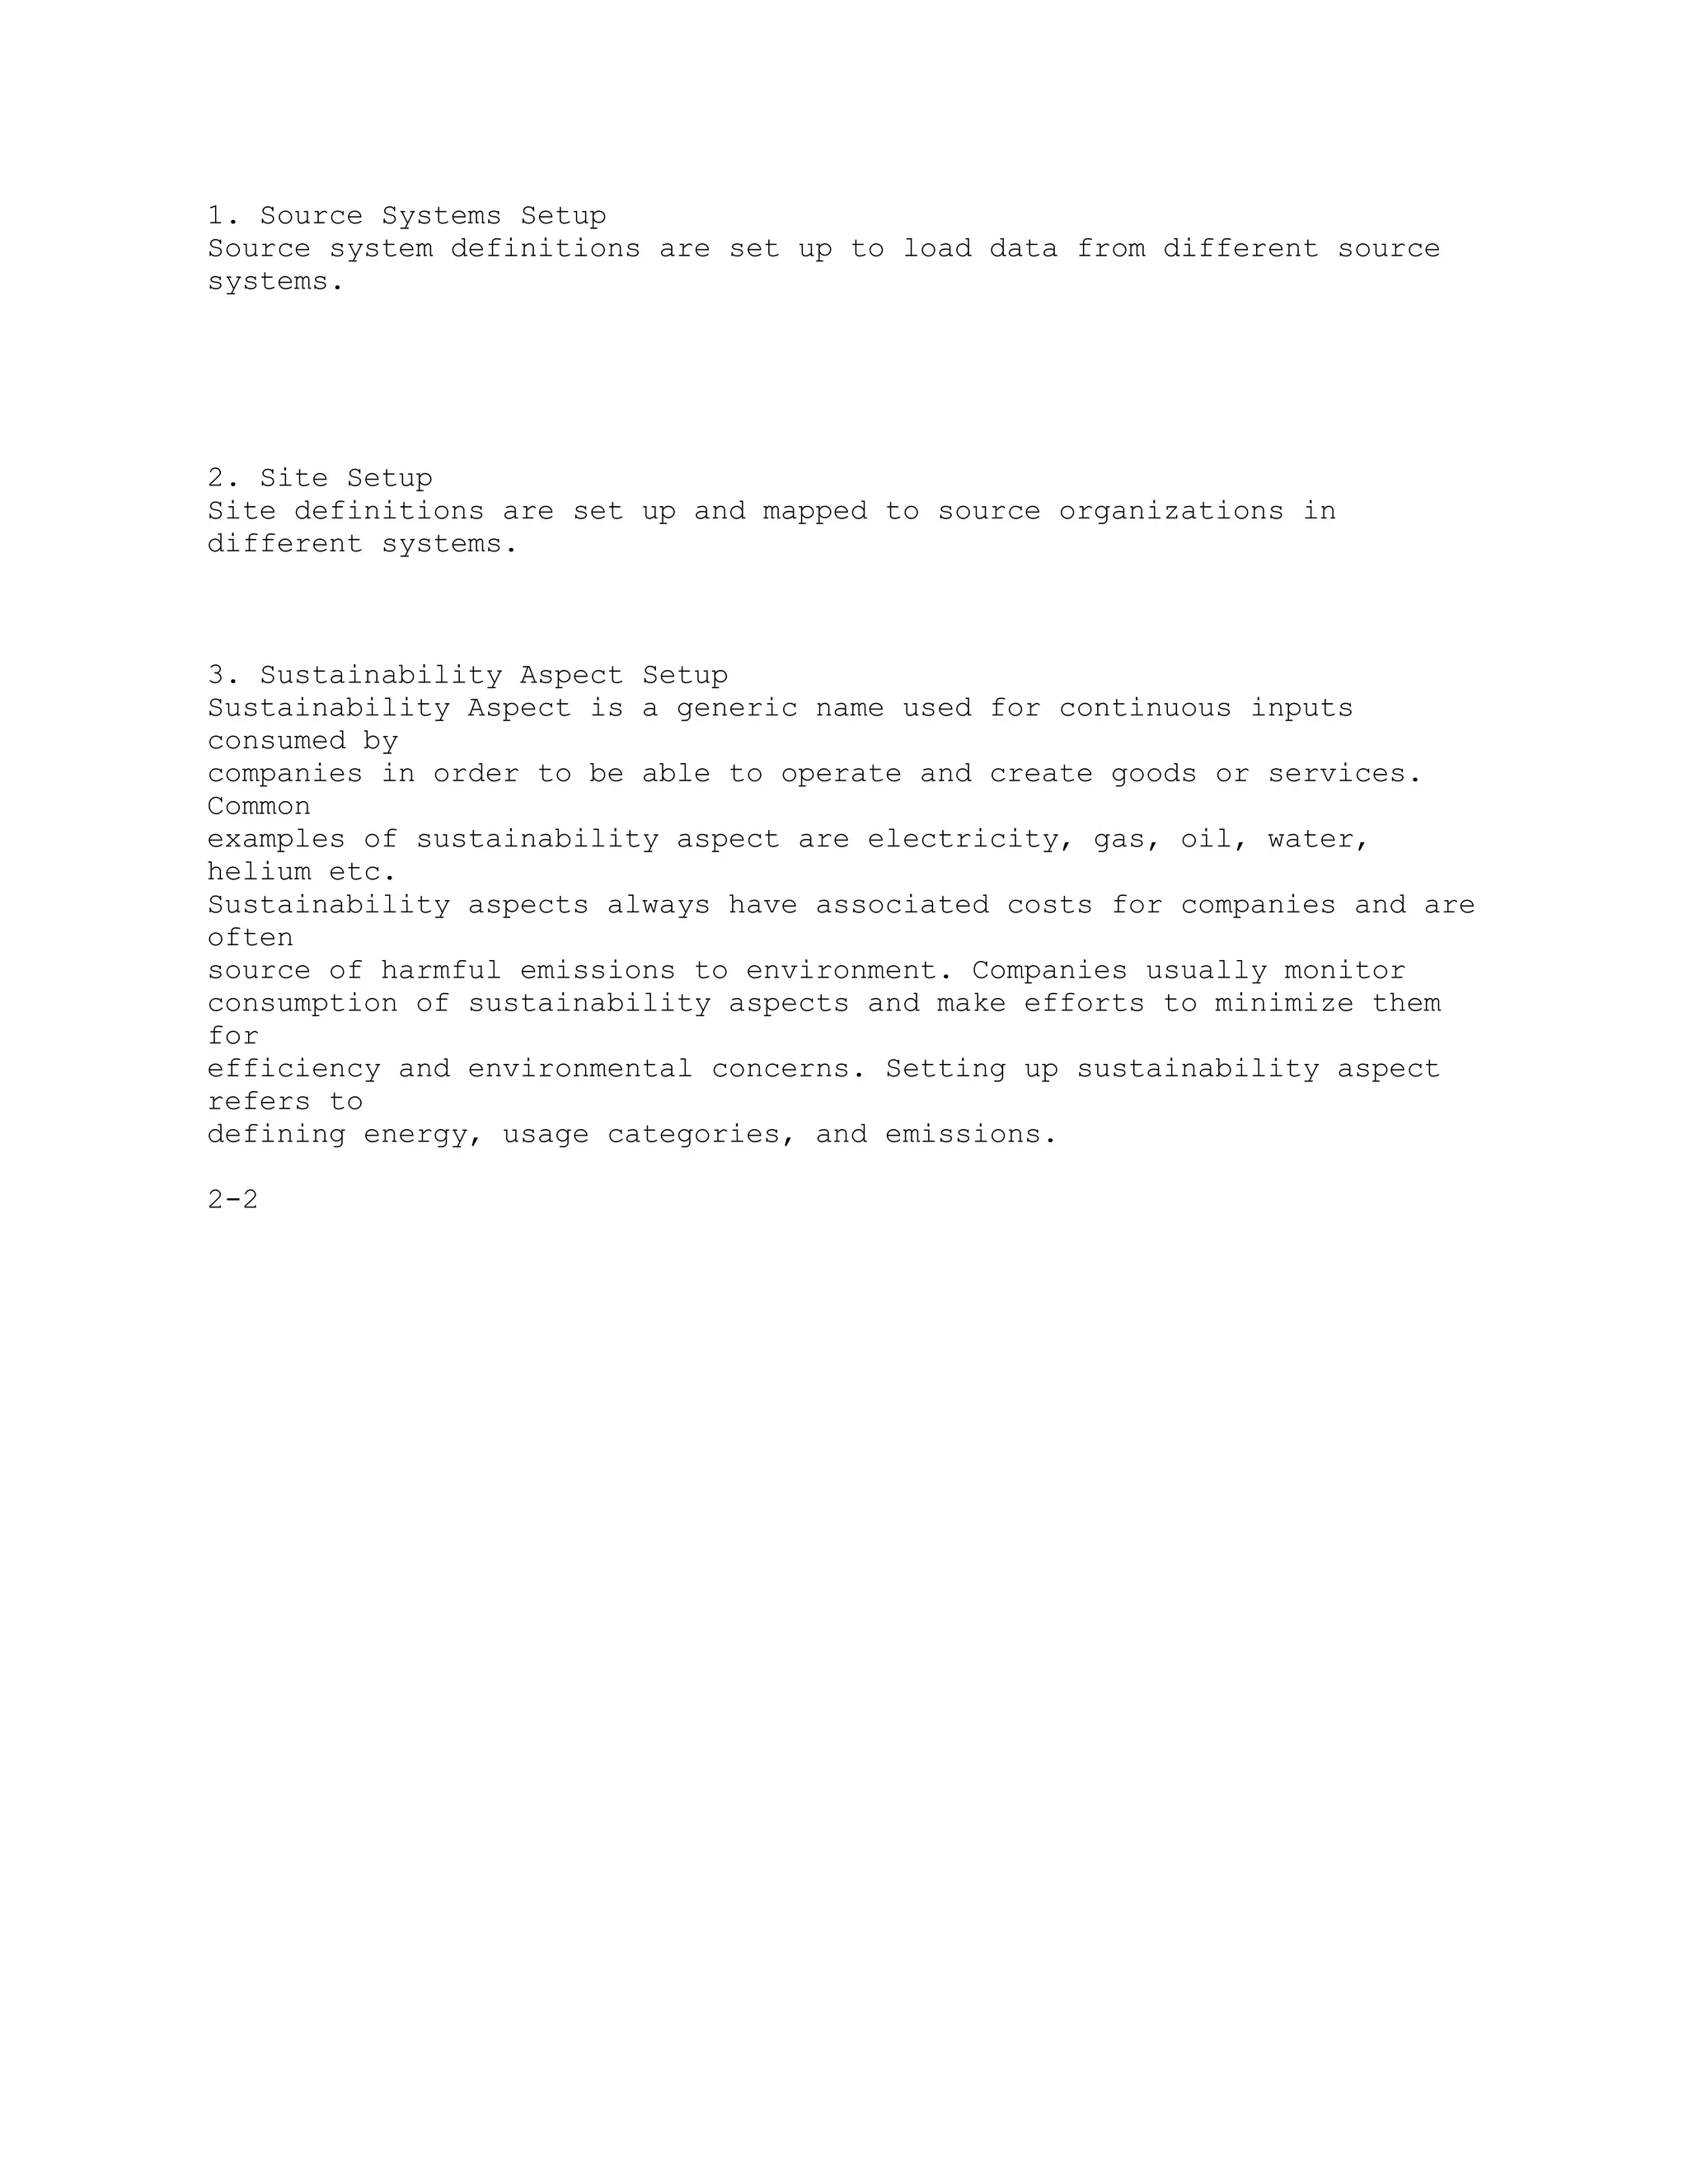
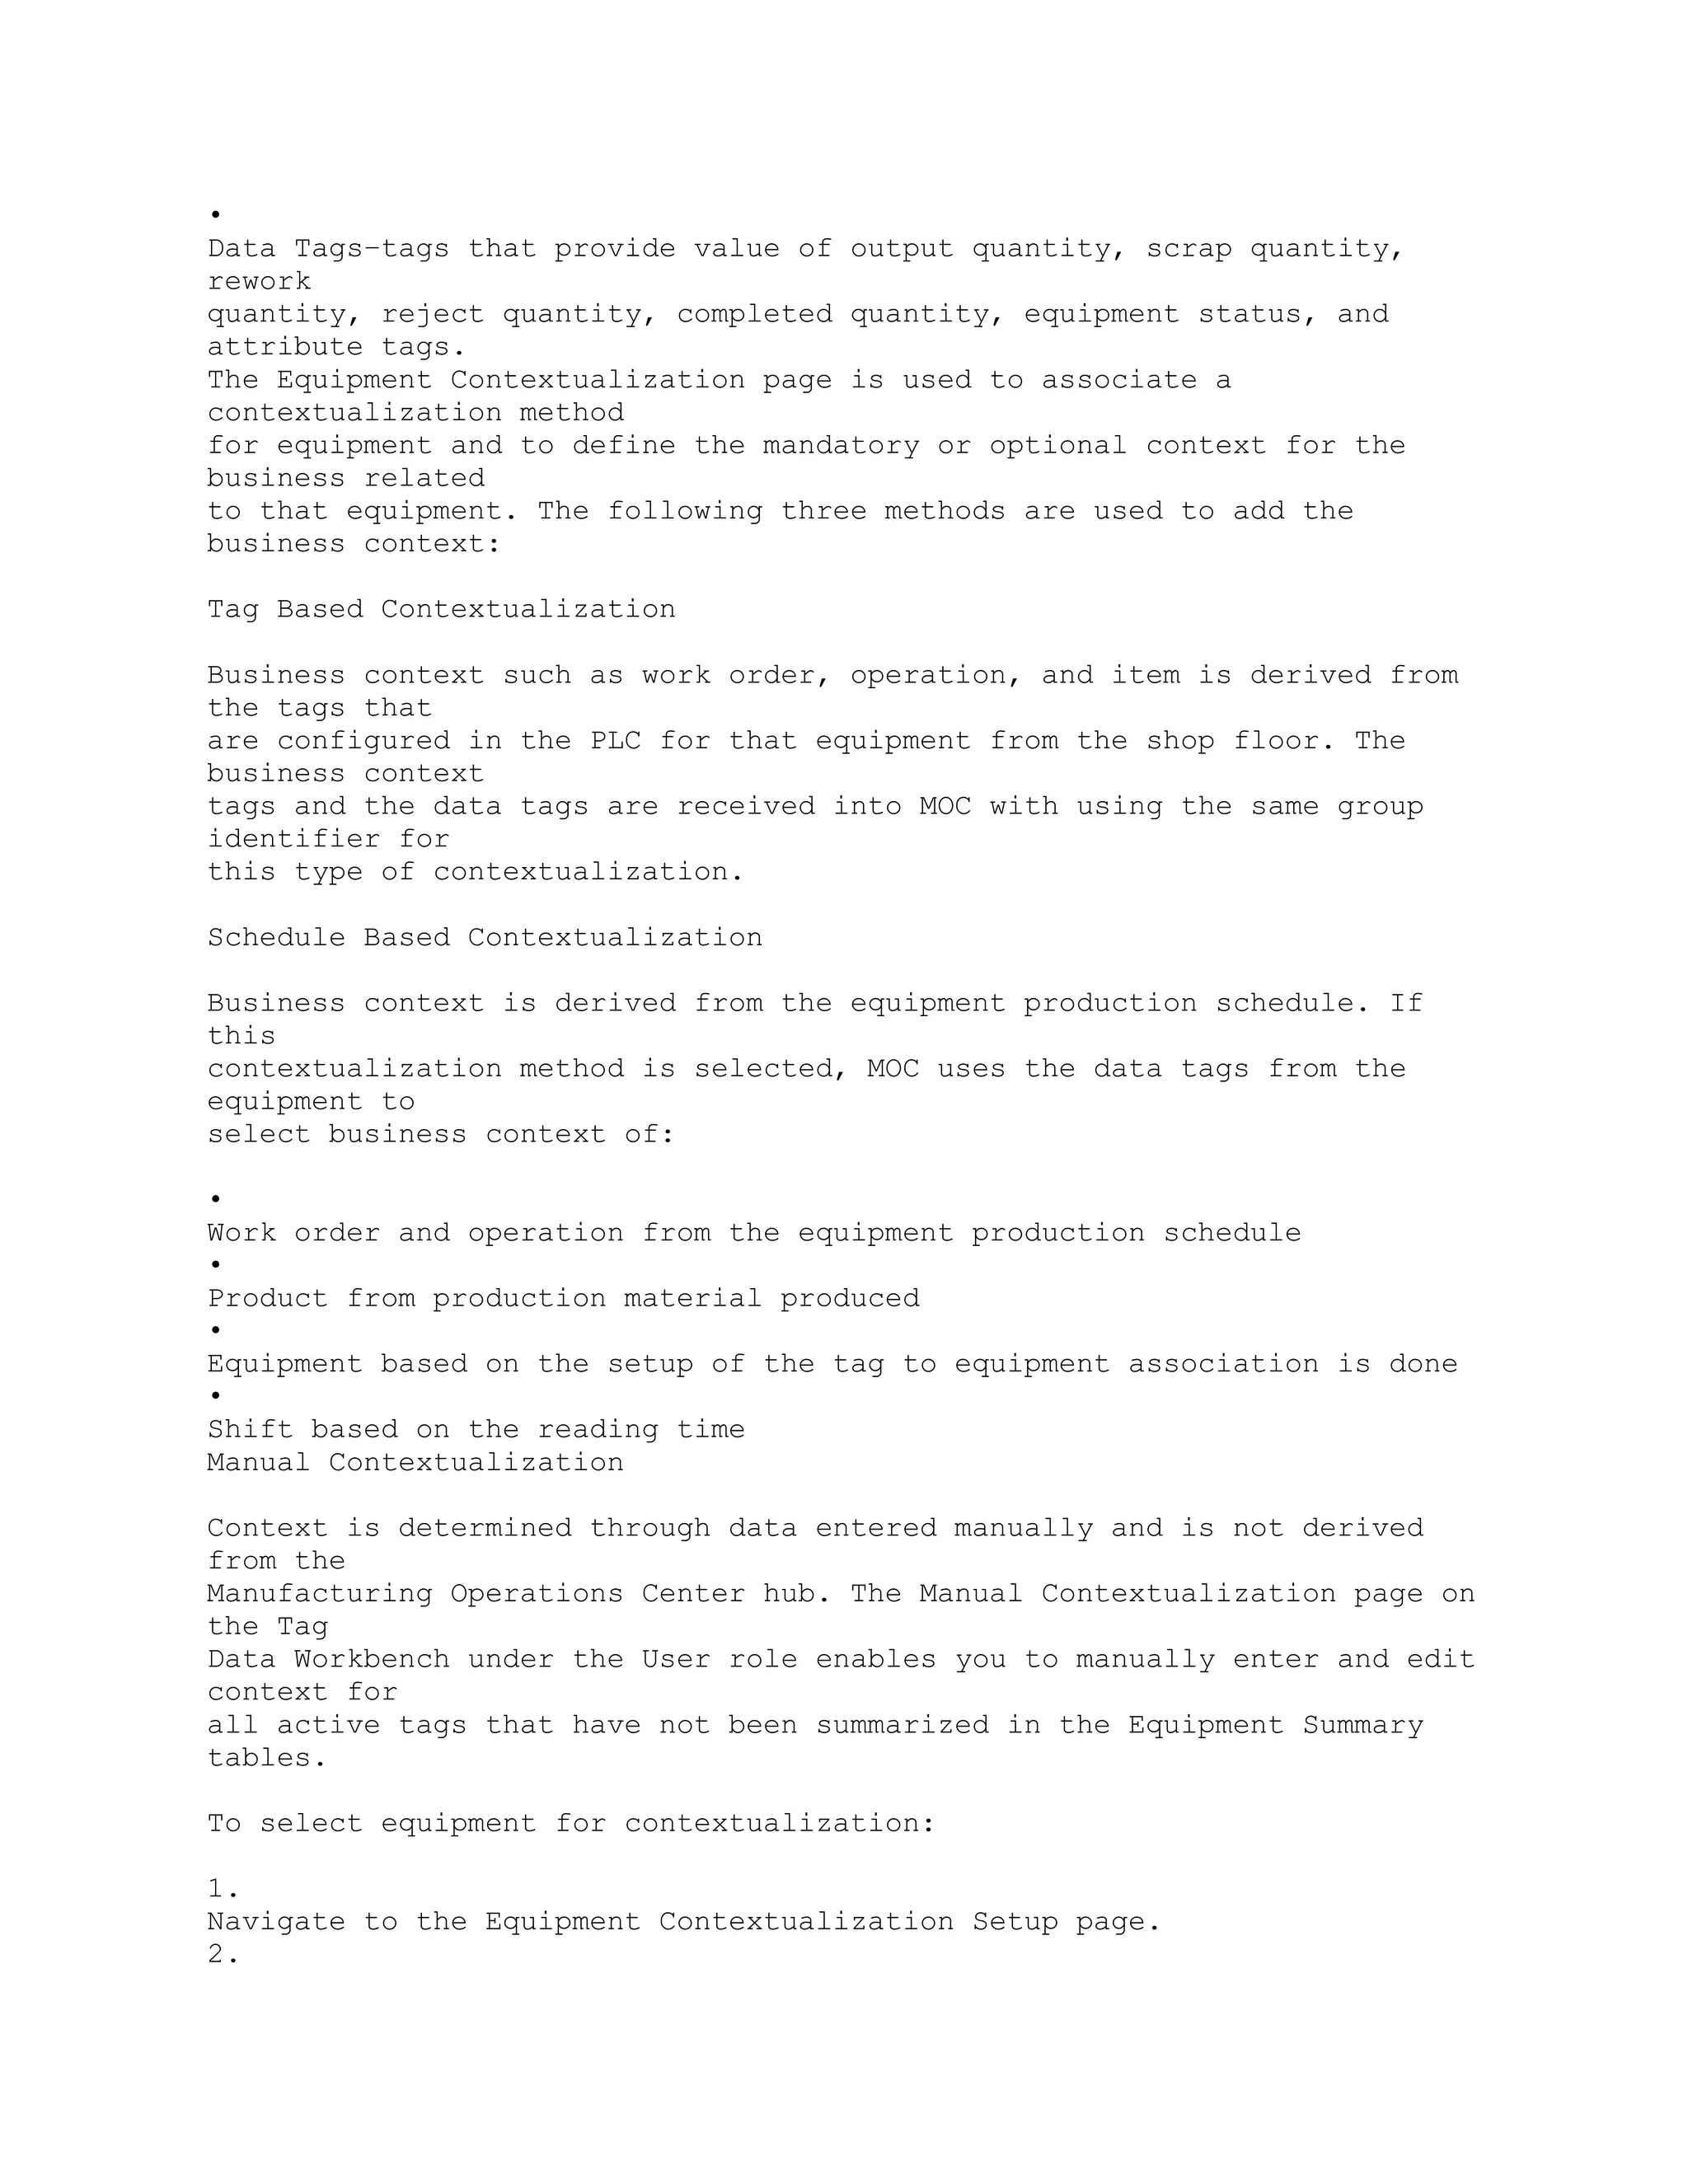
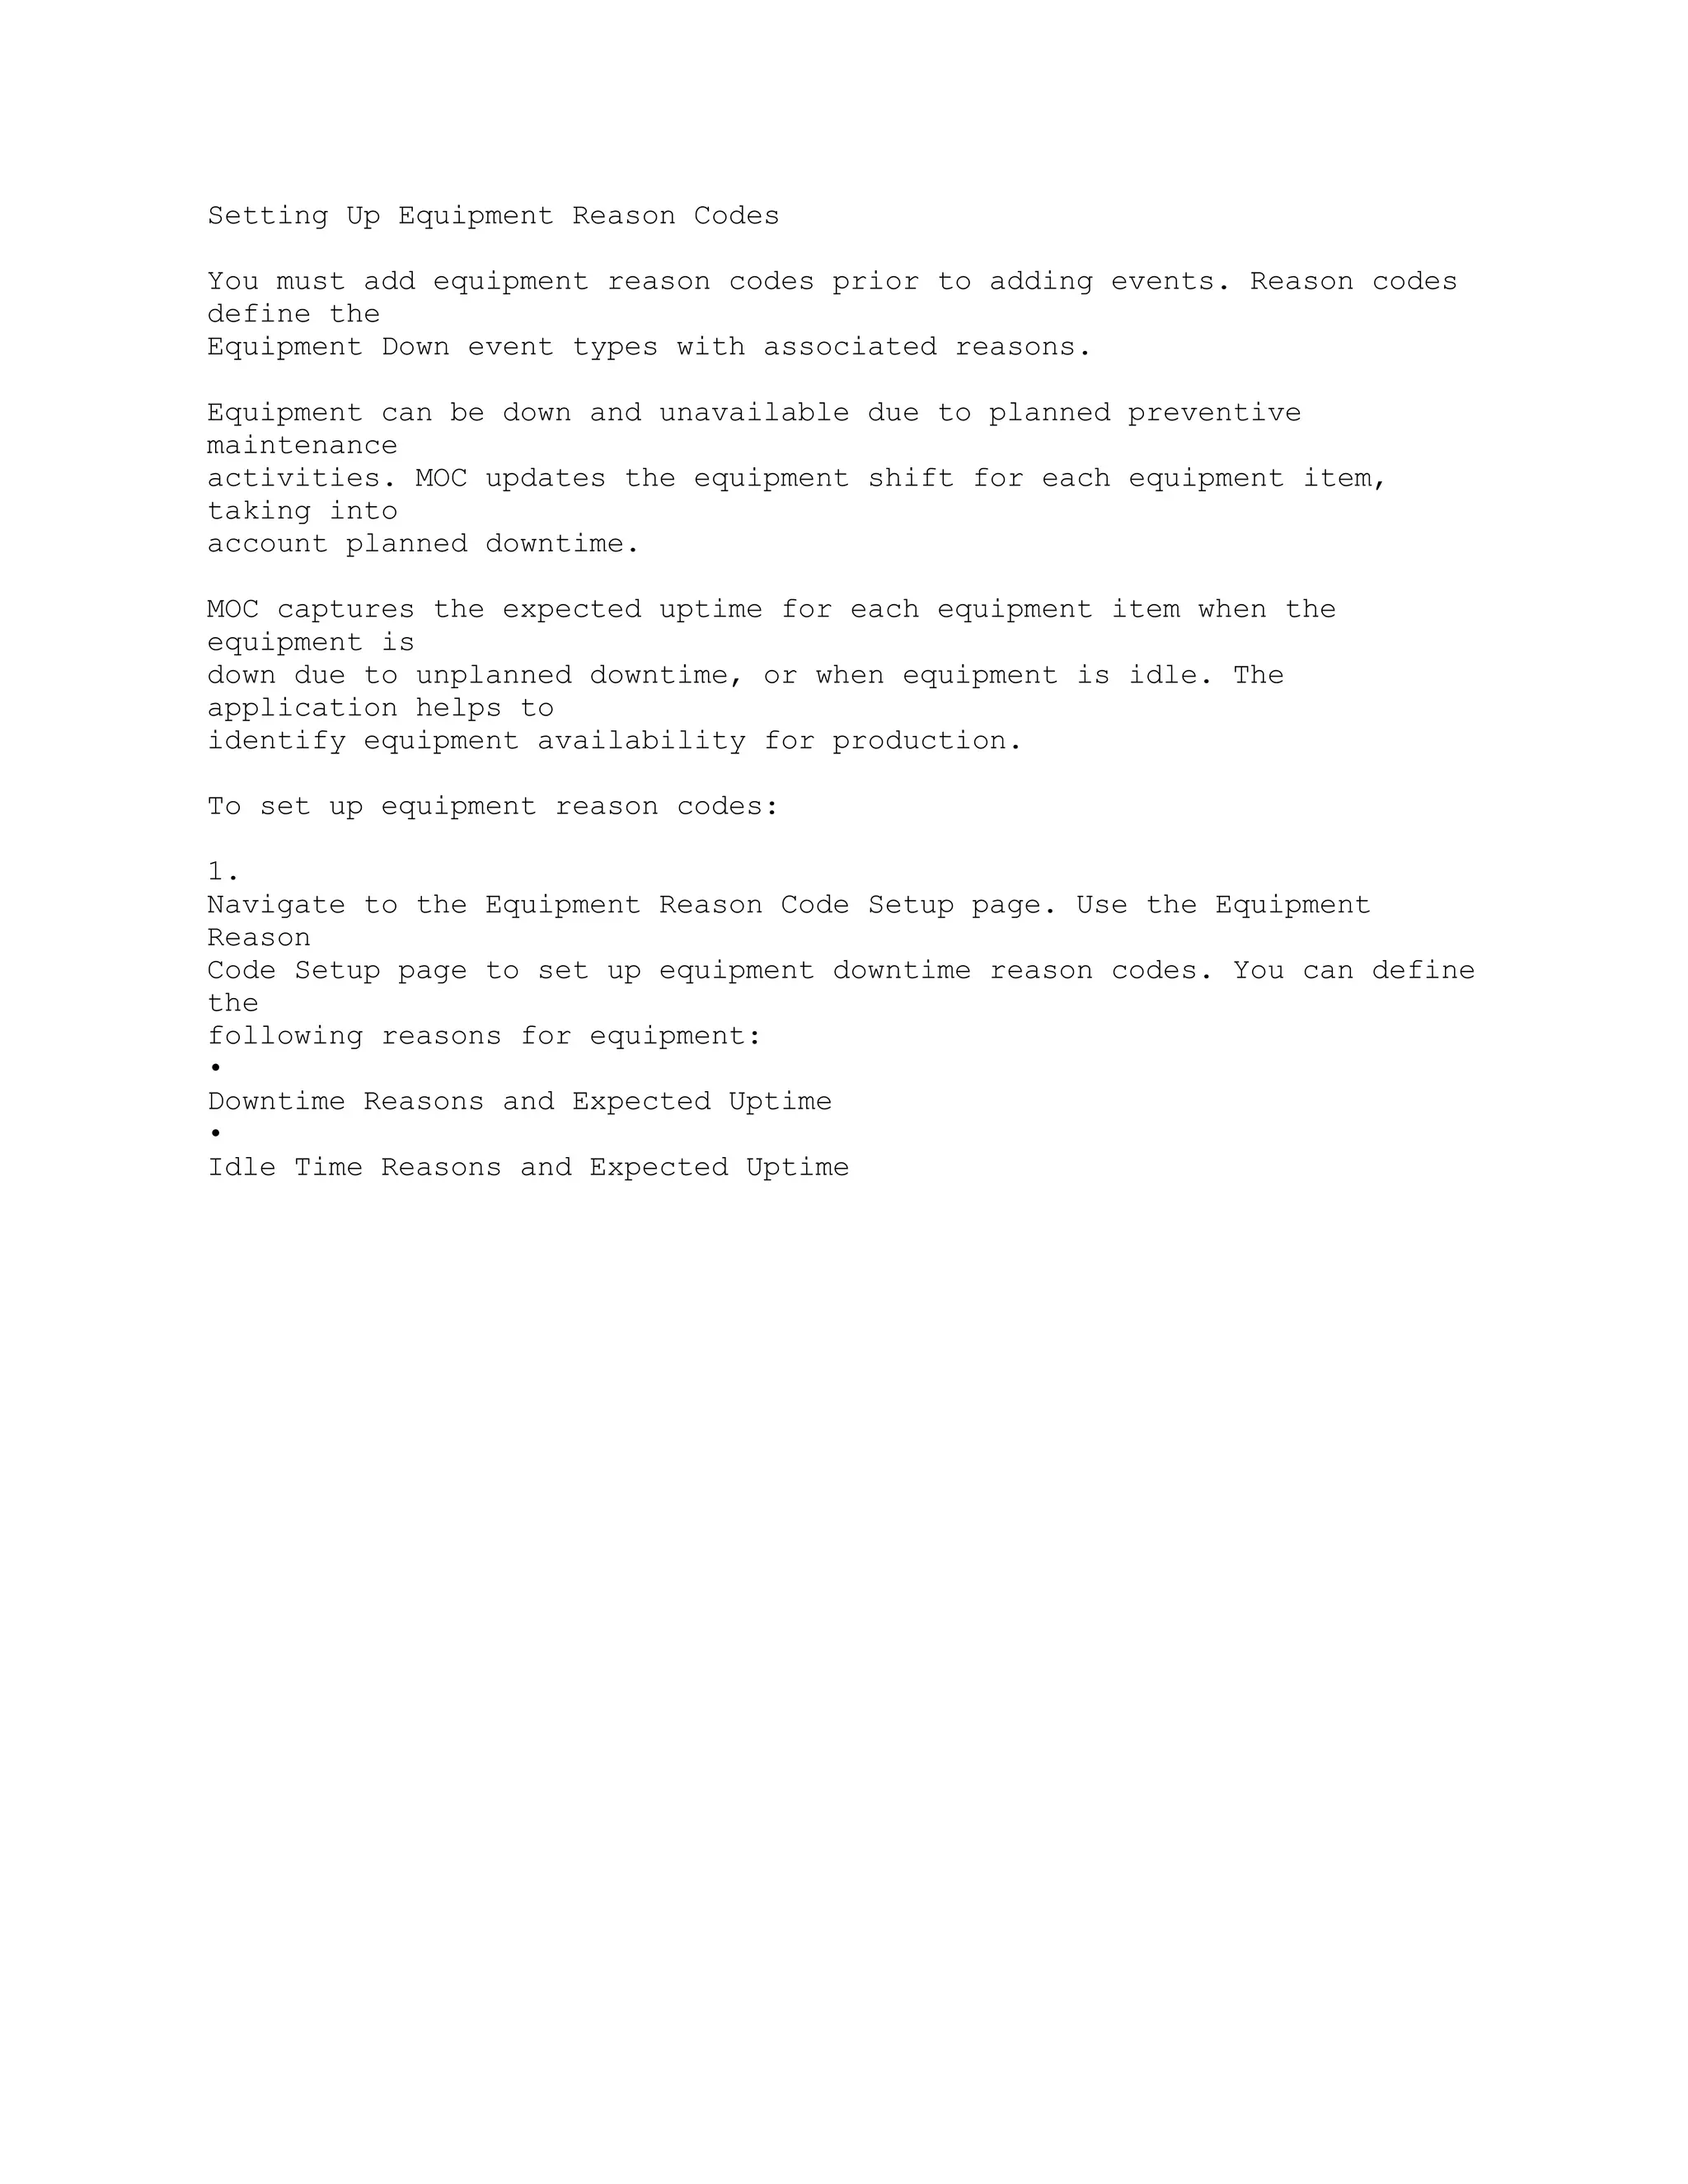
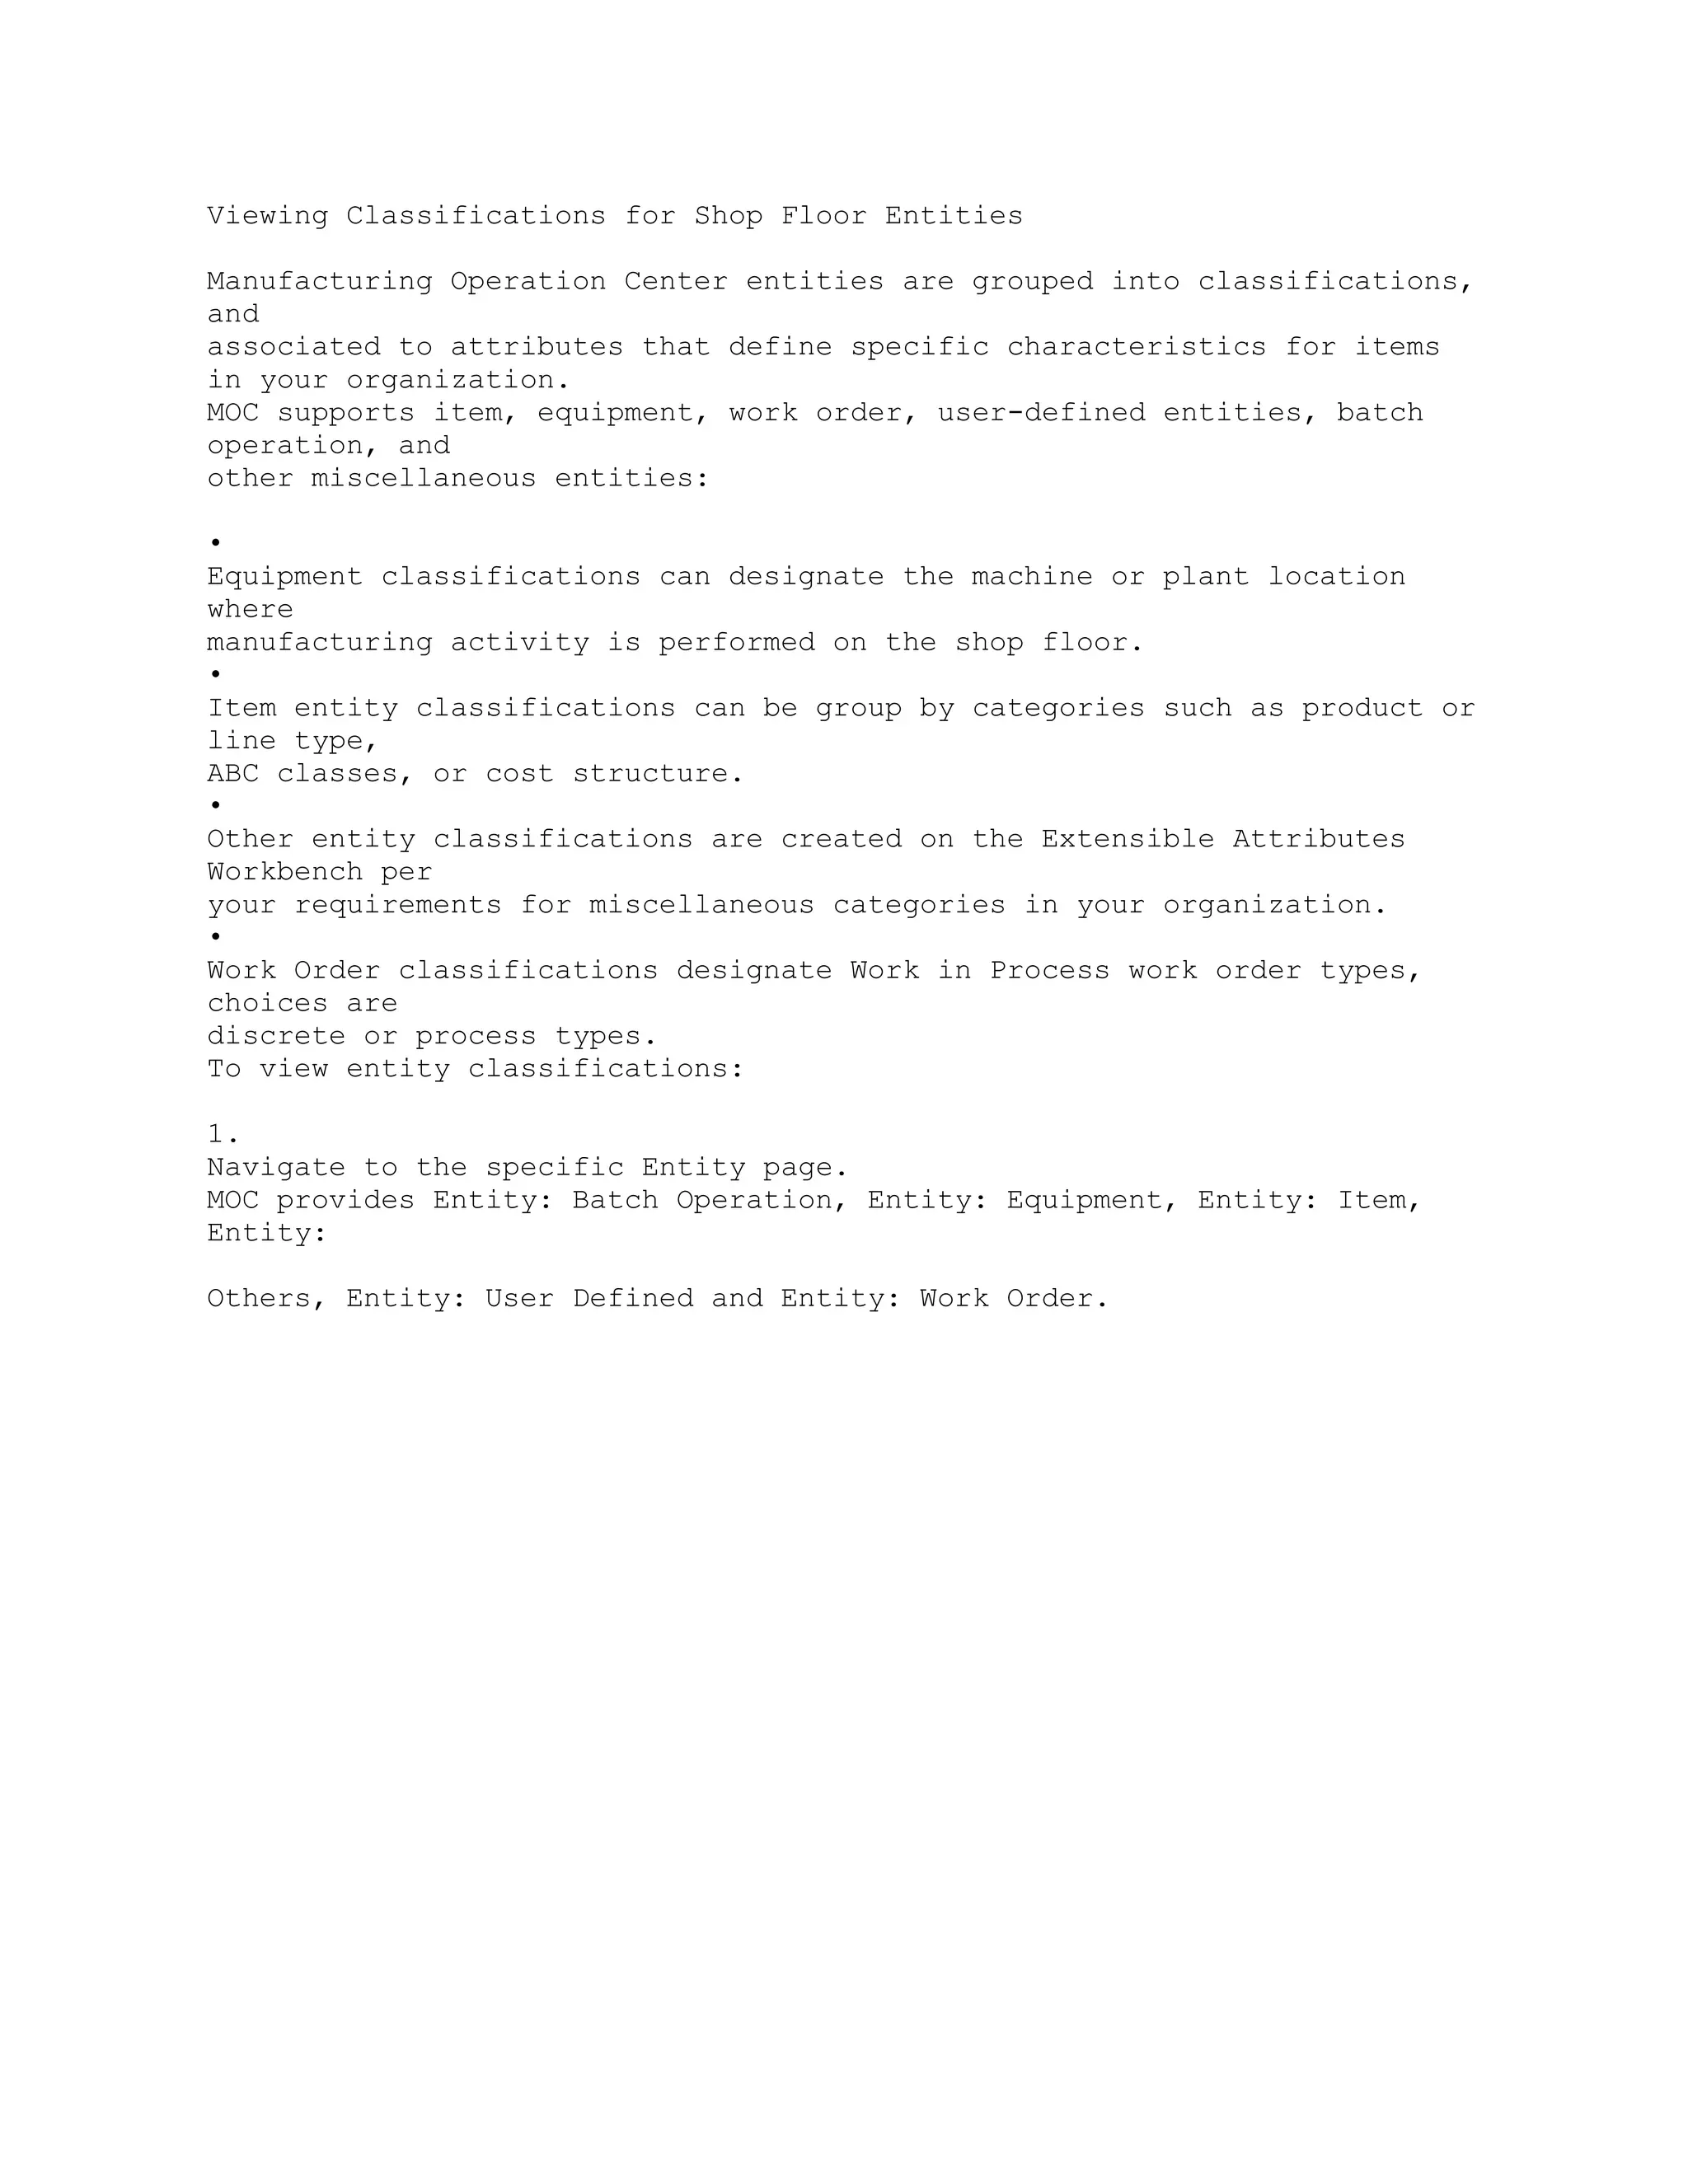
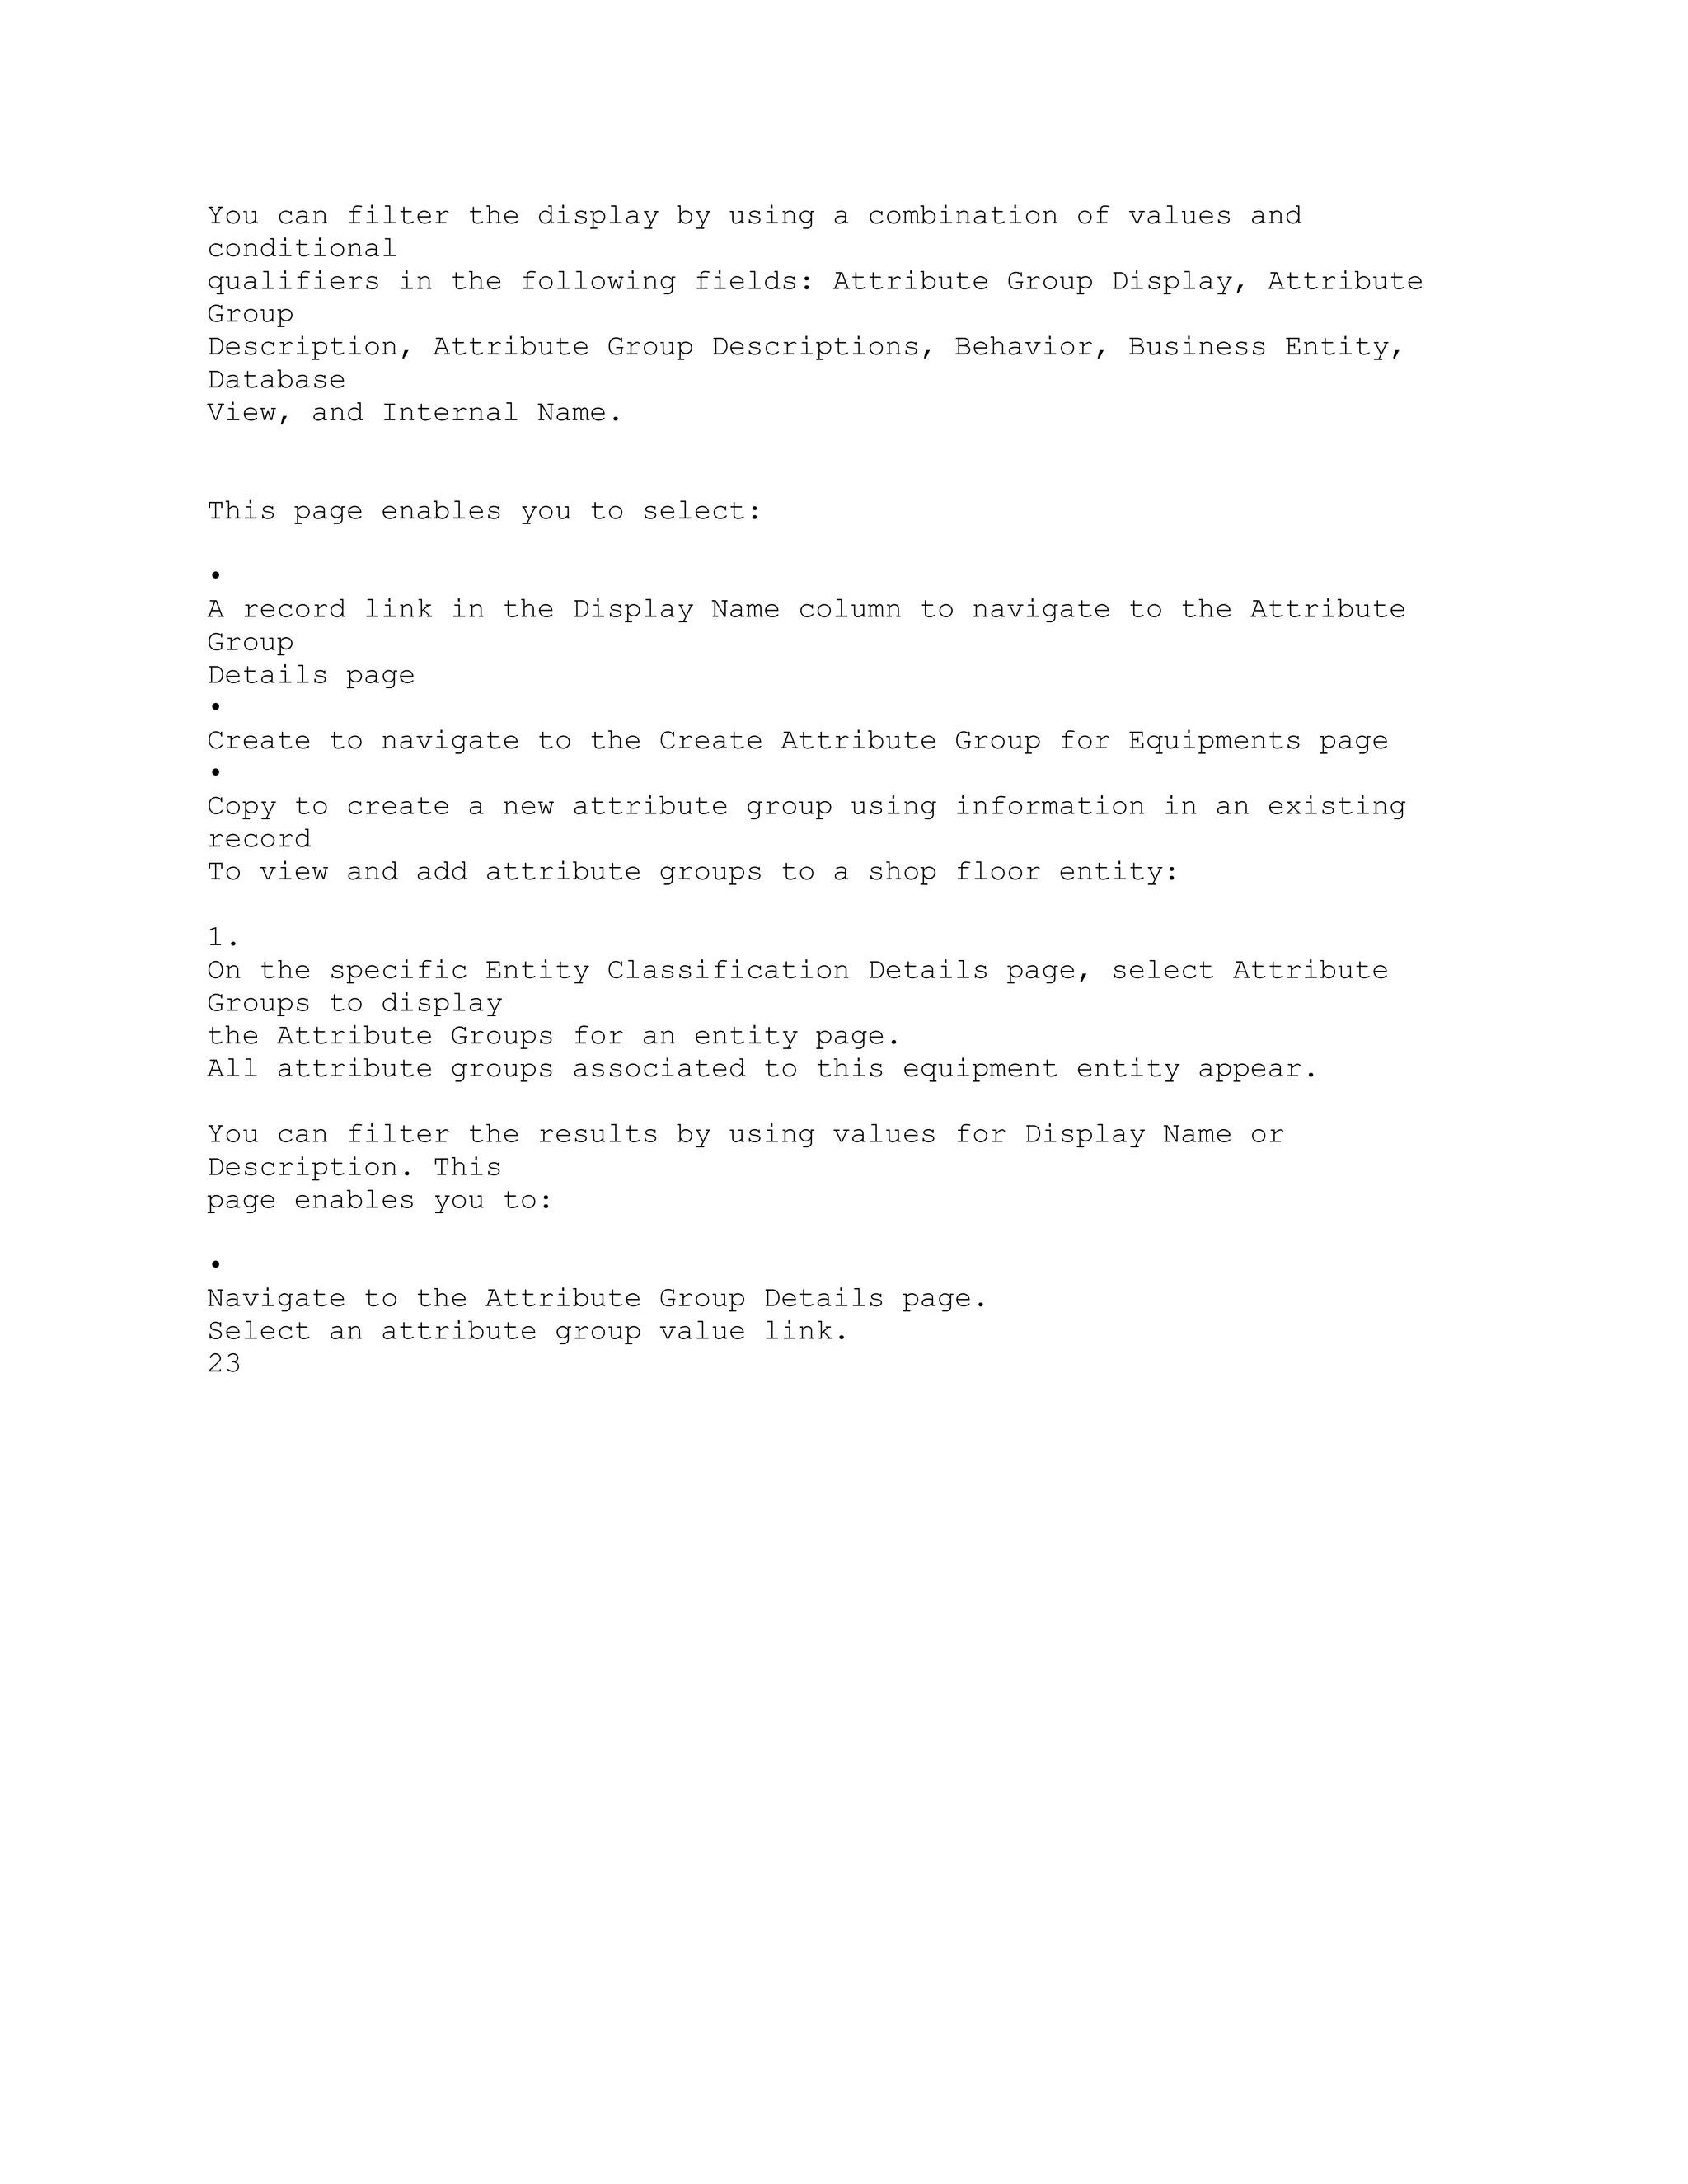
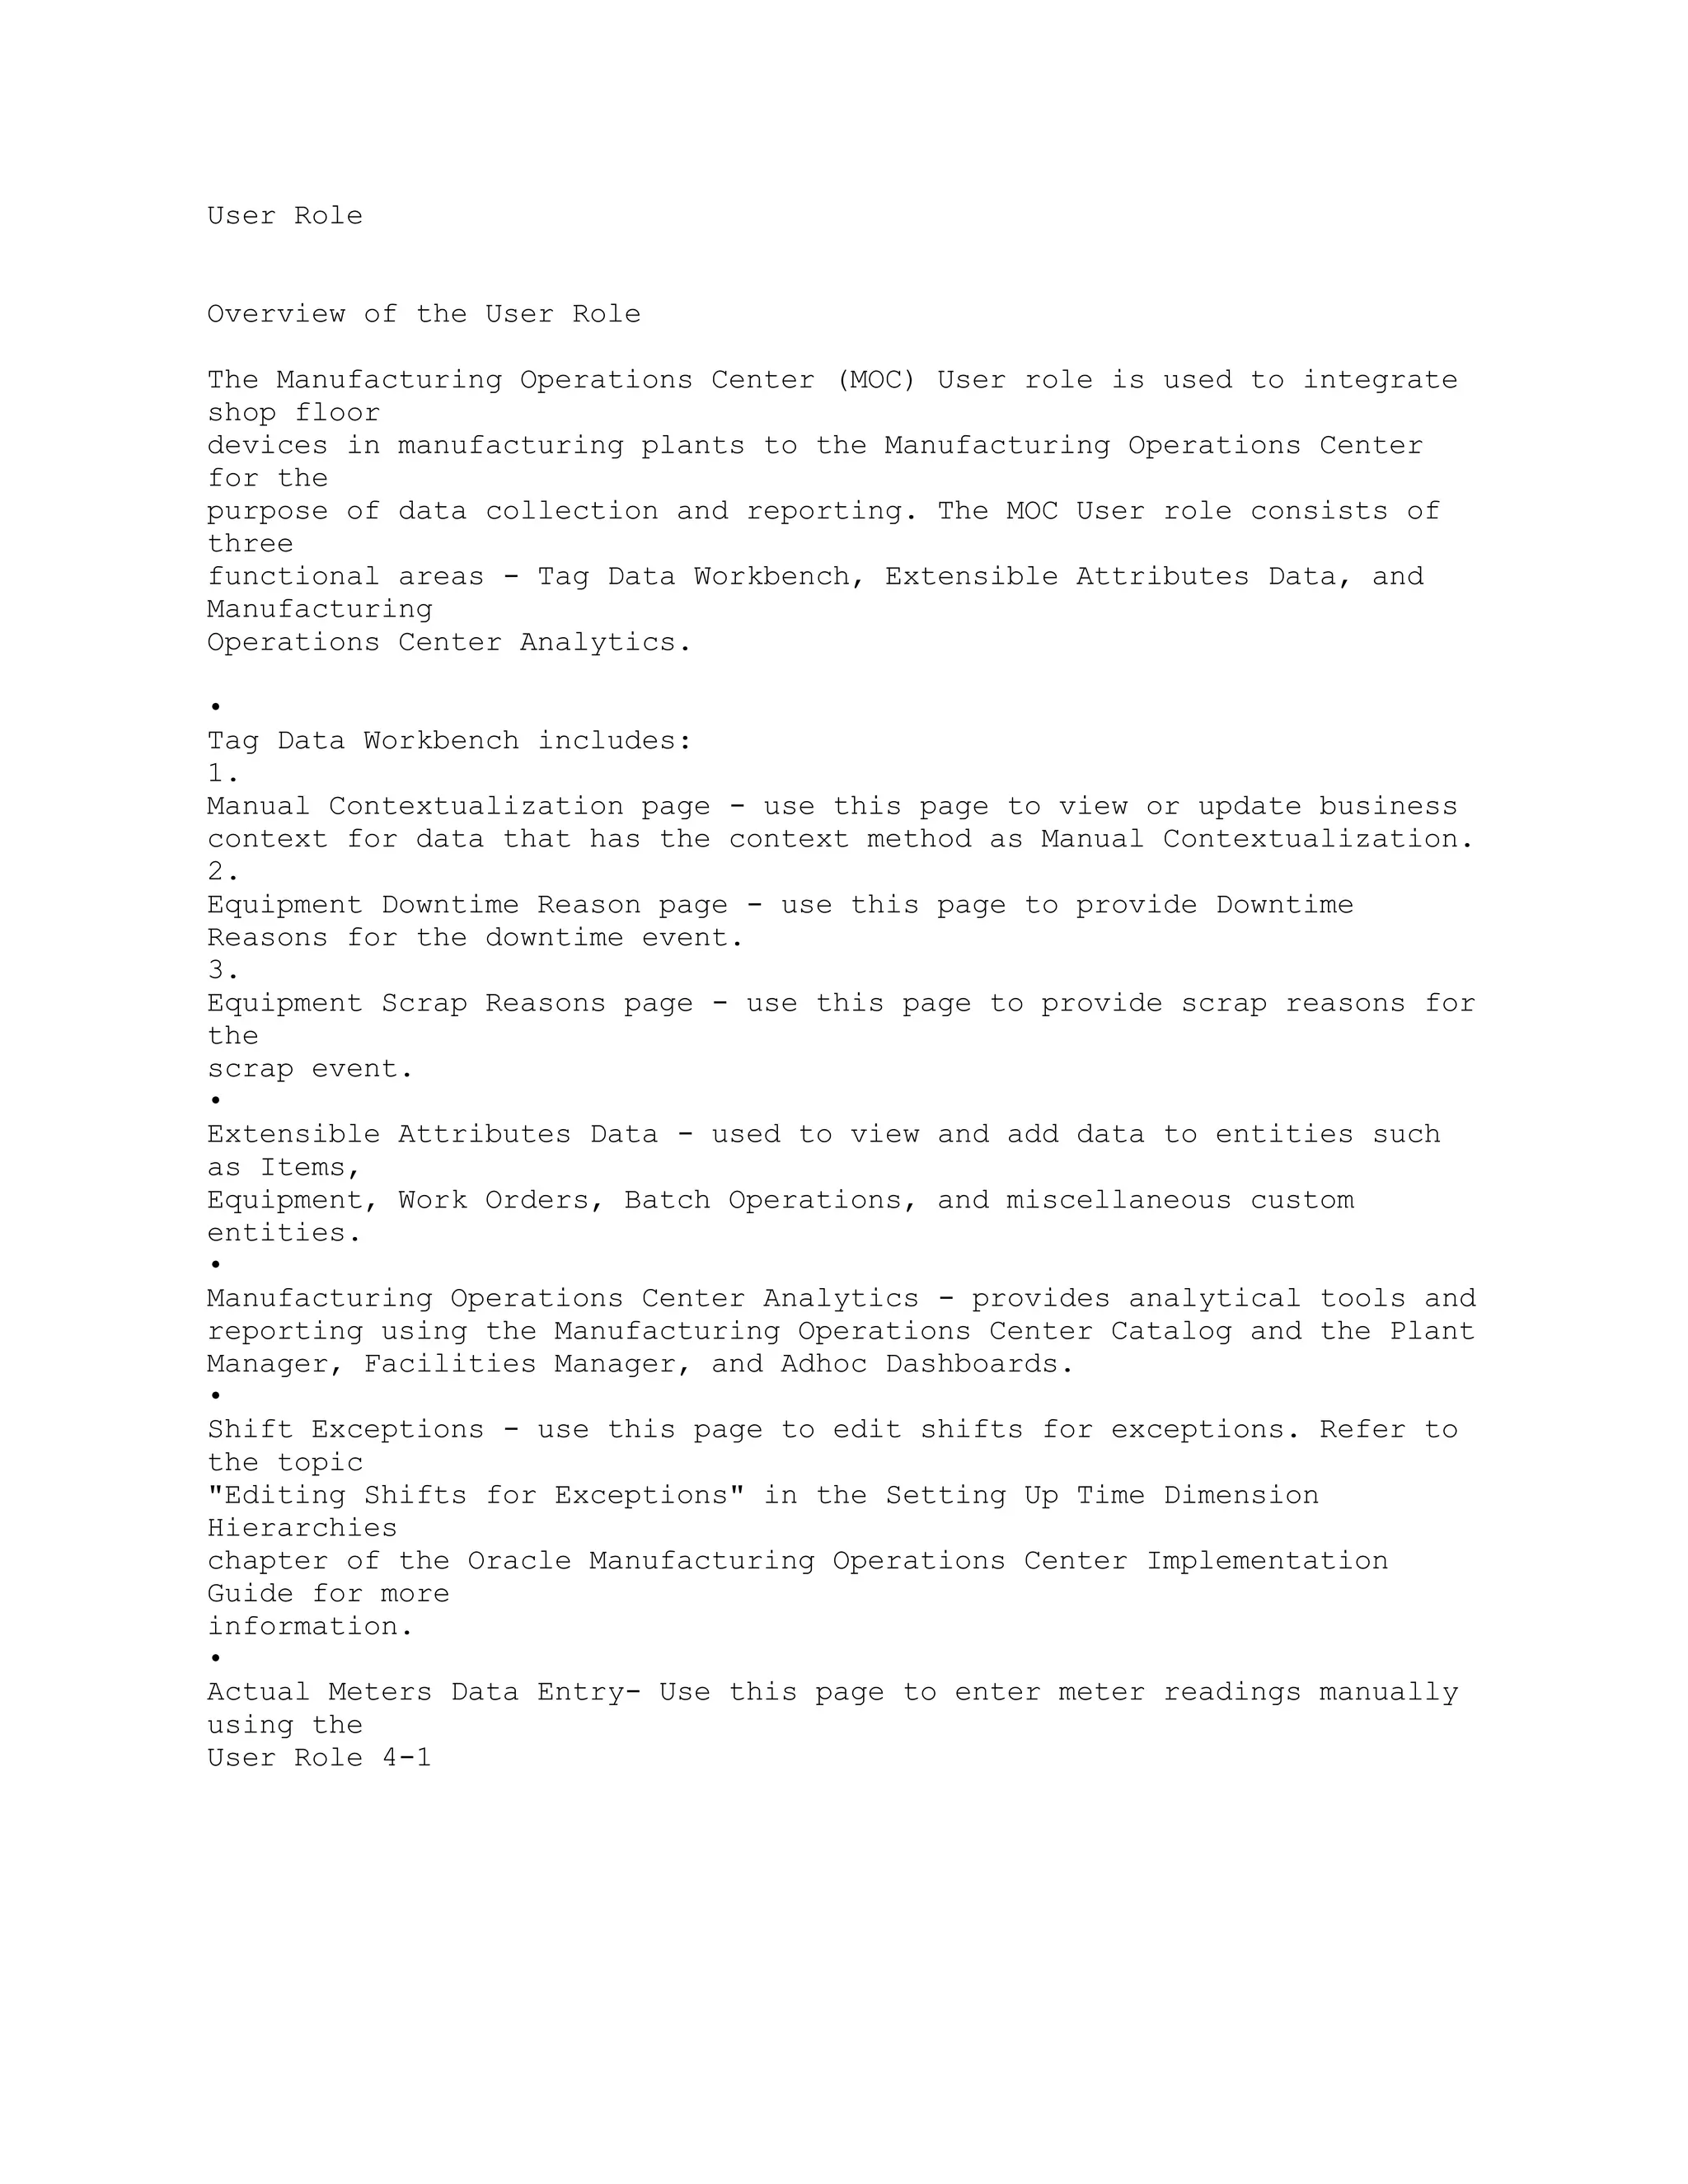
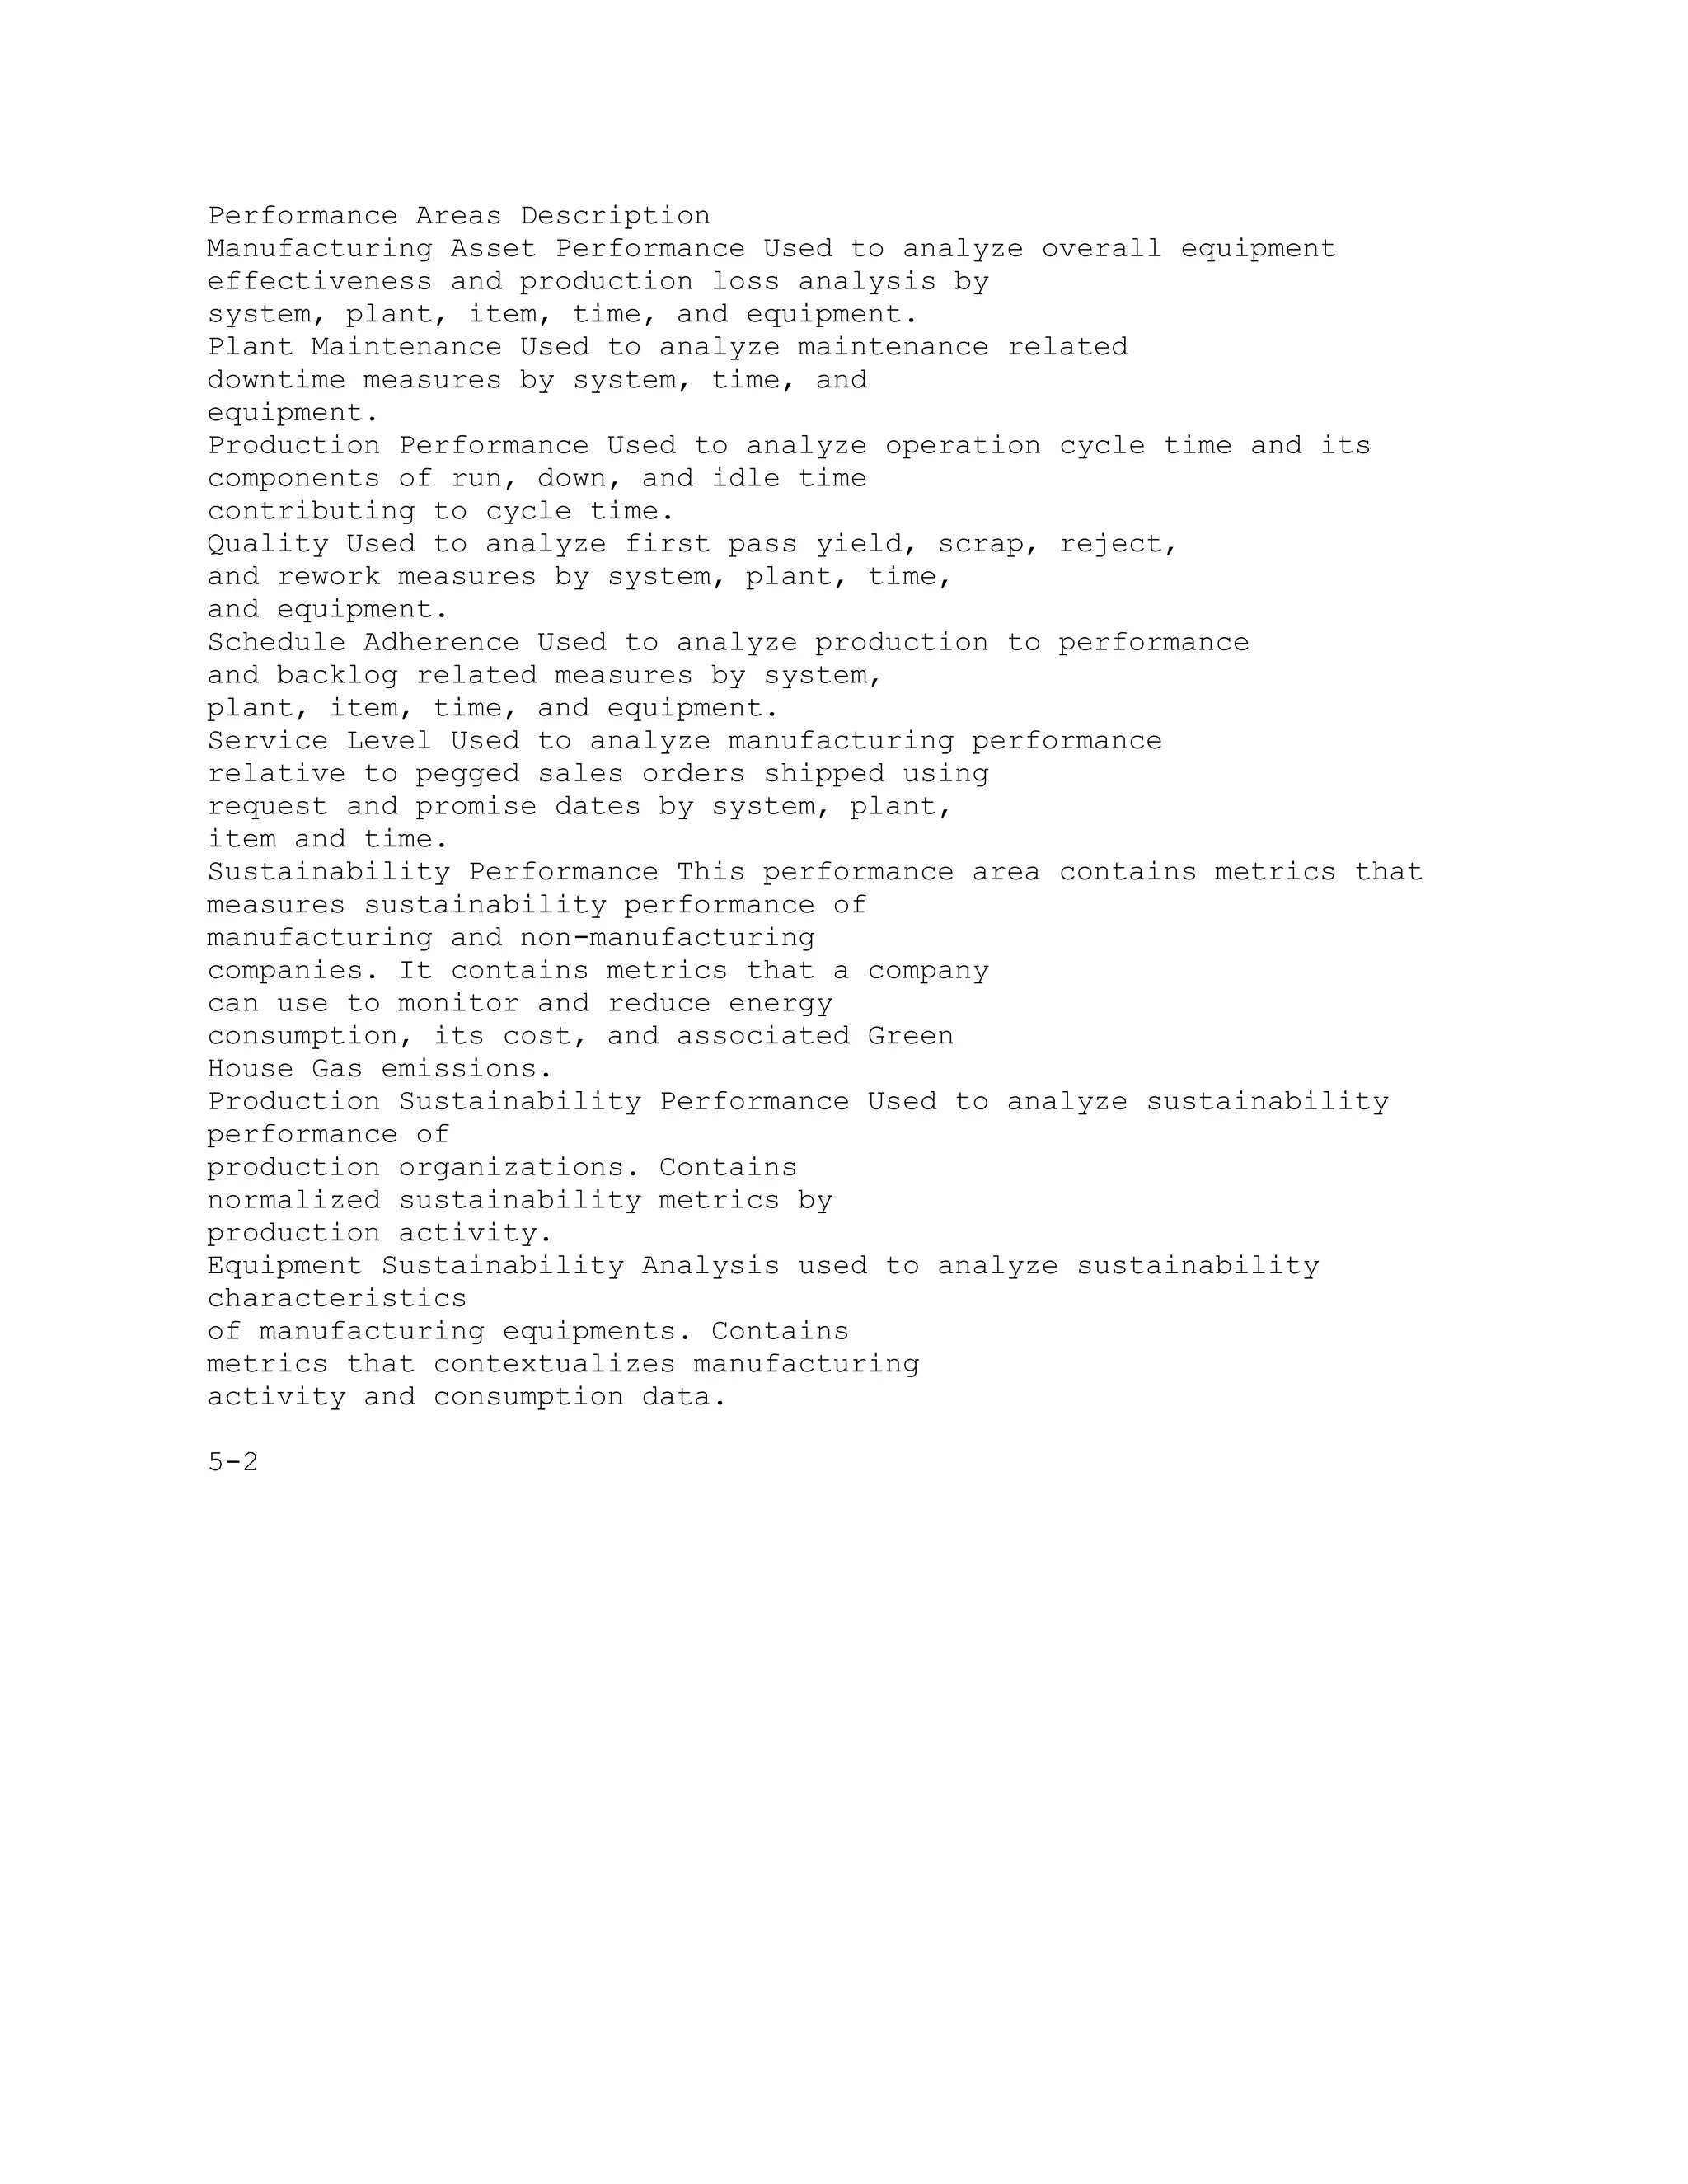
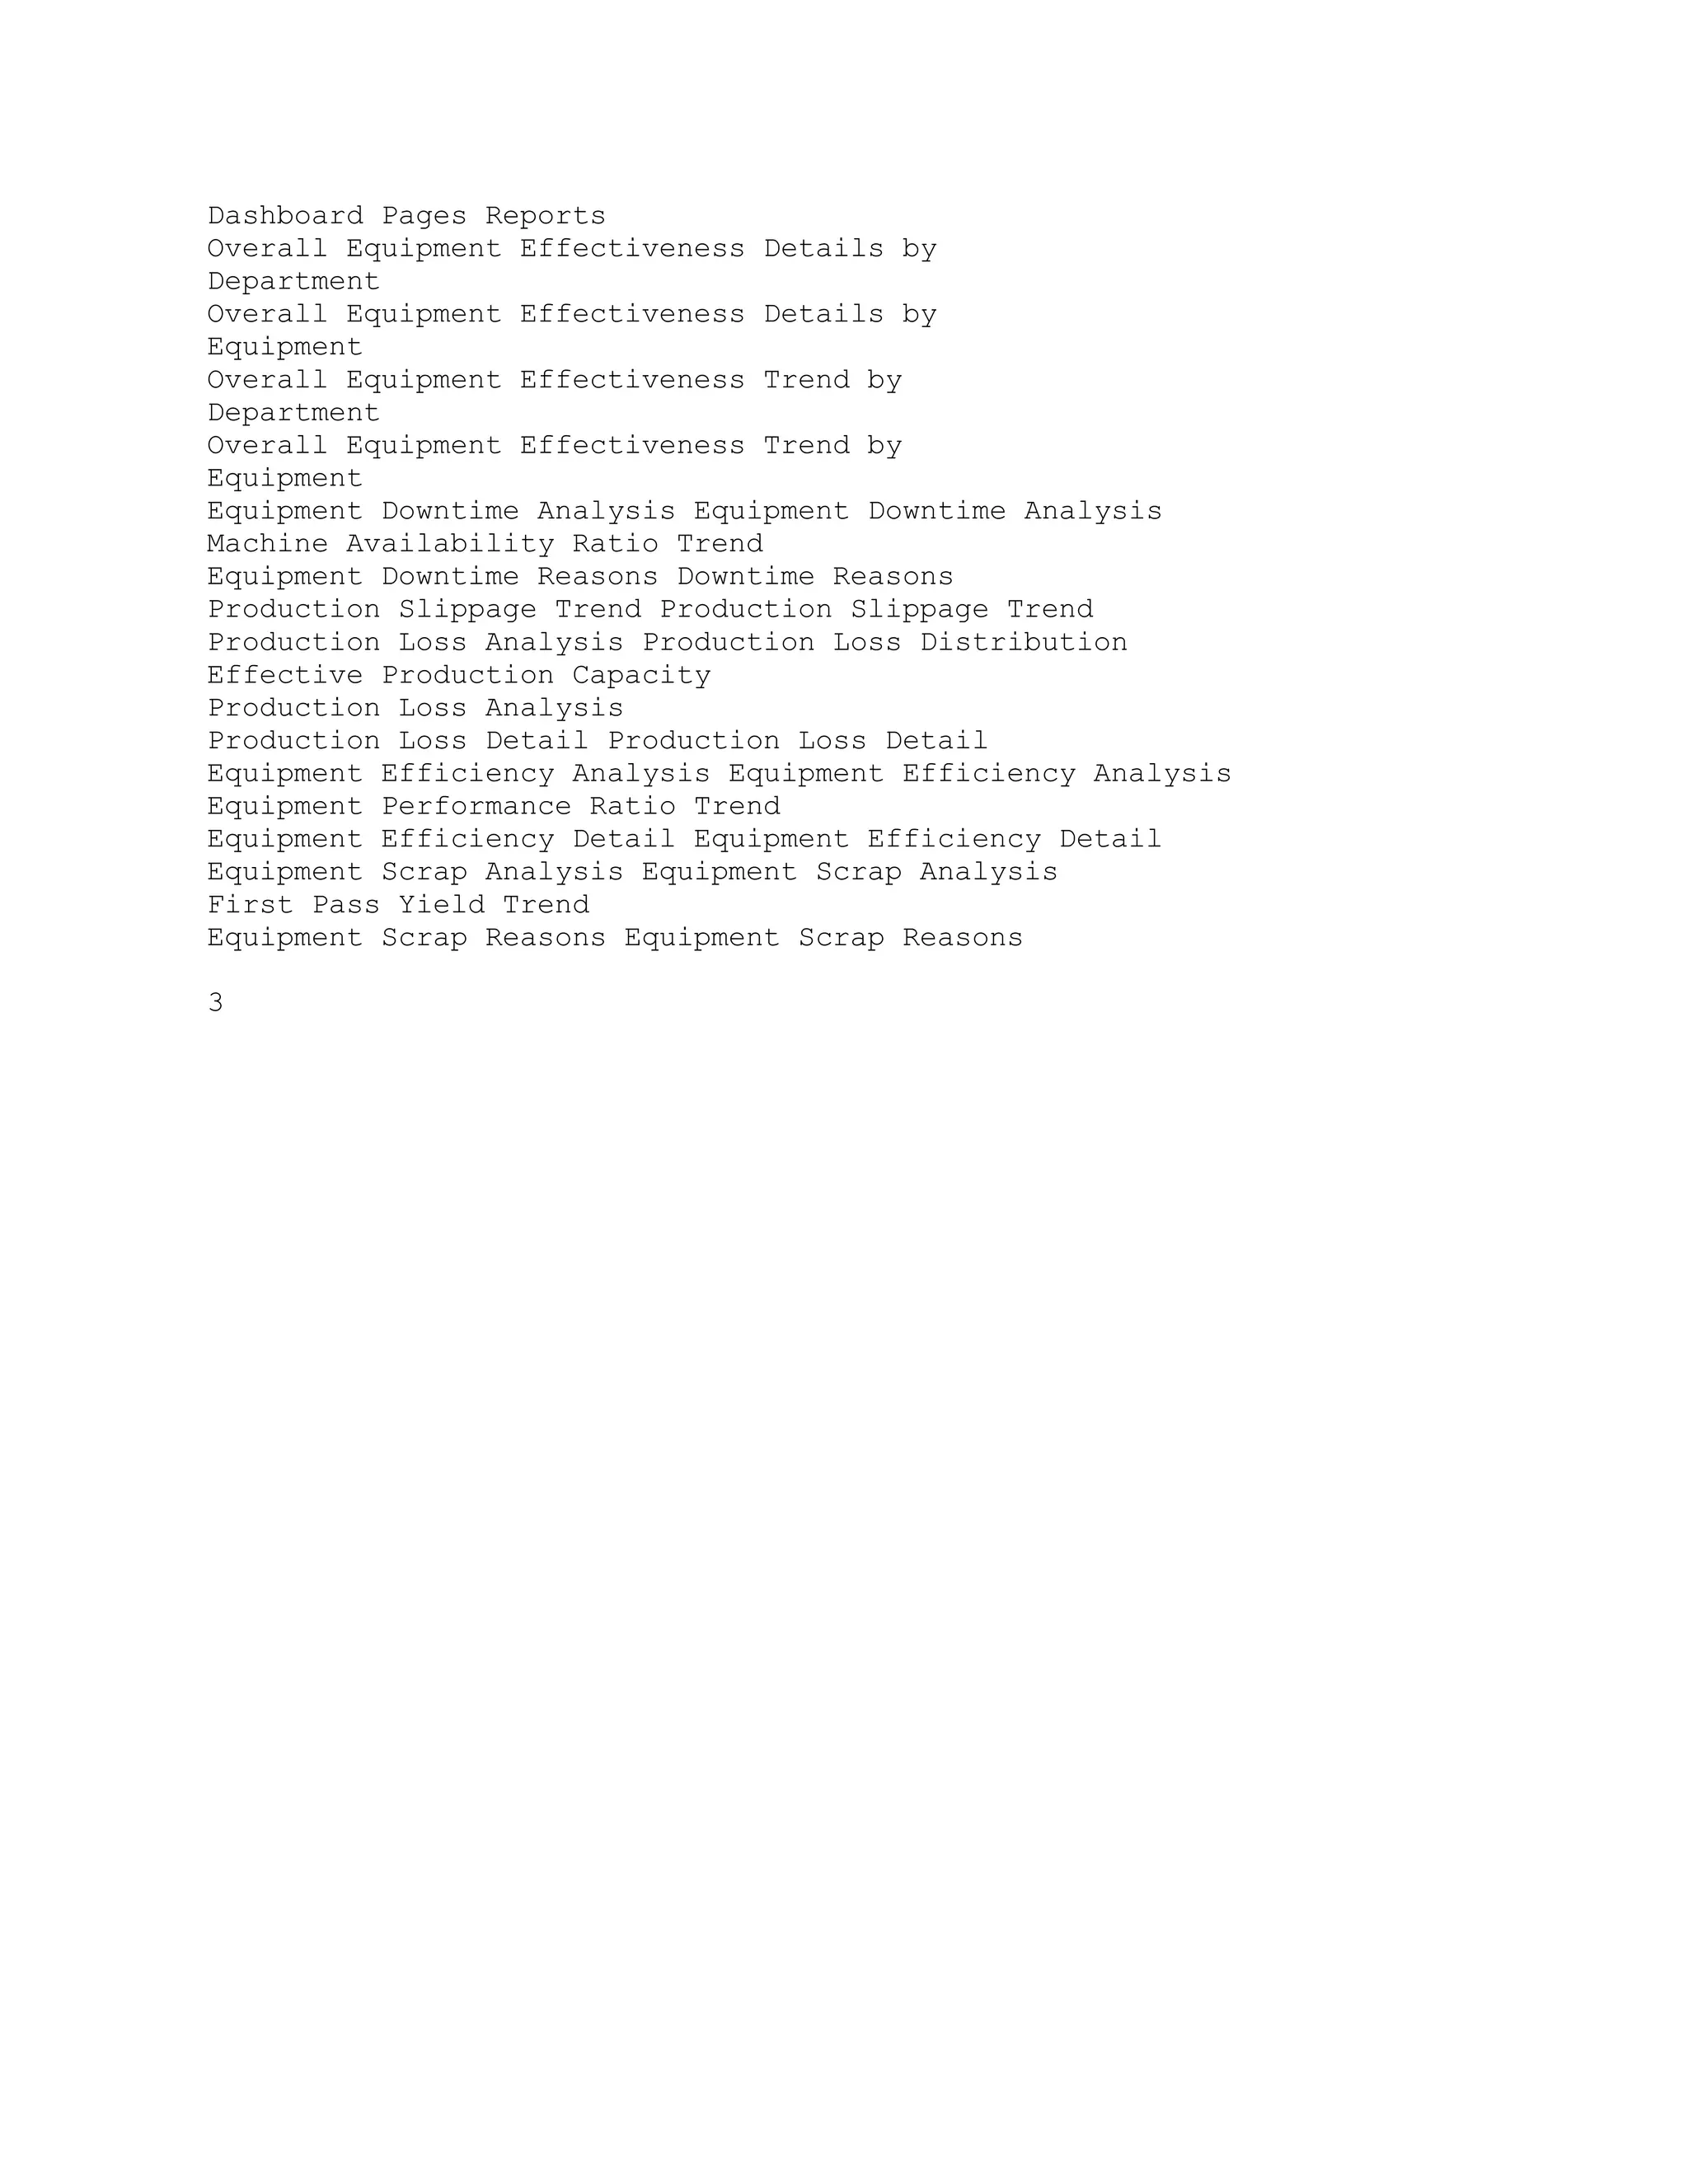
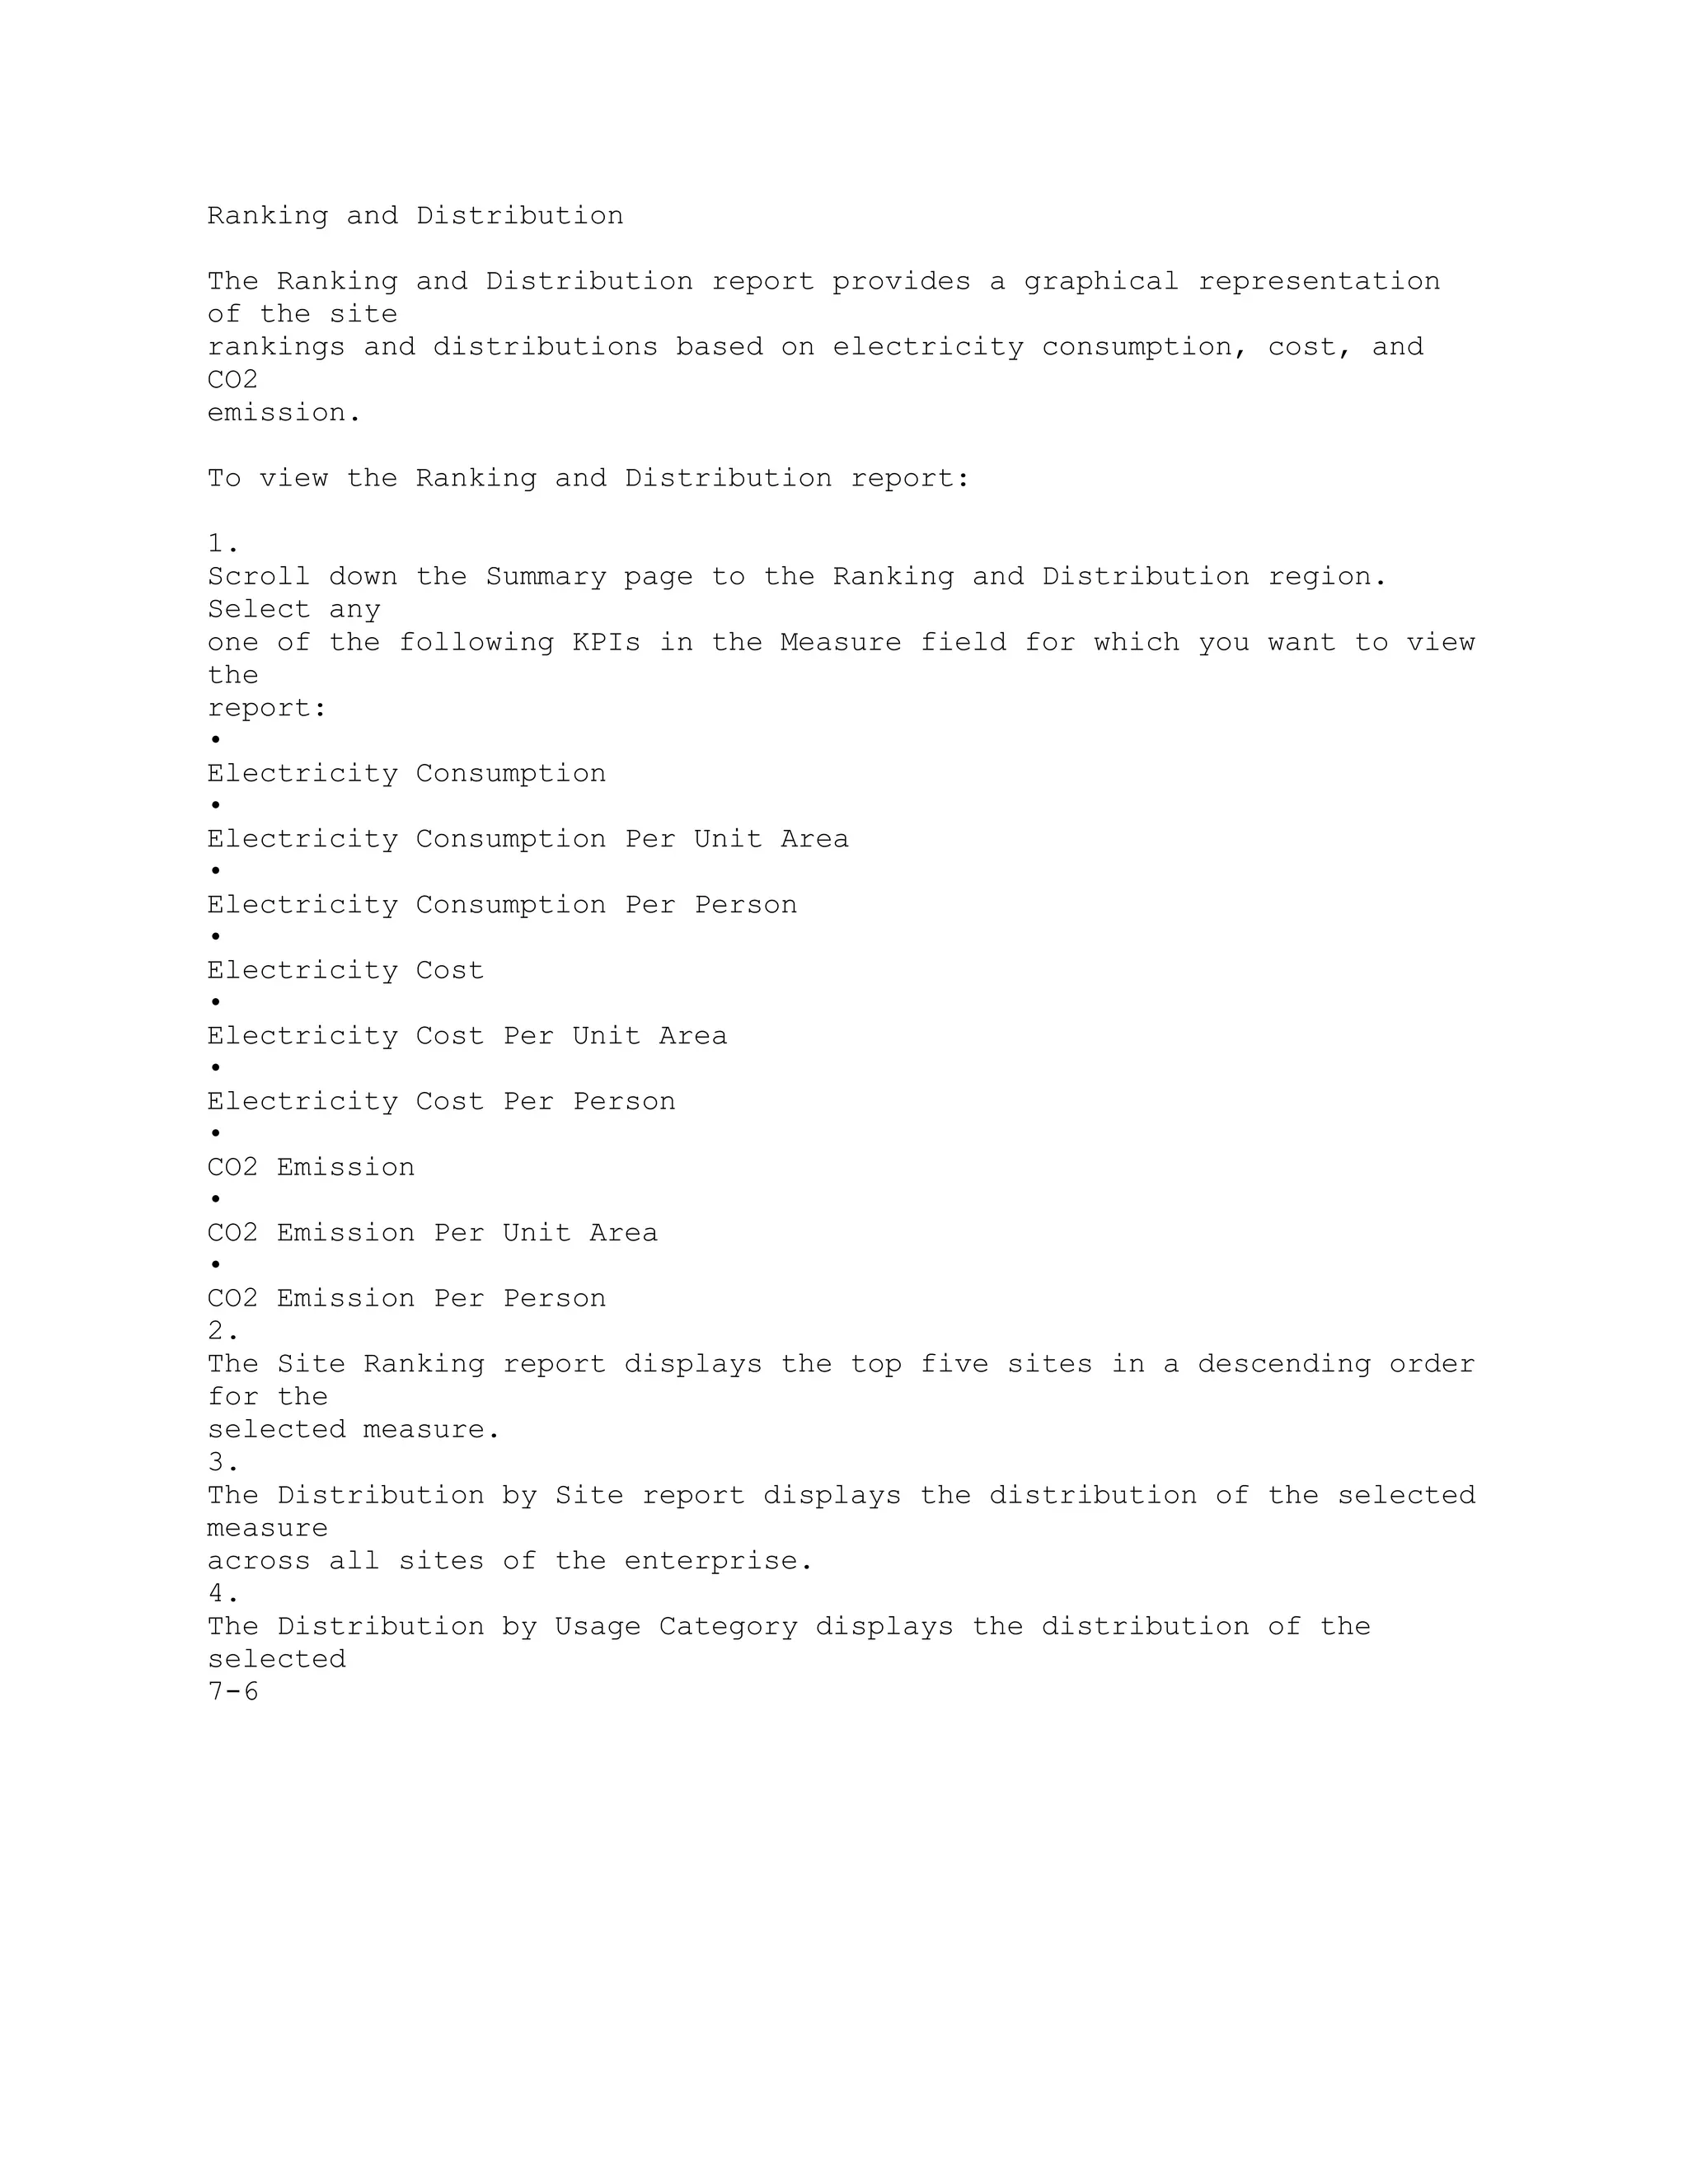
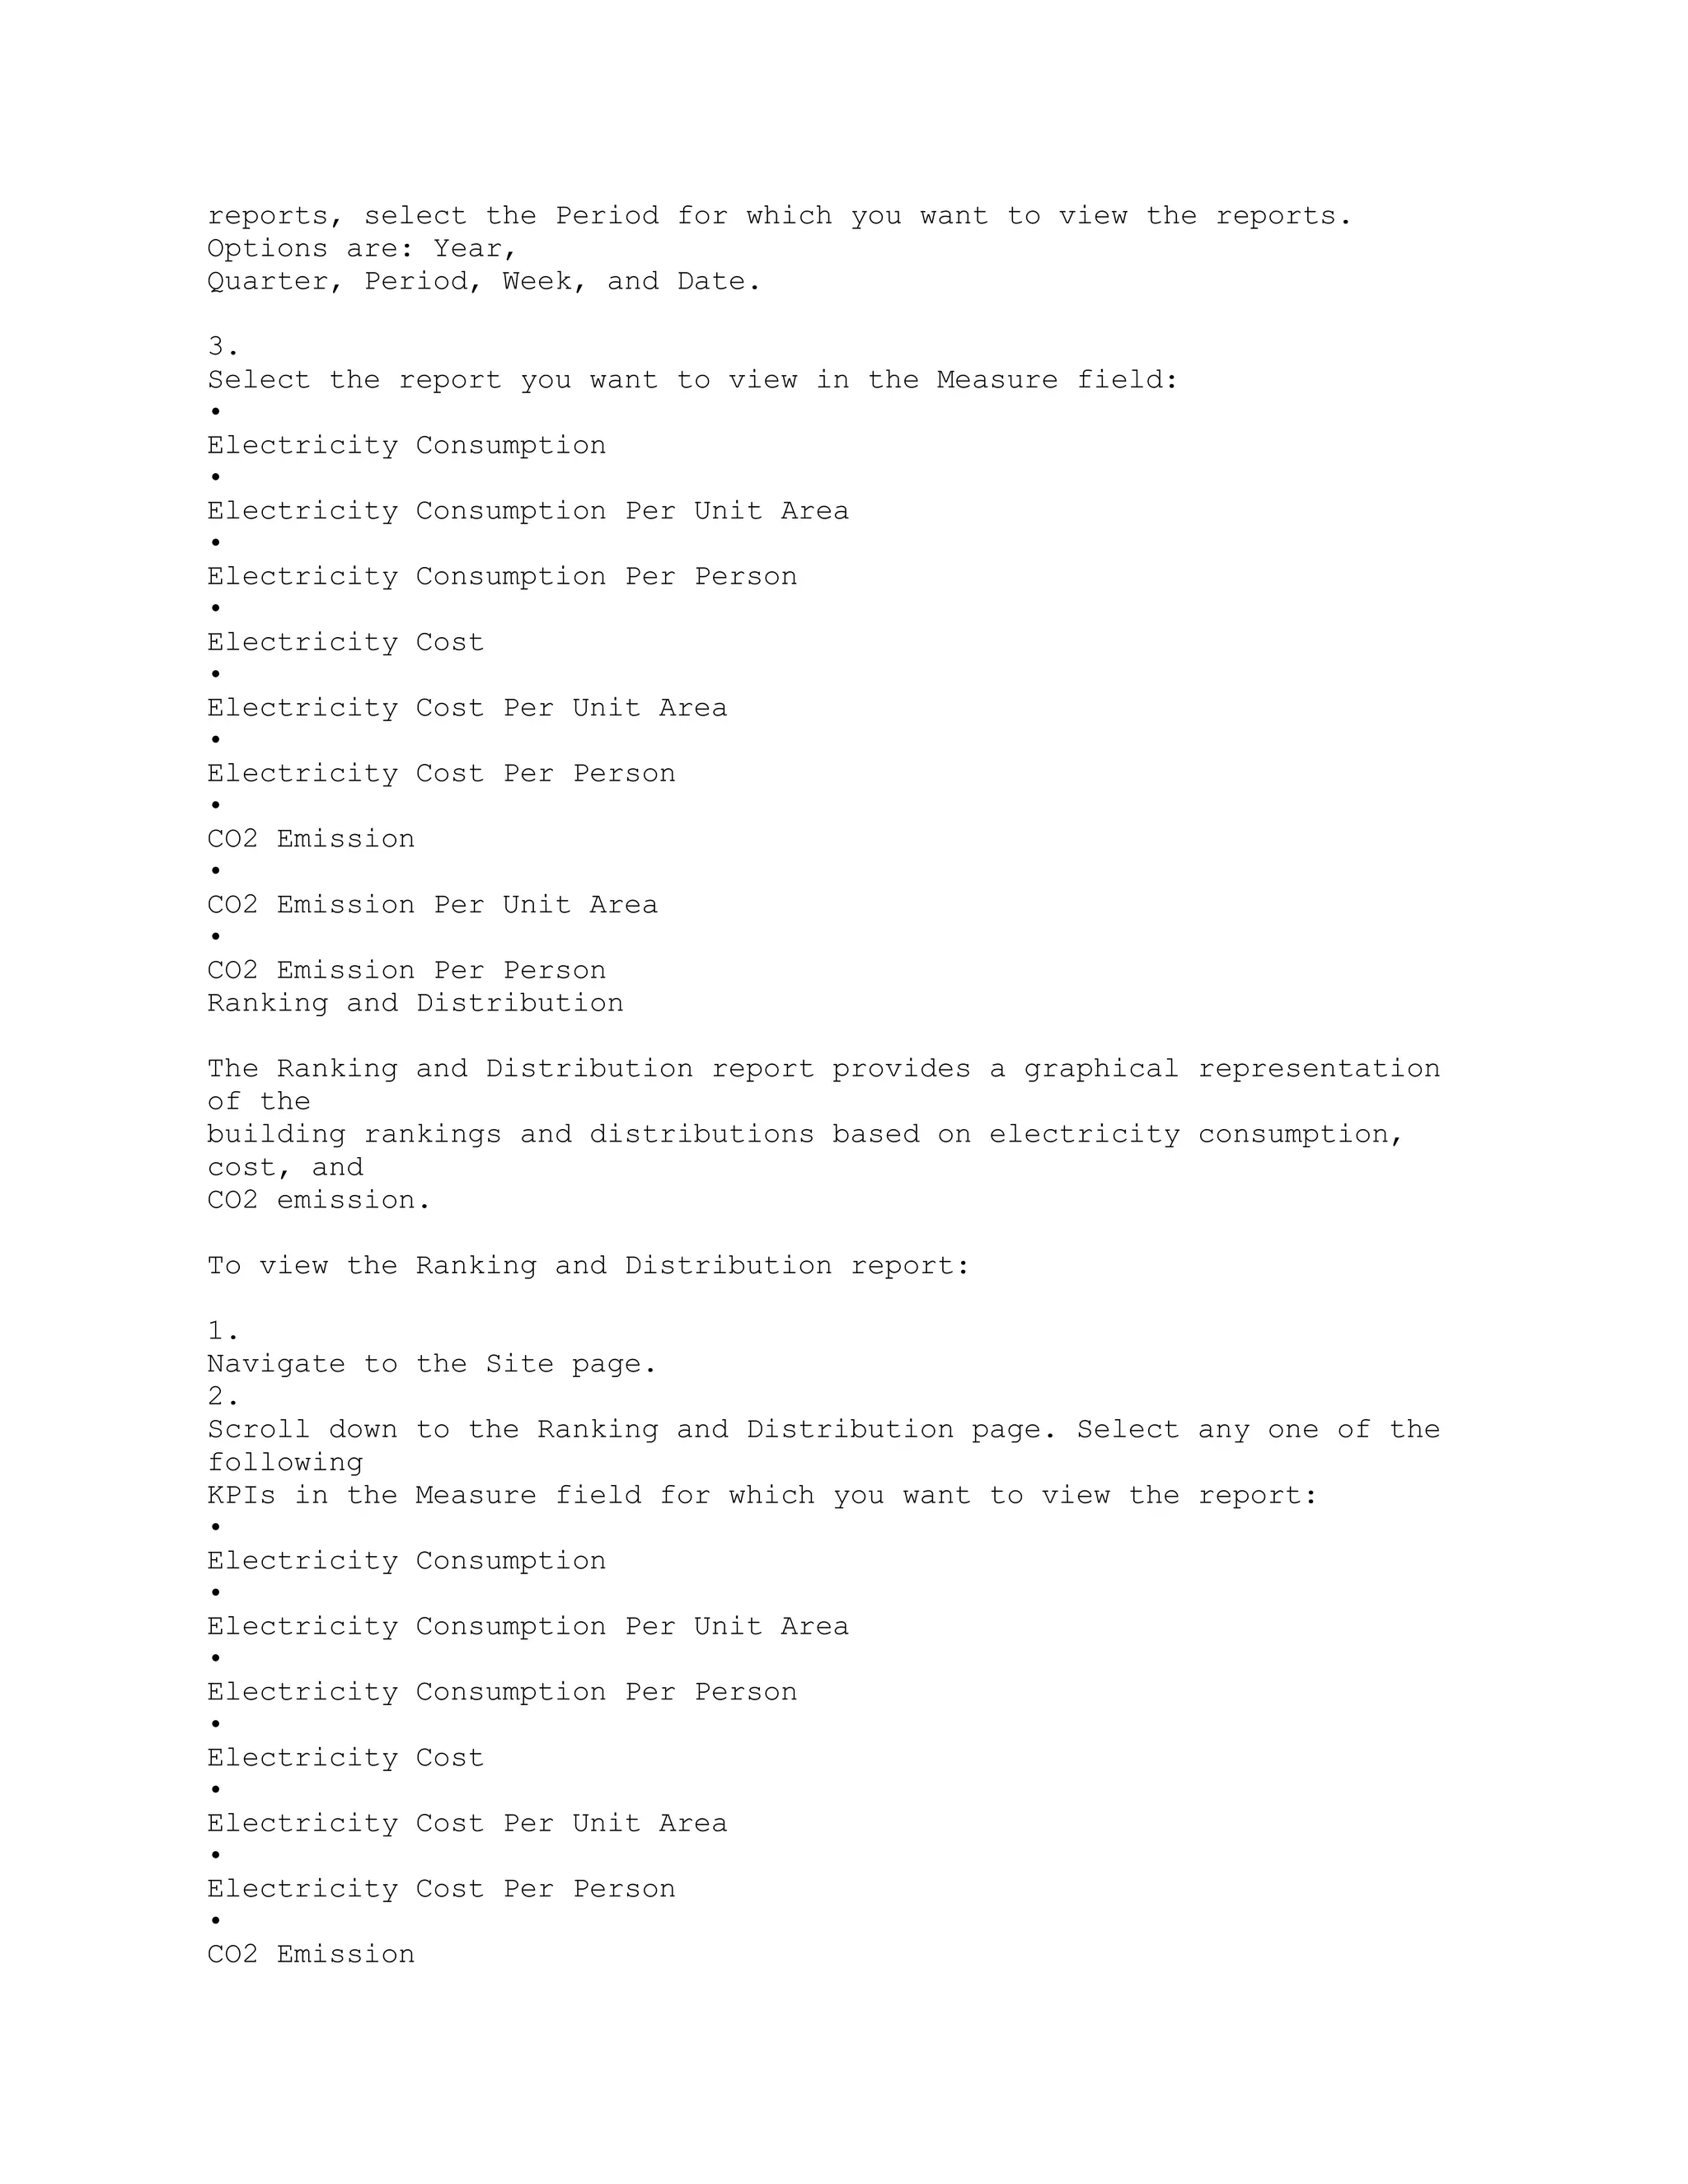
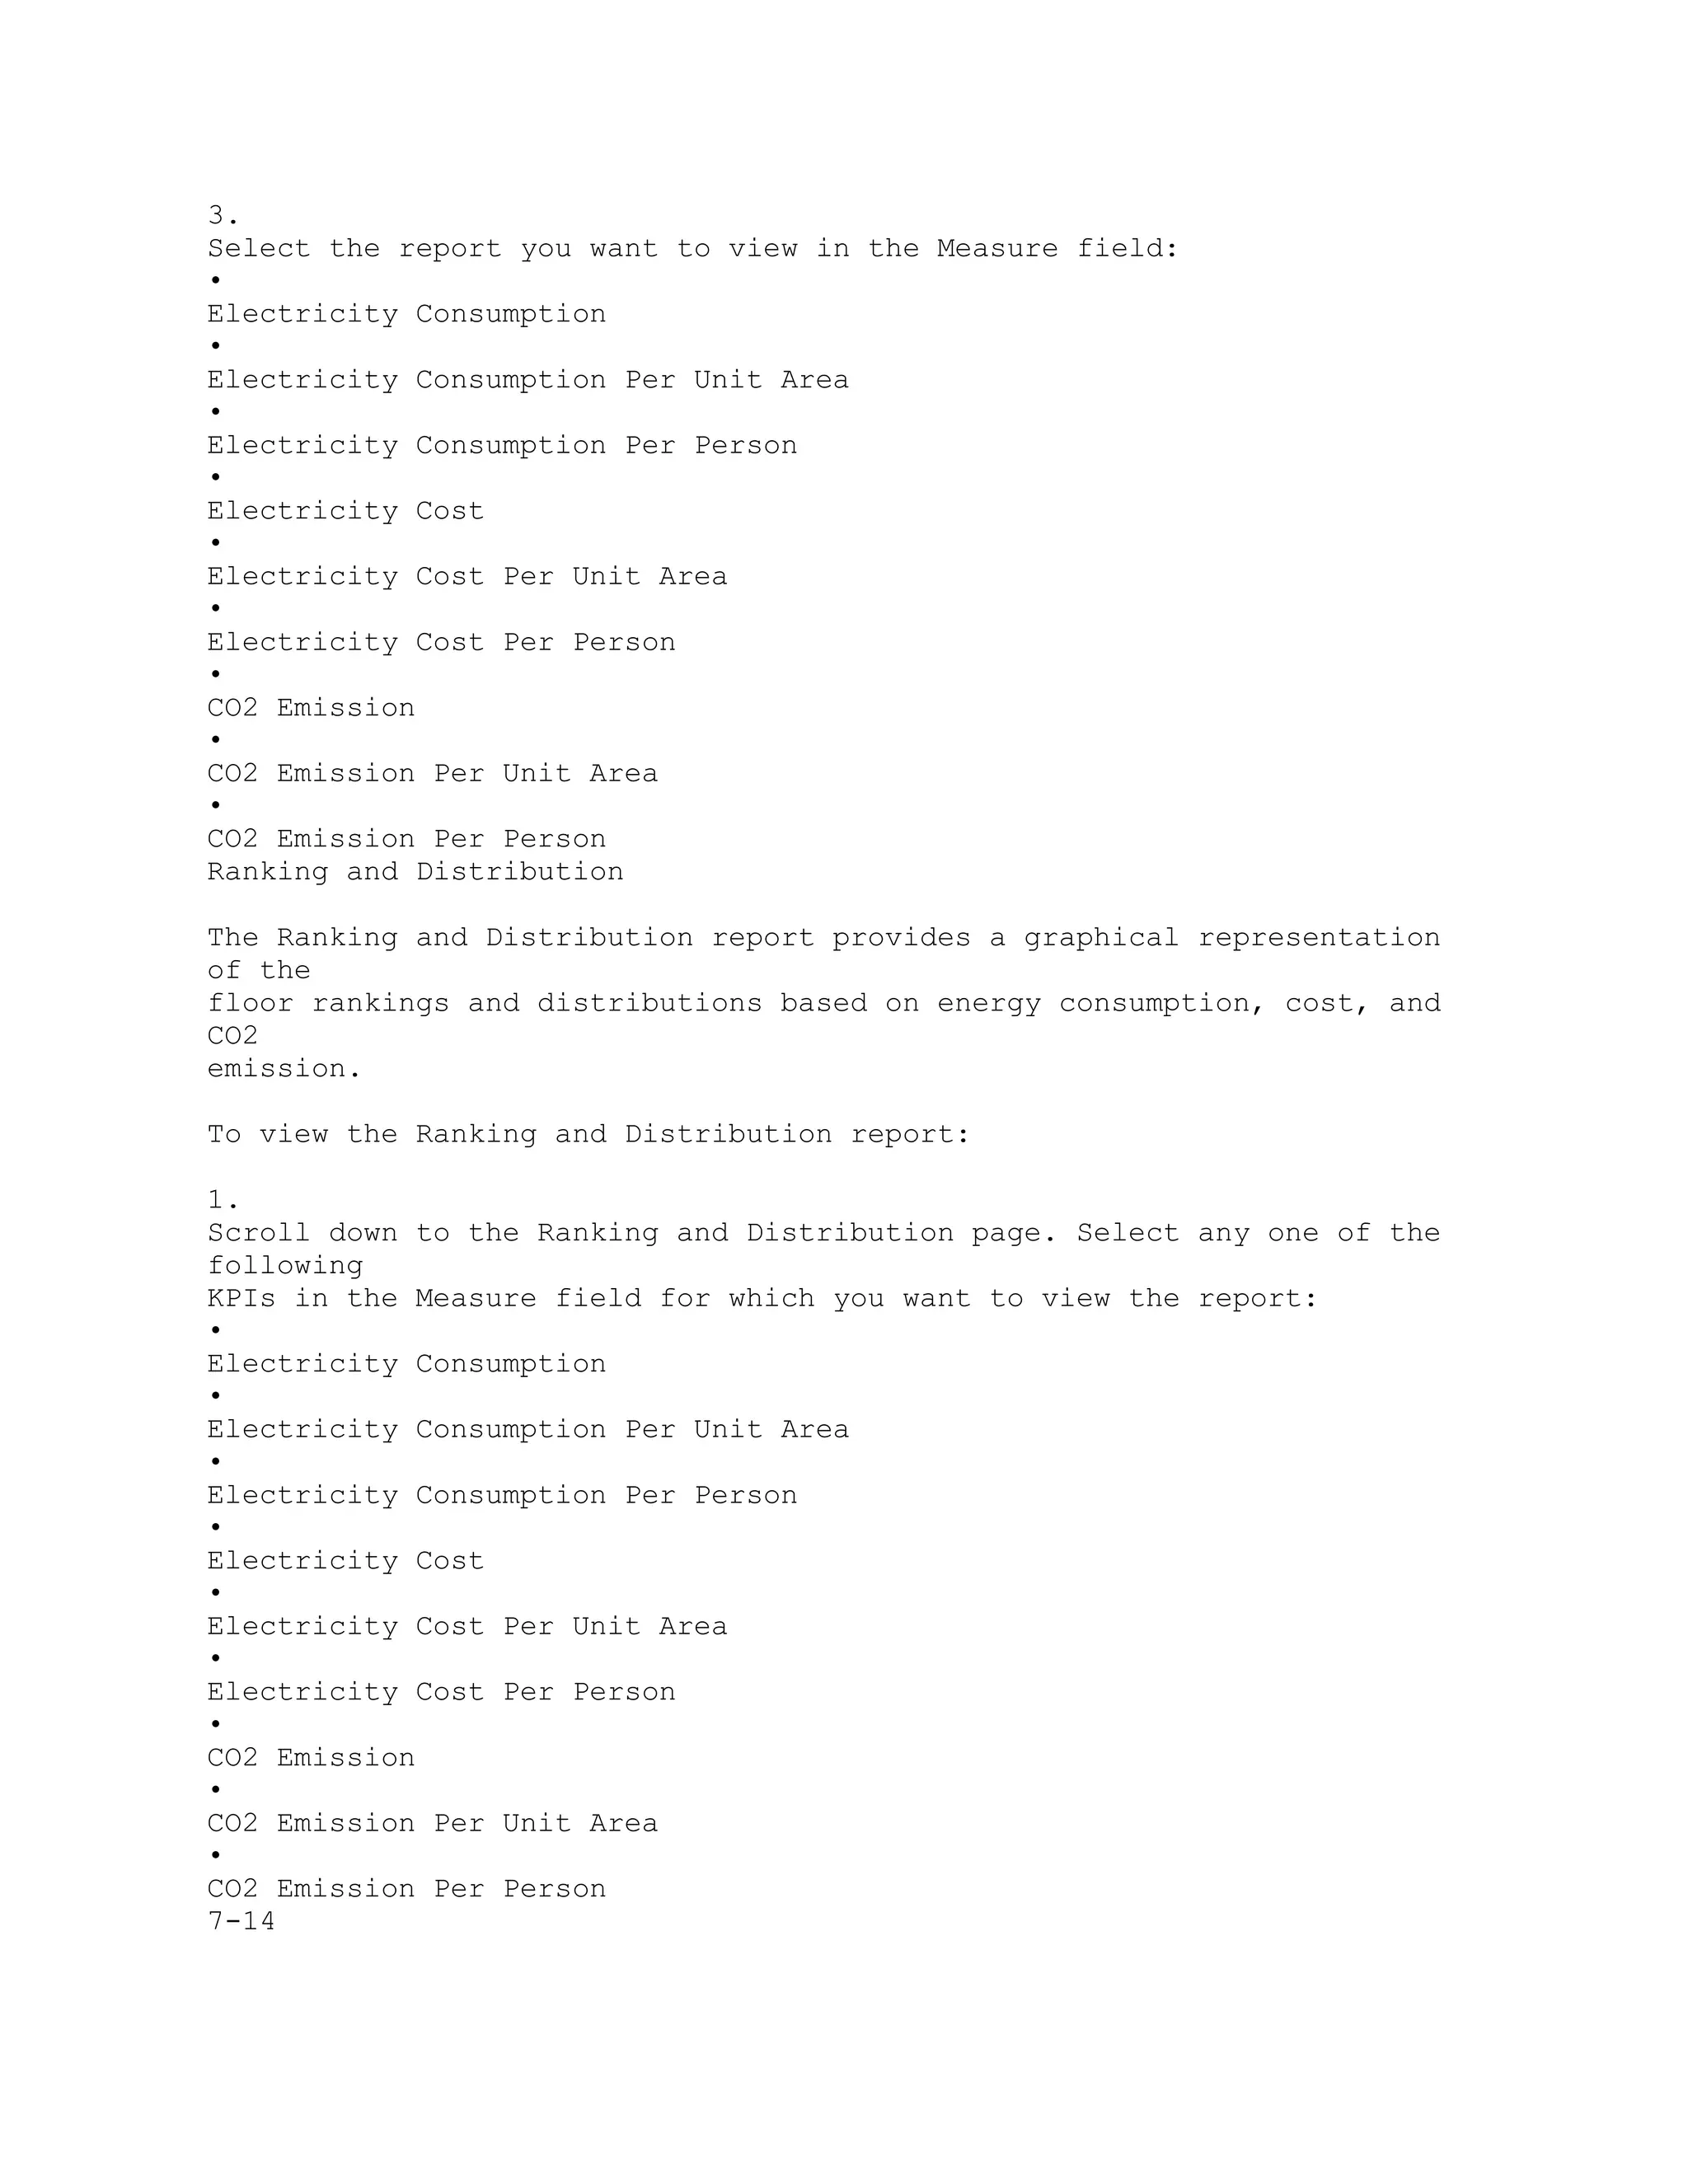
![Page Name Navigation Path
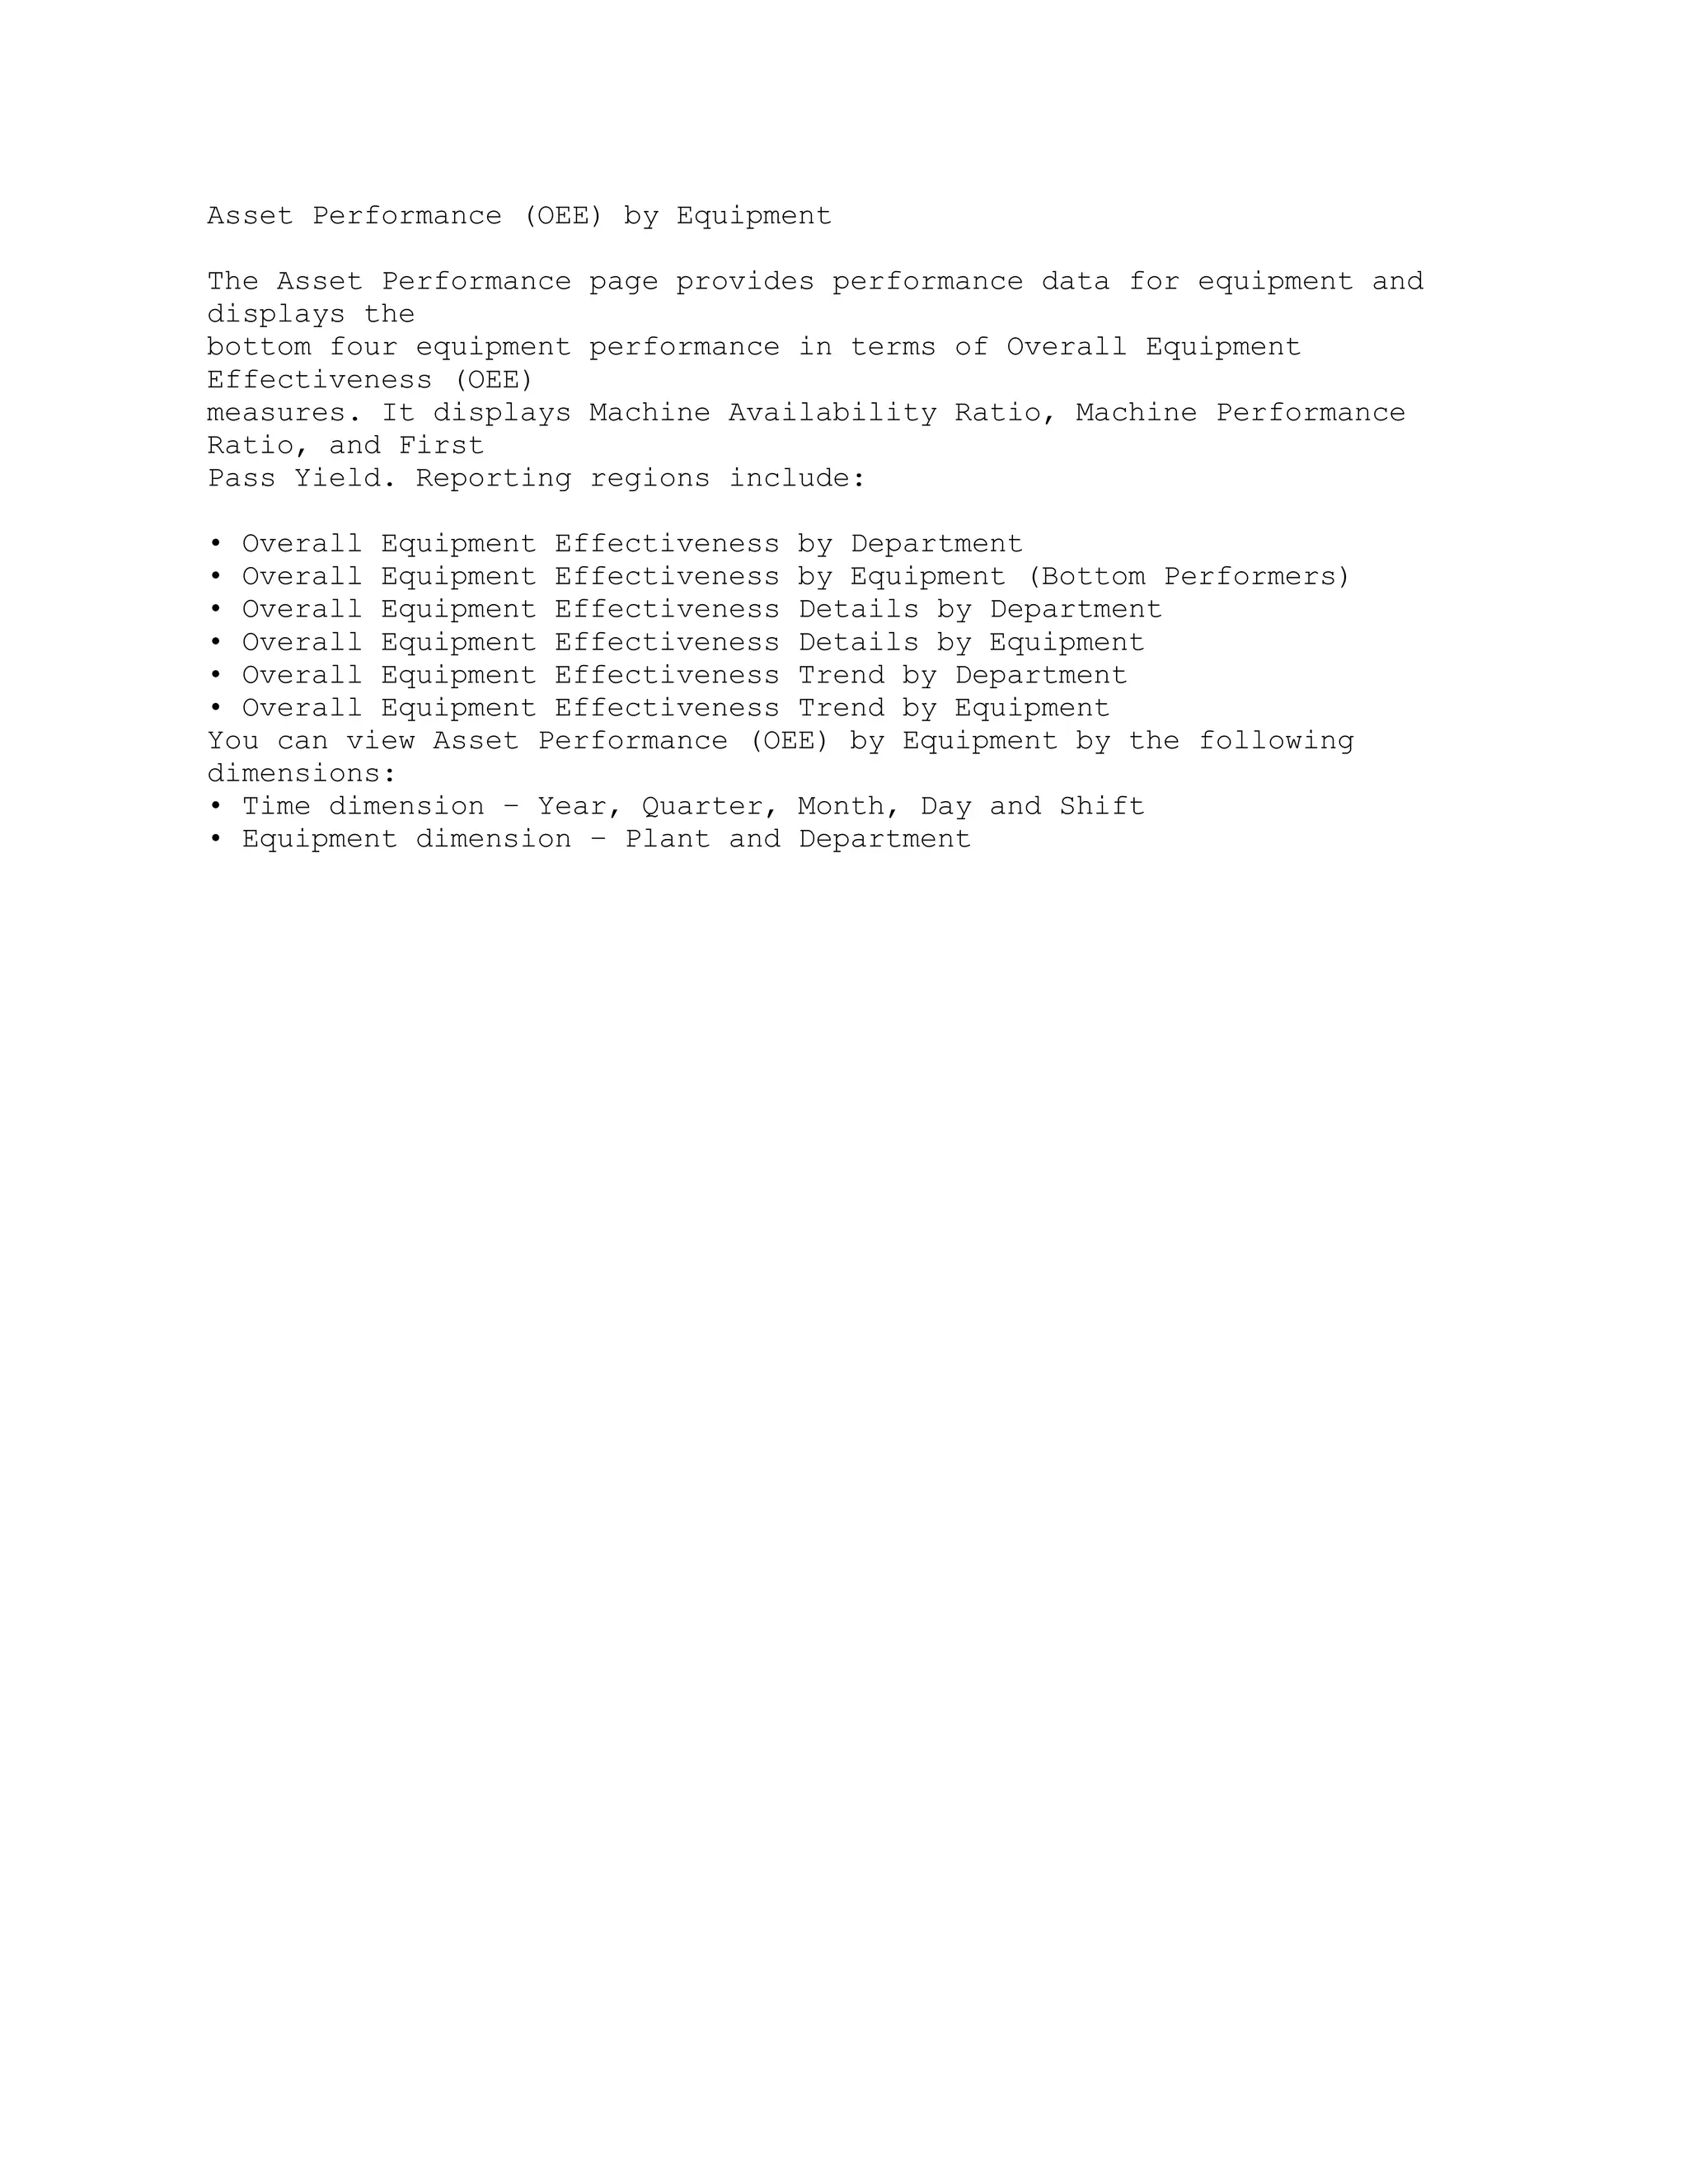
Asset Performance (OEE) by Equipment MOC User > Manufacturing Operations
Center Analytics > Plant Manager Dashboard
> [select a Bottom Performers Equipment
Gauge]
Attribute Group Details MOC Administrator > Extensible Attributes
Workbench > [select Entity type] > [select
Entity Name link] > Classifications tab
[Attribute Groups] > [Add Attribute Groups] >
[Display Name link]
Attribute Groups for Batch Operation MOC Administrator > Extensible
Attributes
Workbench > Batch Operations > [select Entity
Name link] > Classifications tab [Attribute
Groups]
Attribute Groups for Equipment MOC Administrator > Extensible Attributes
Workbench > Equipment > [select Entity
Name link] > Classifications tab [Attribute
Groups]
Attribute Groups for Item MOC Administrator > Extensible Attributes
Workbench > Items > [select Entity Name link]
>Classifications tab [Attribute Groups]
Attribute Groups for Others MOC Administrator > Extensible Attributes
Workbench > Others > [select Entity Name
link] > Classifications tab [Attribute Groups]
Attribute Groups for Work Order MOC Administrator > Extensible Attributes
Workbench > Work Orders > [select Entity
Name link] > Classifications tab [Attribute
Groups]
Batch Equipment Contextualization Update MOC Administrator > Setup >
Contextualization Setup > [select records] >
[Enter Context in Batch]
Batch Operations Segments Overview MOC User > Extensible Attributes Data
>
Batch Operations > [select an Entity Name
link] > Entity: Batch Operation select [Entity
Name link]
3](https://image.slidesharecdn.com/12-1-man-operationcenter-ug2-150223055255-conversion-gate02/75/12-1-man-operation-center-ug-2-163-2048.jpg)
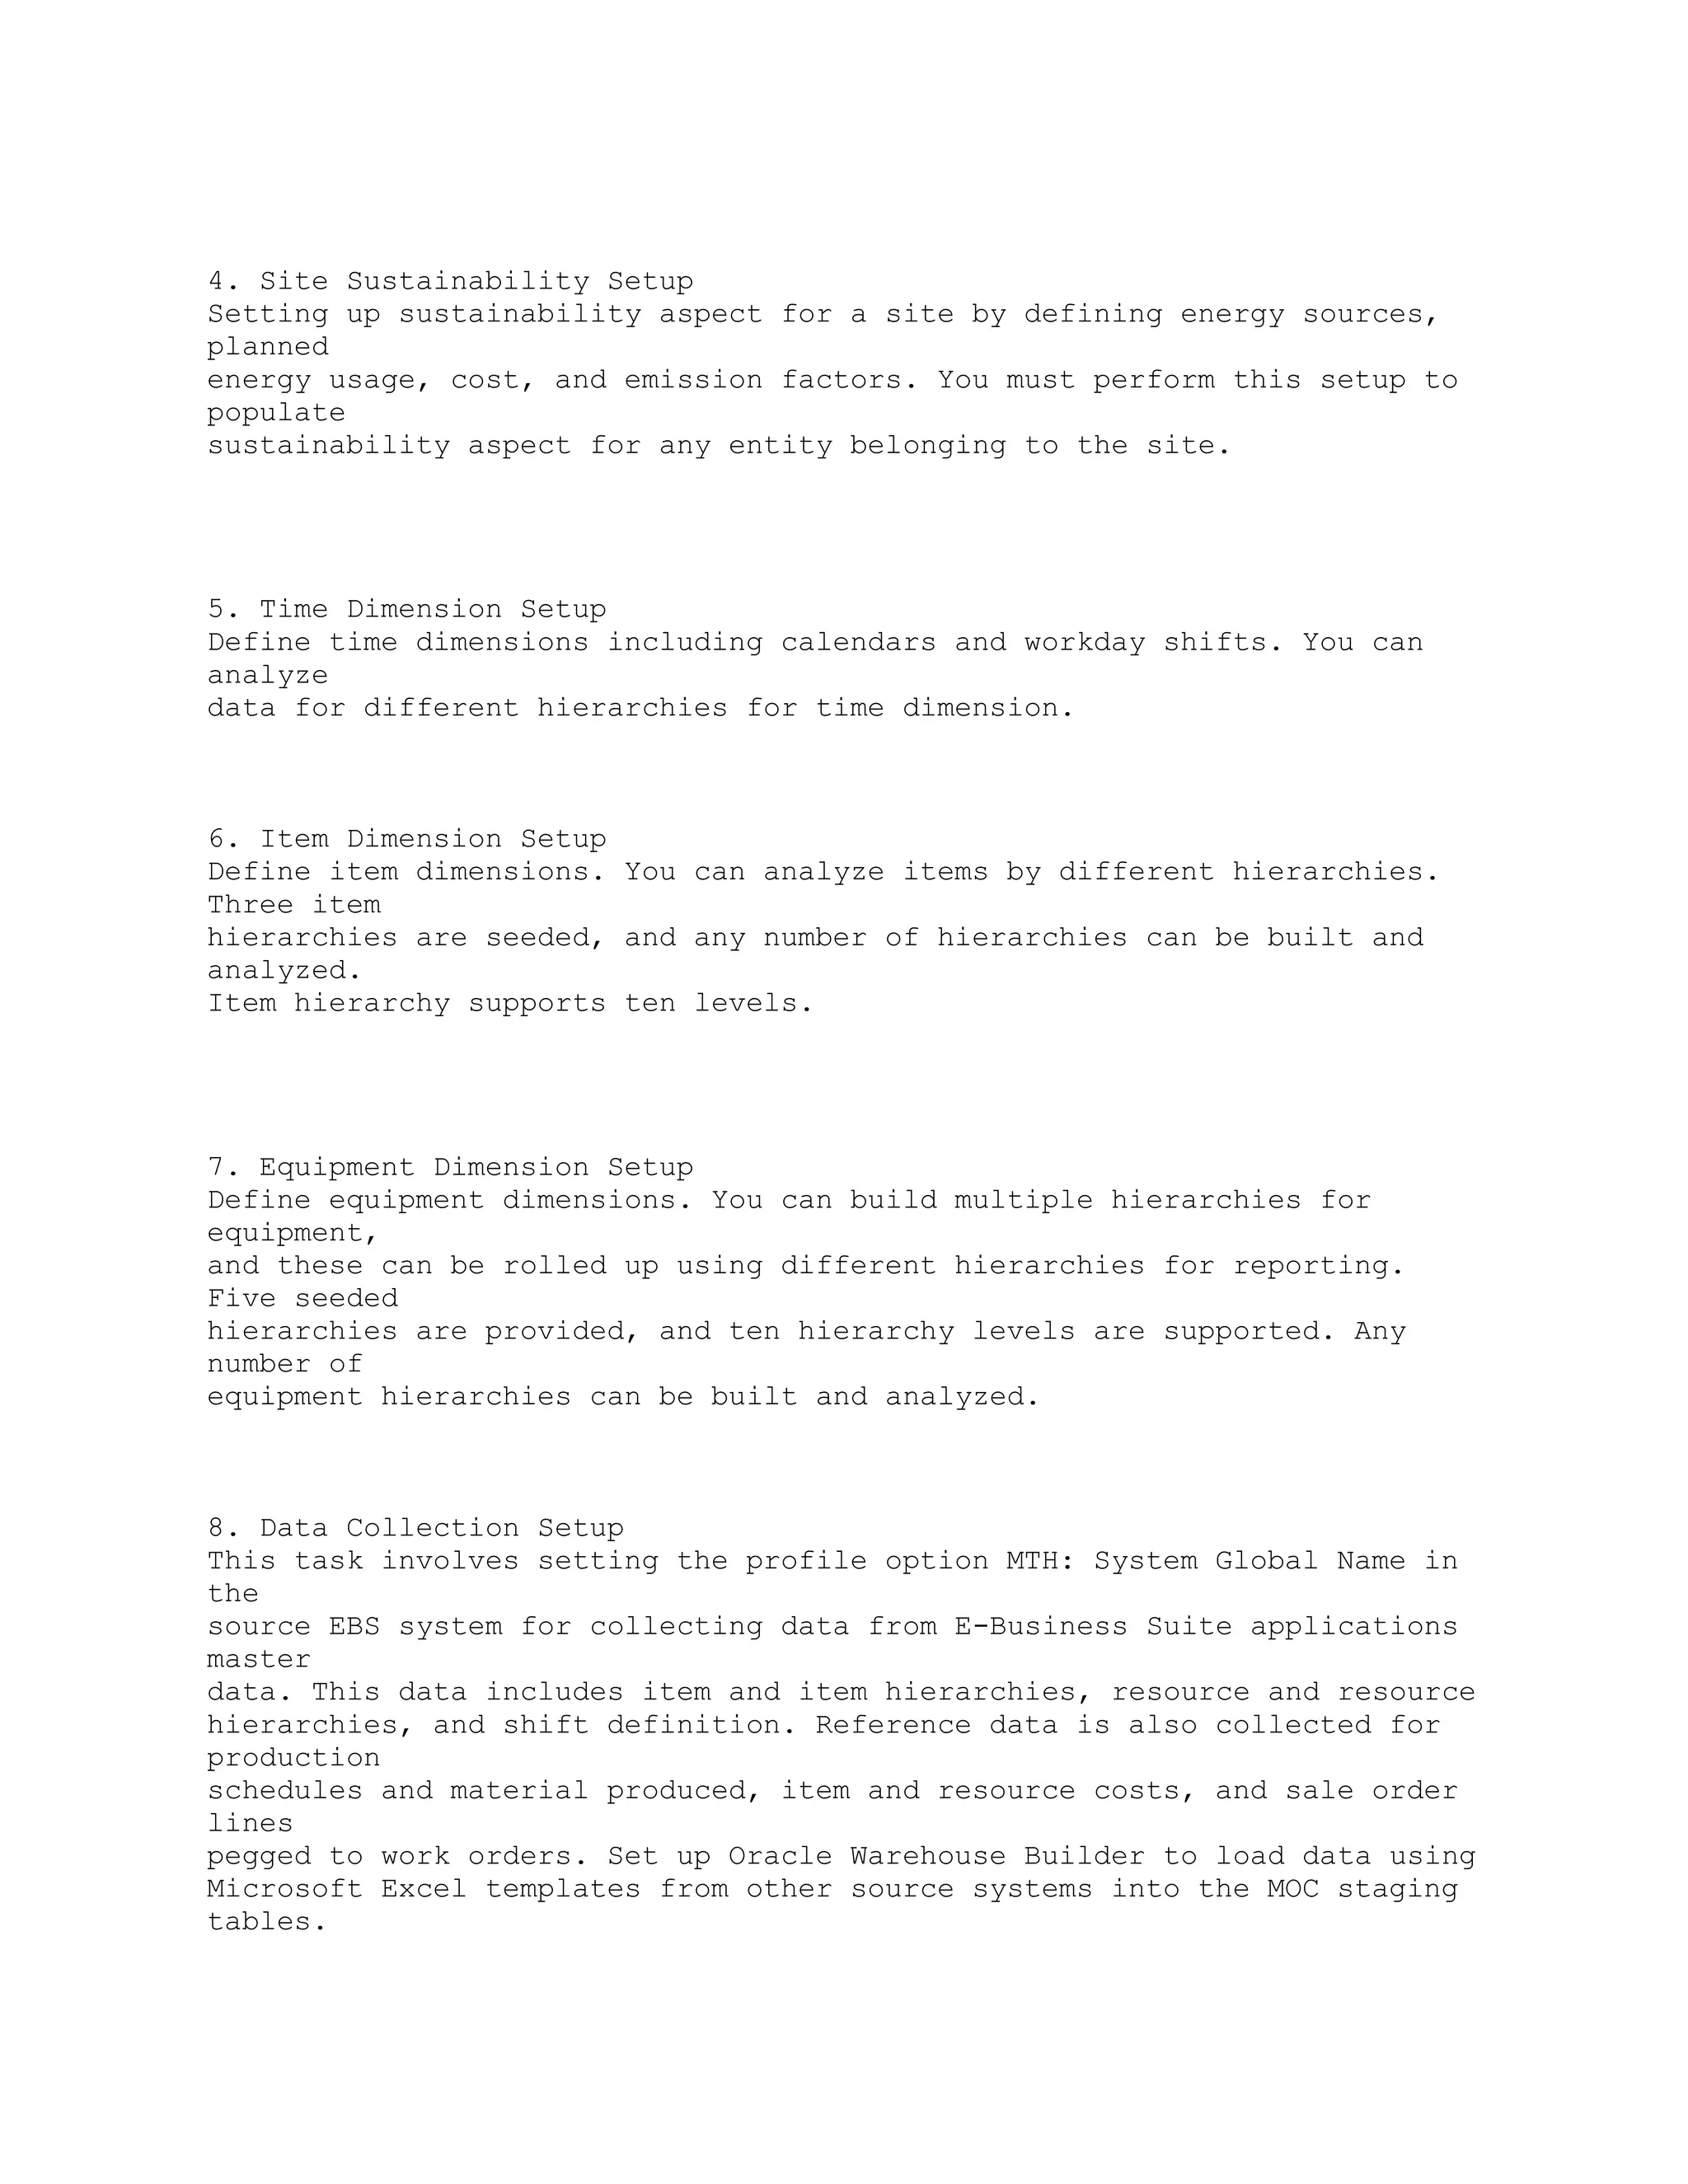
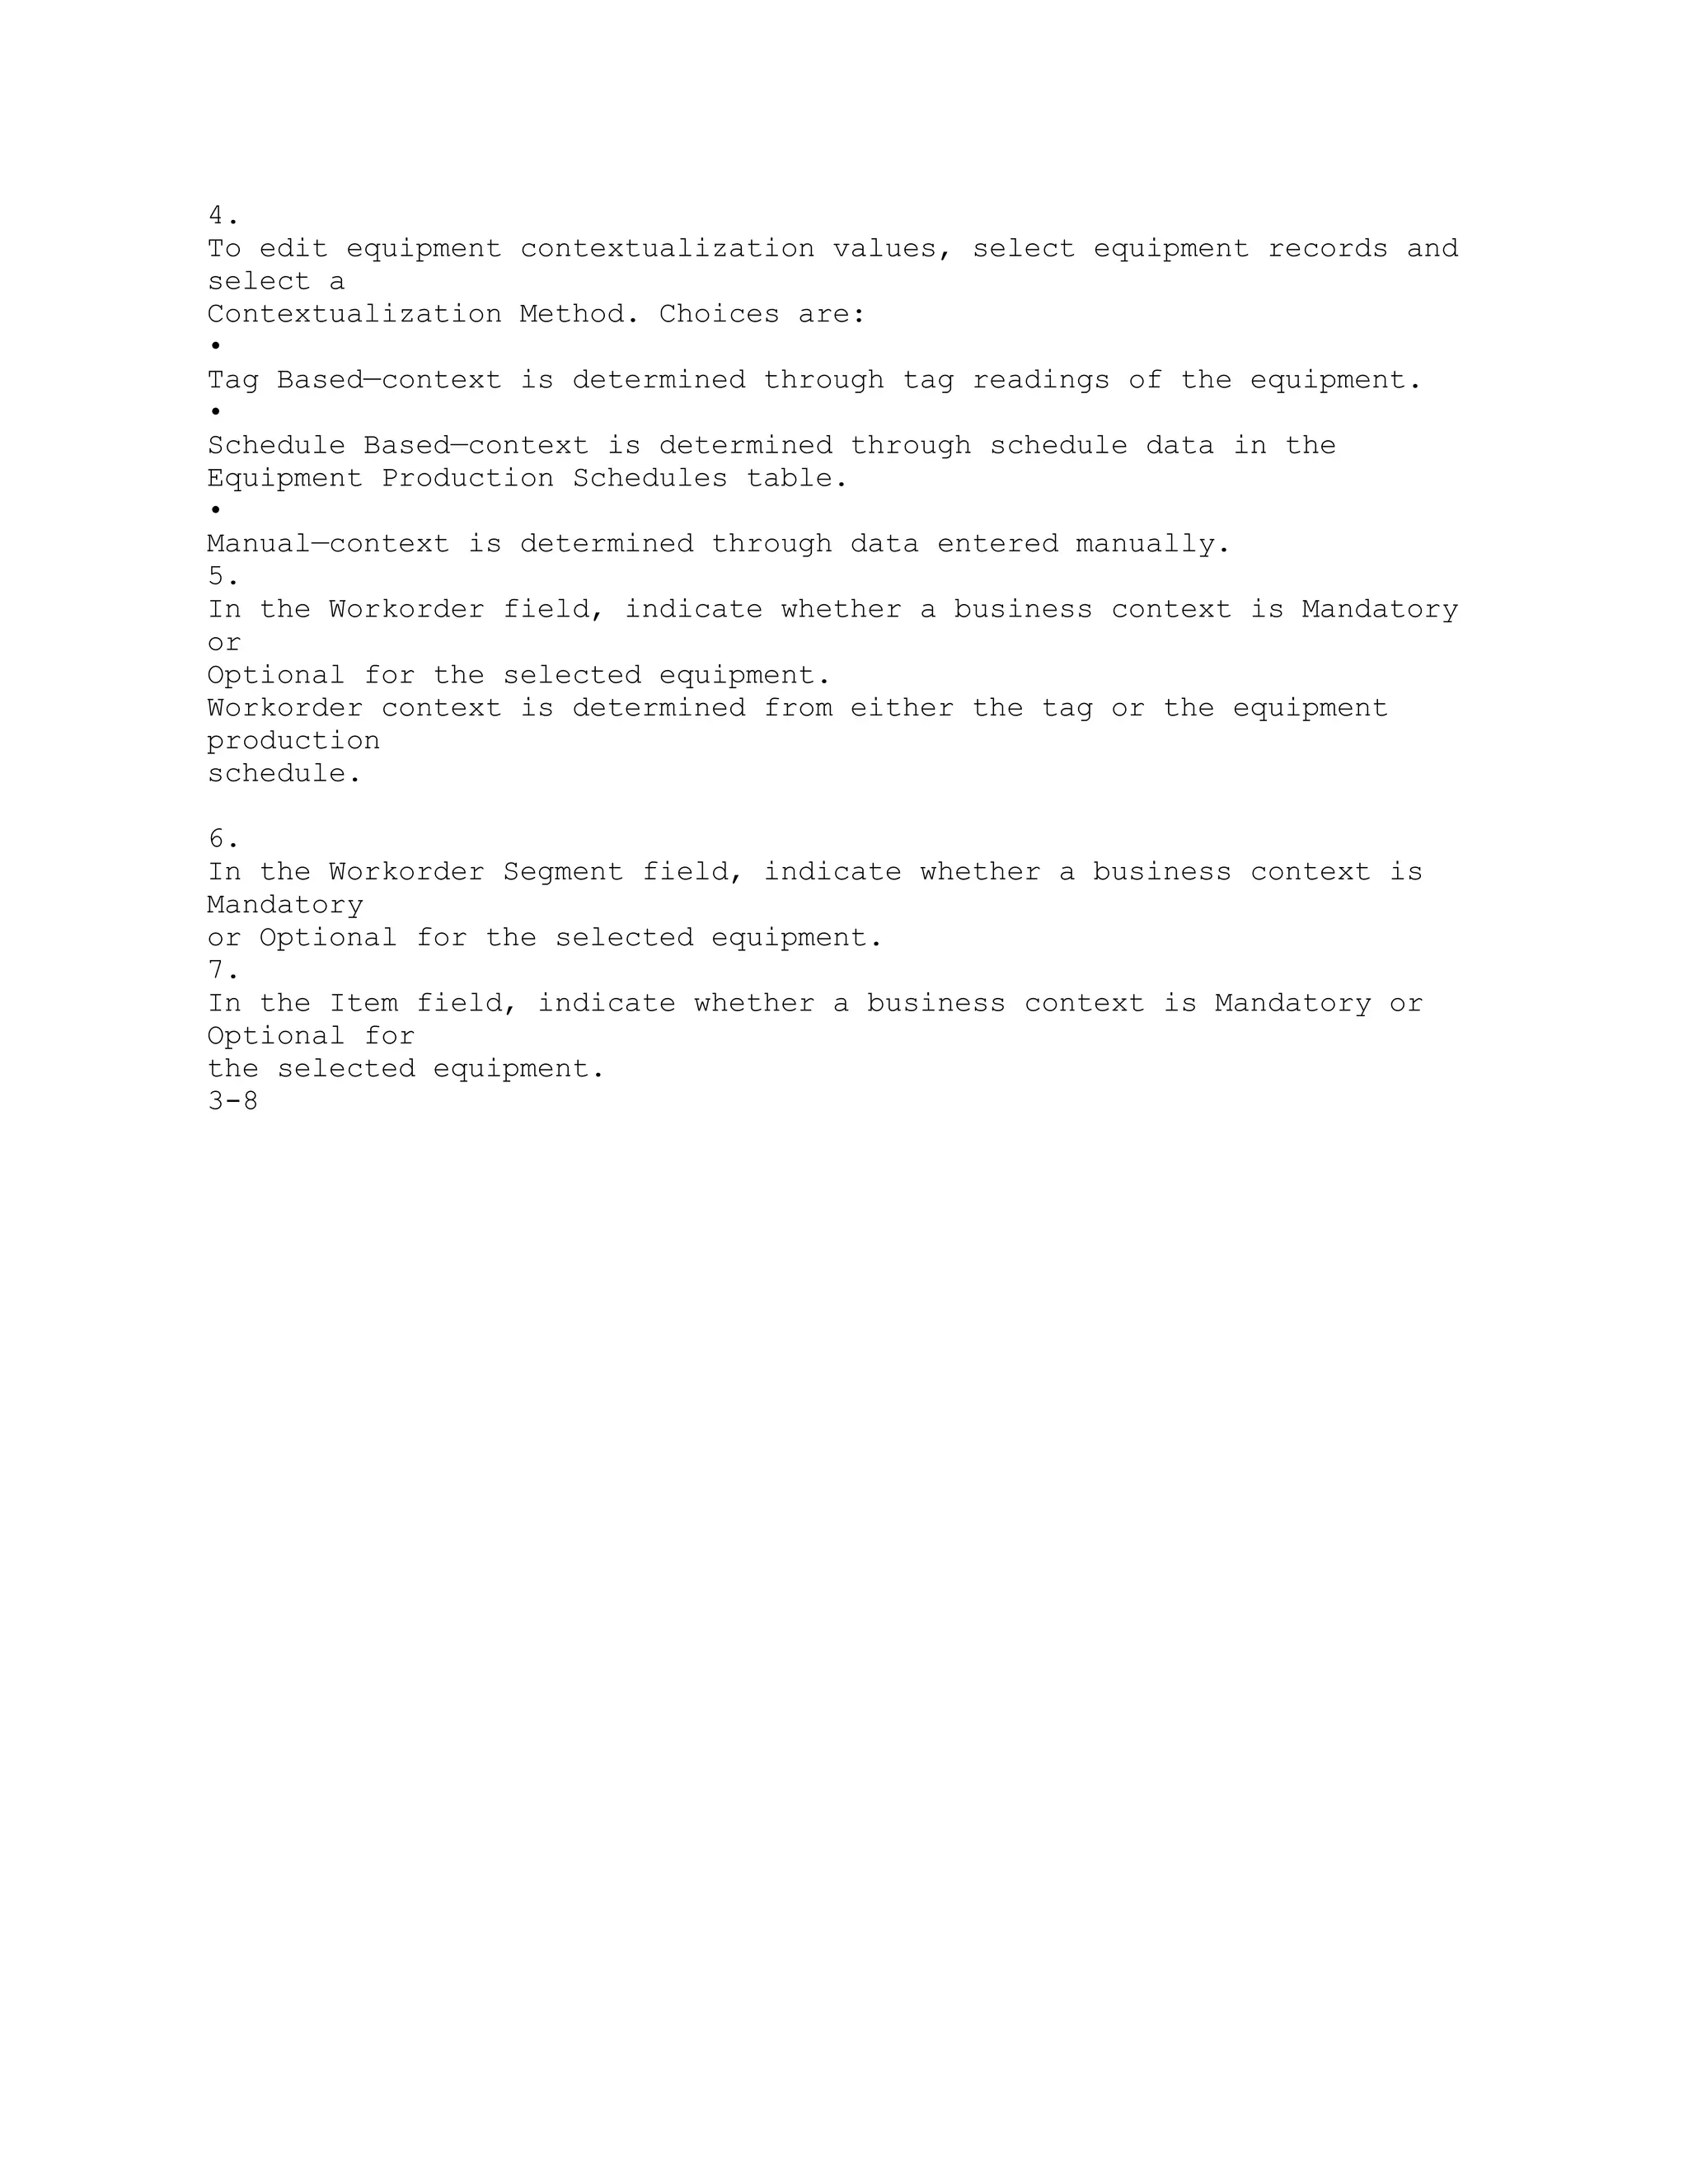
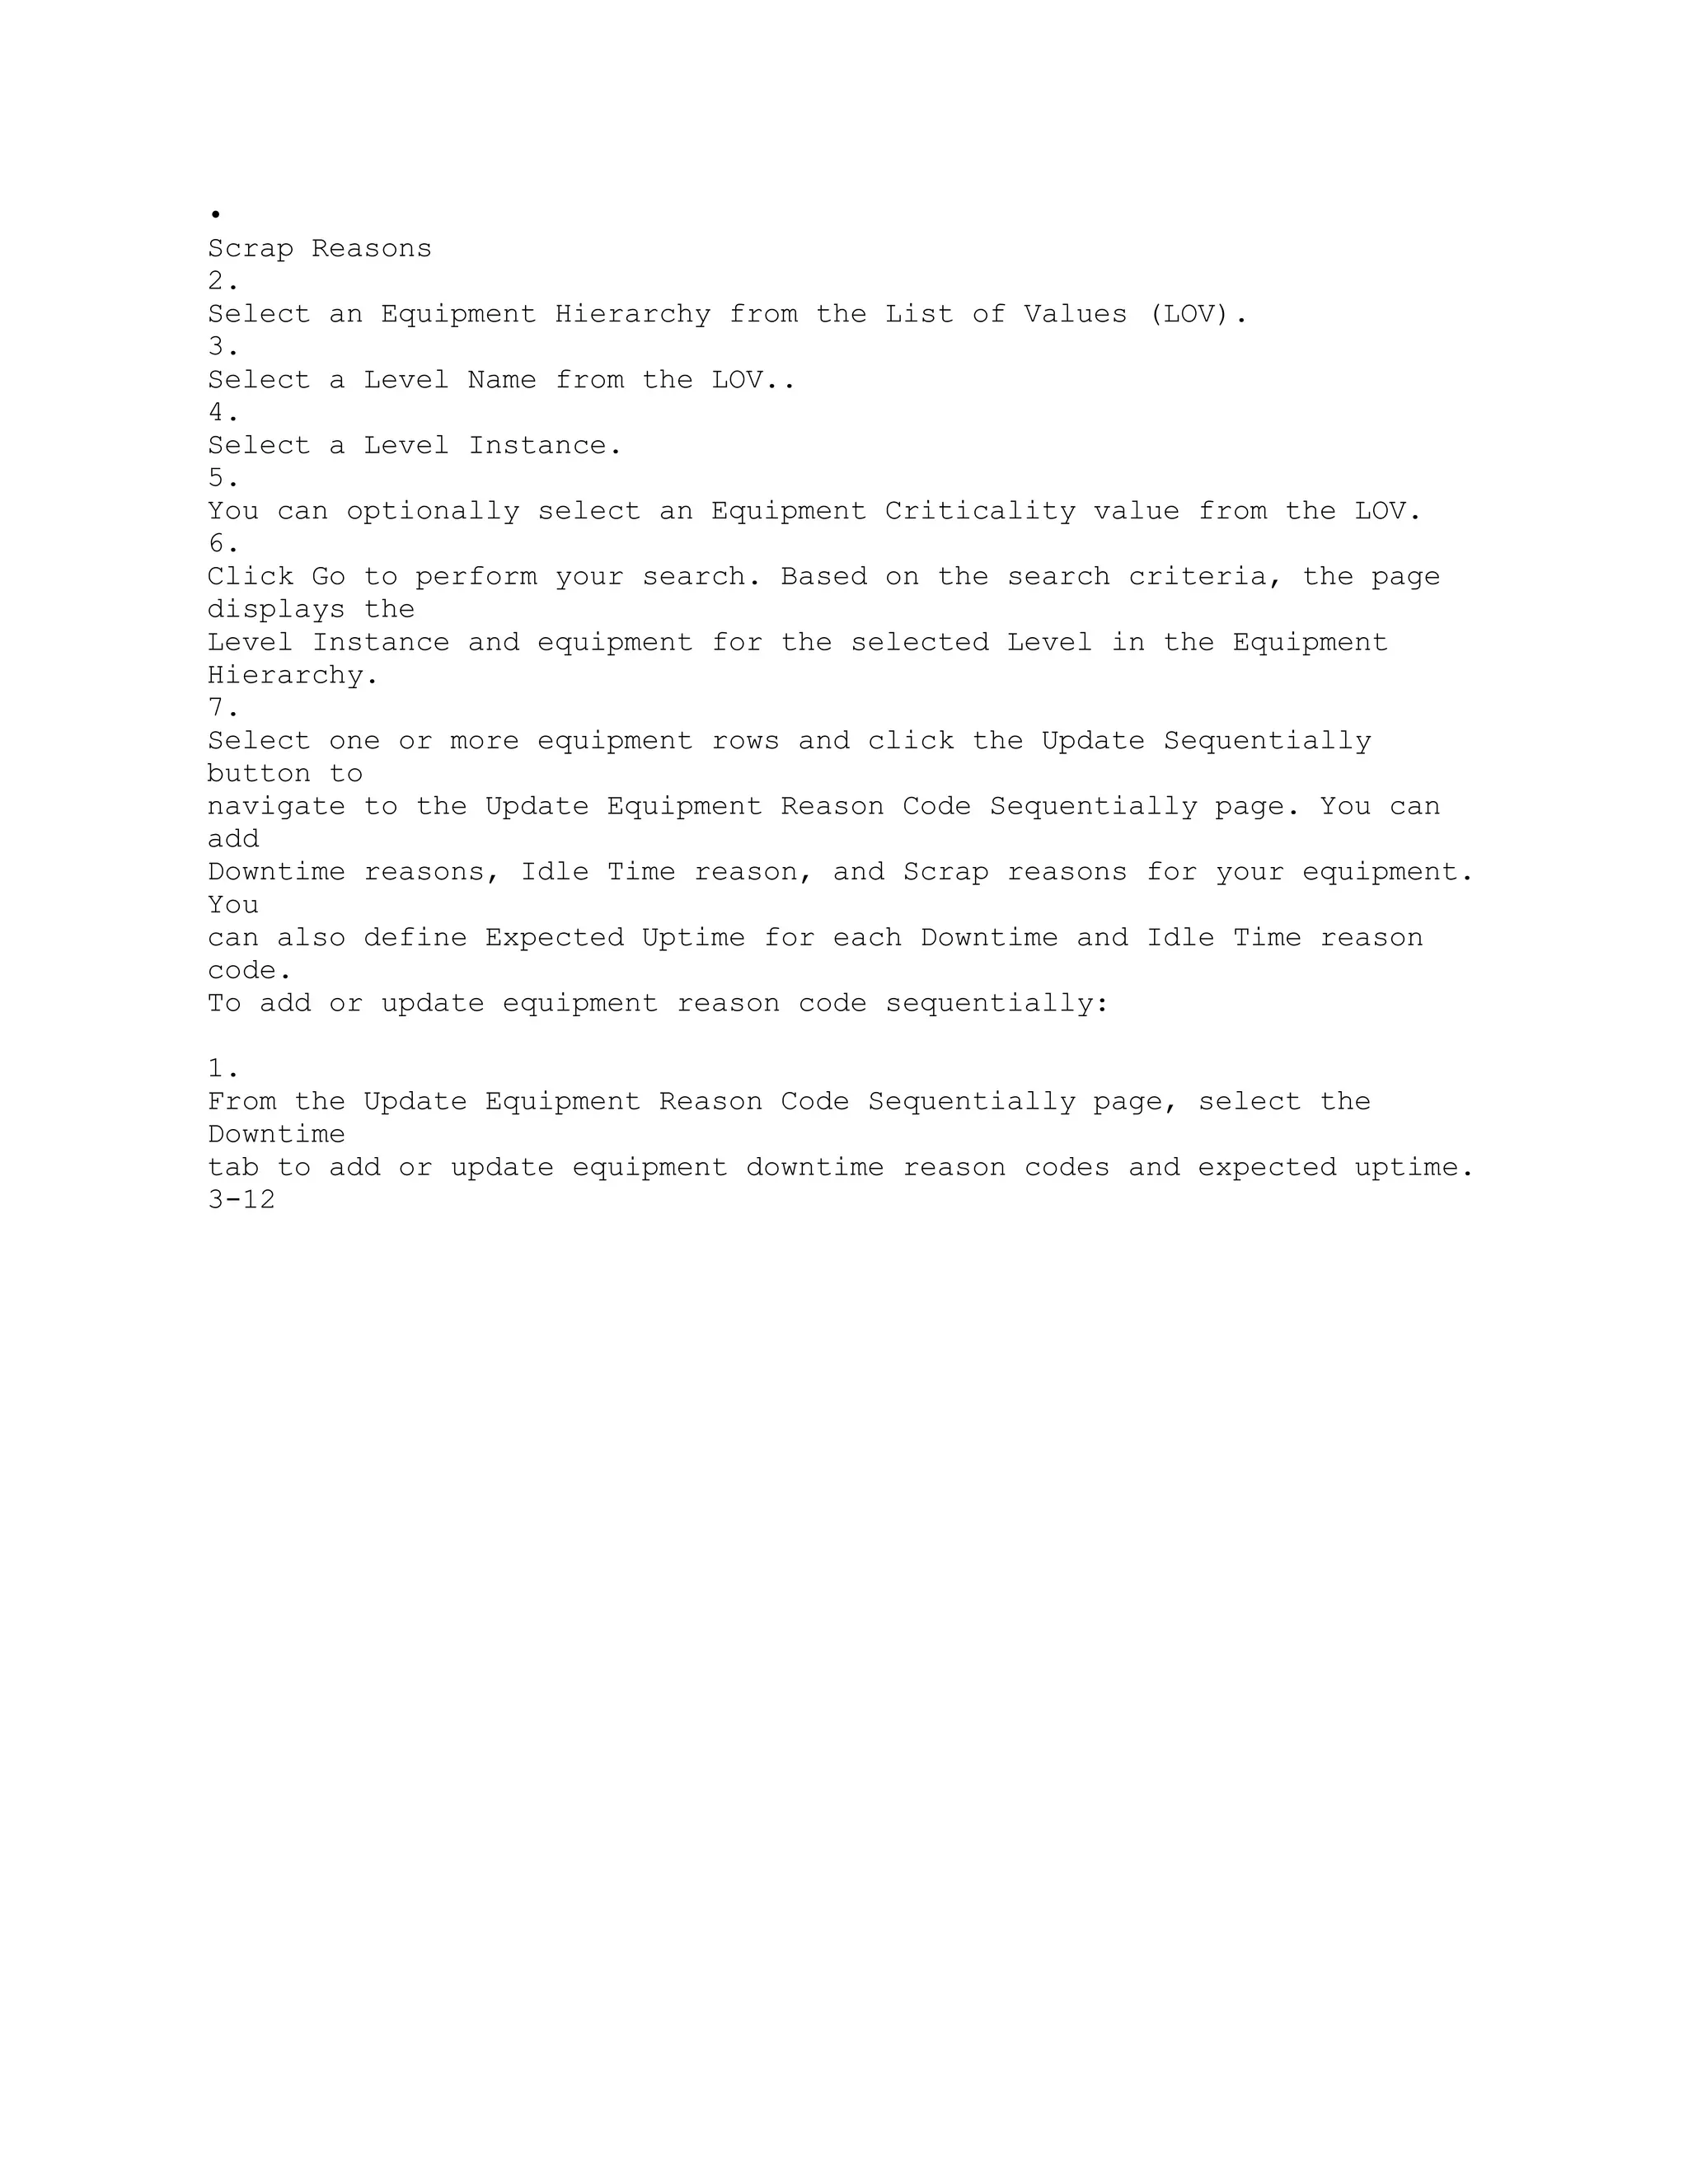
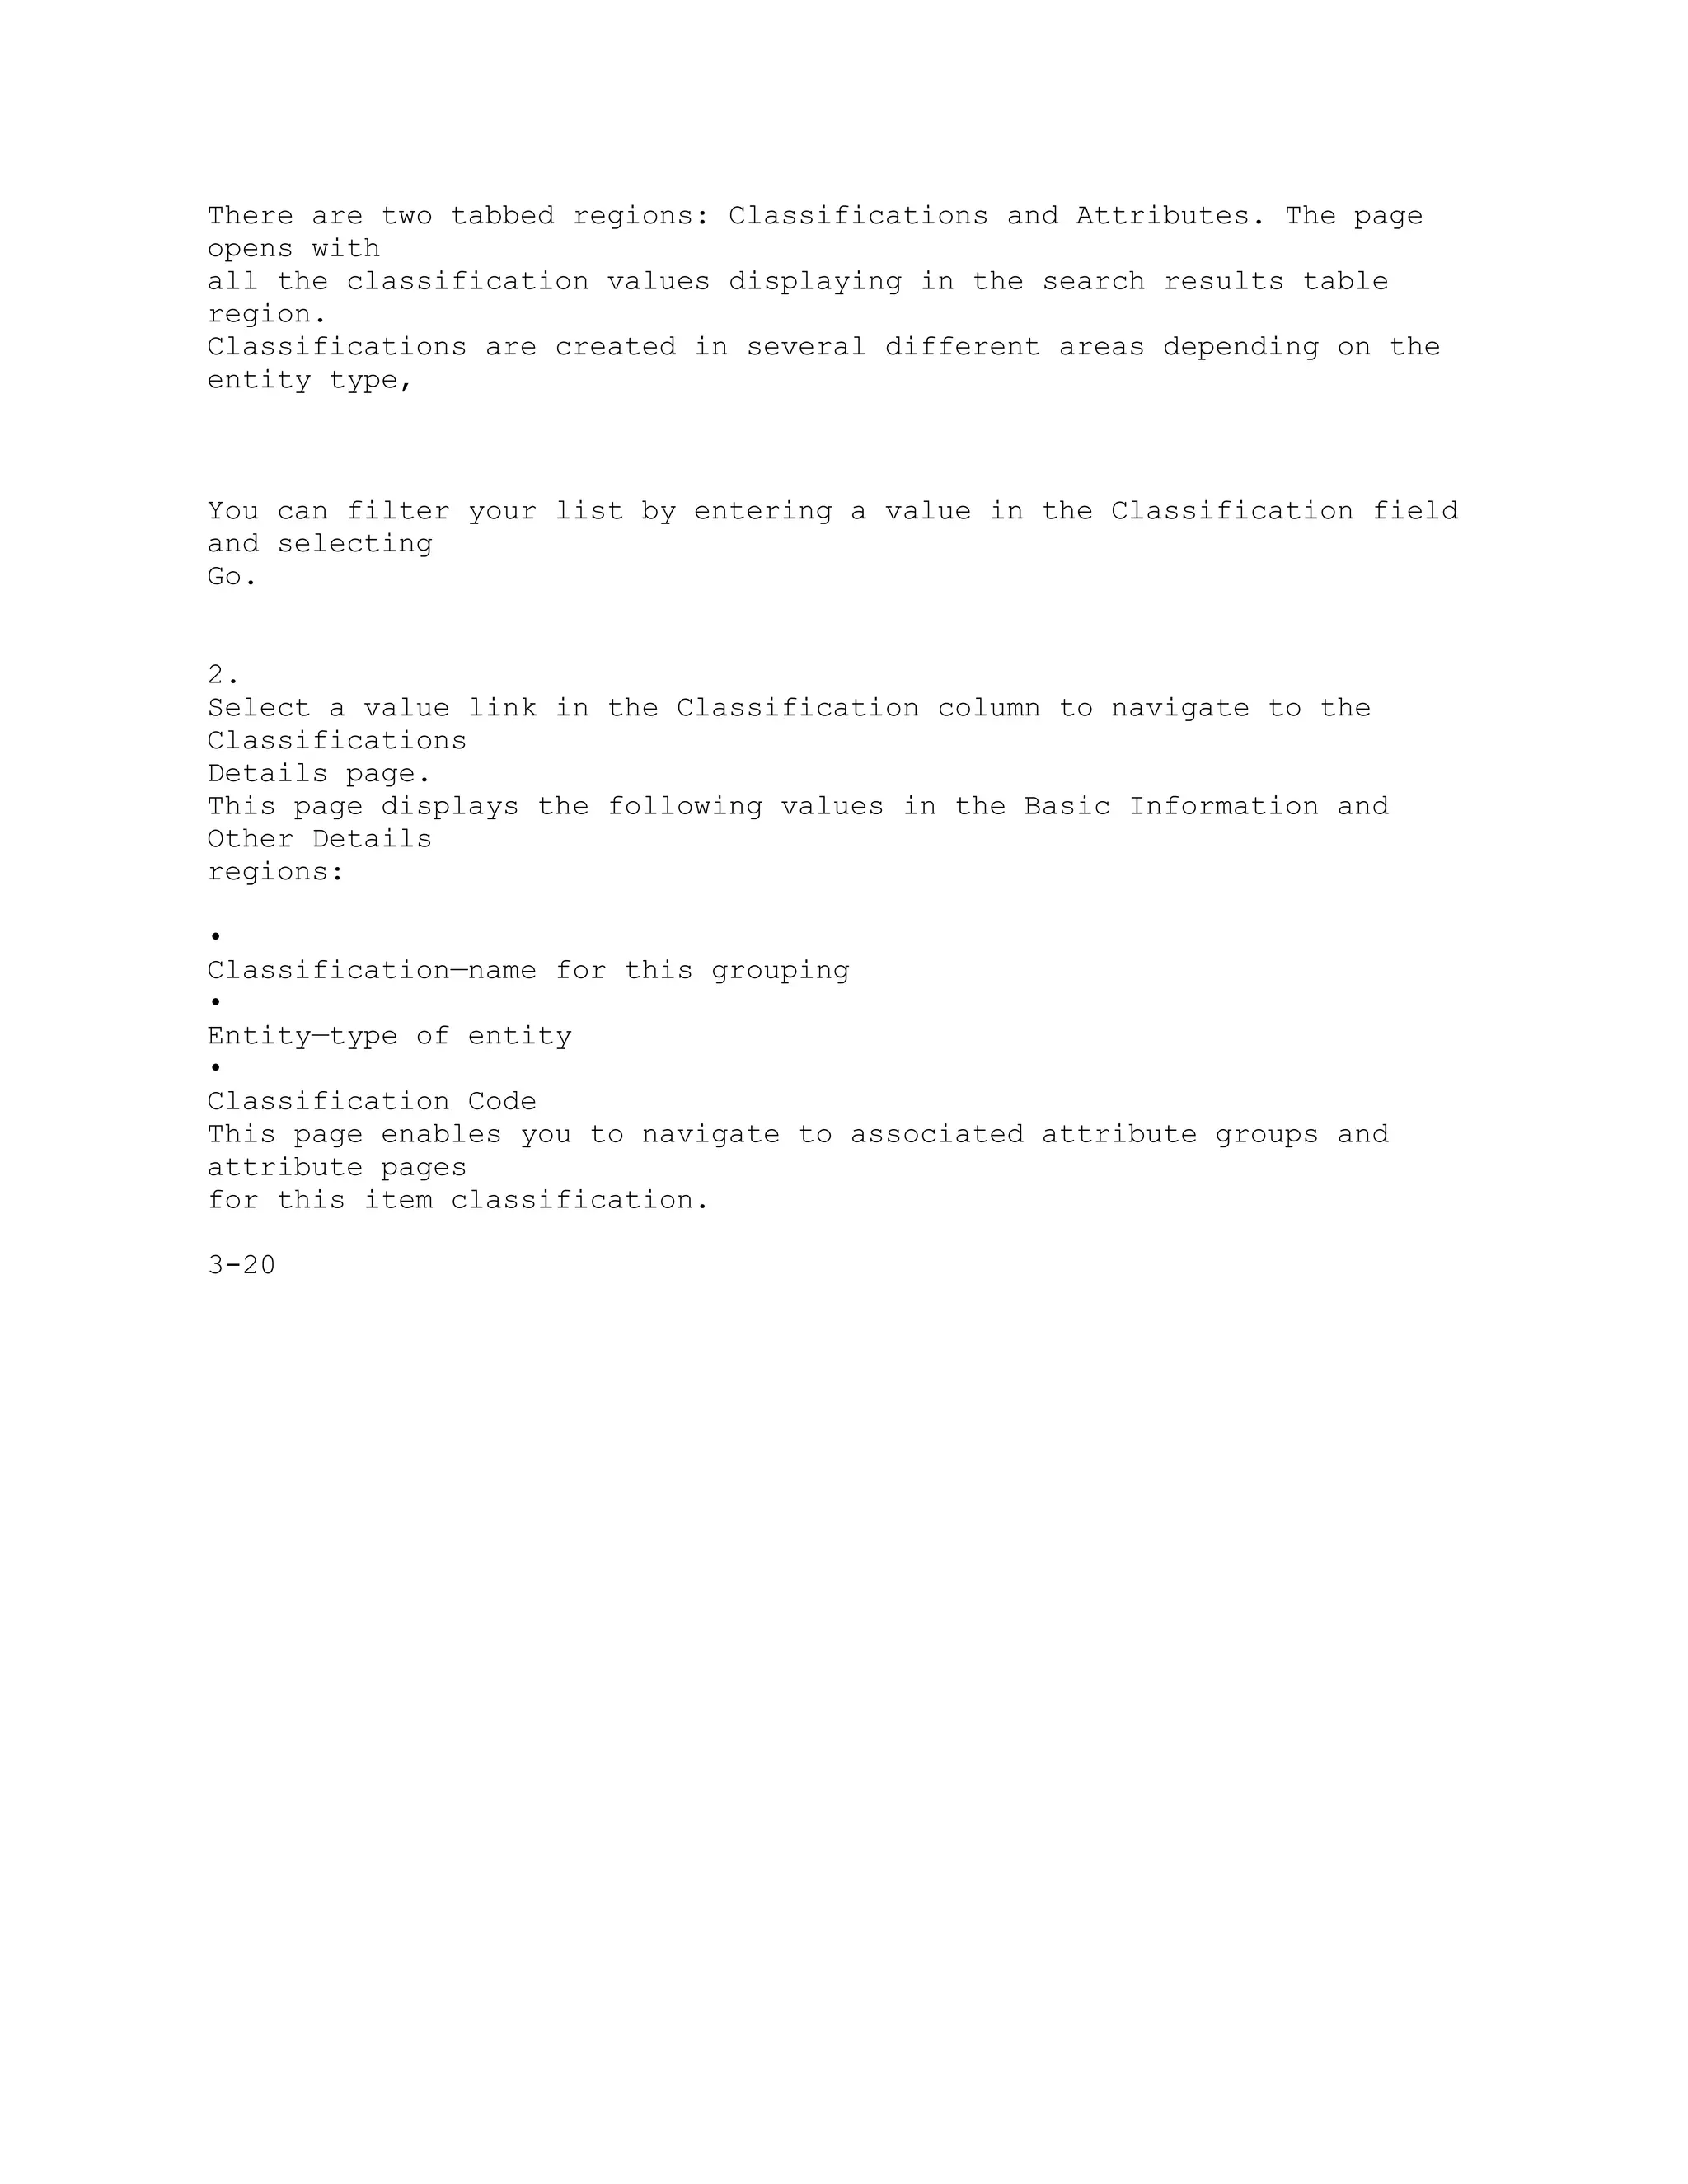
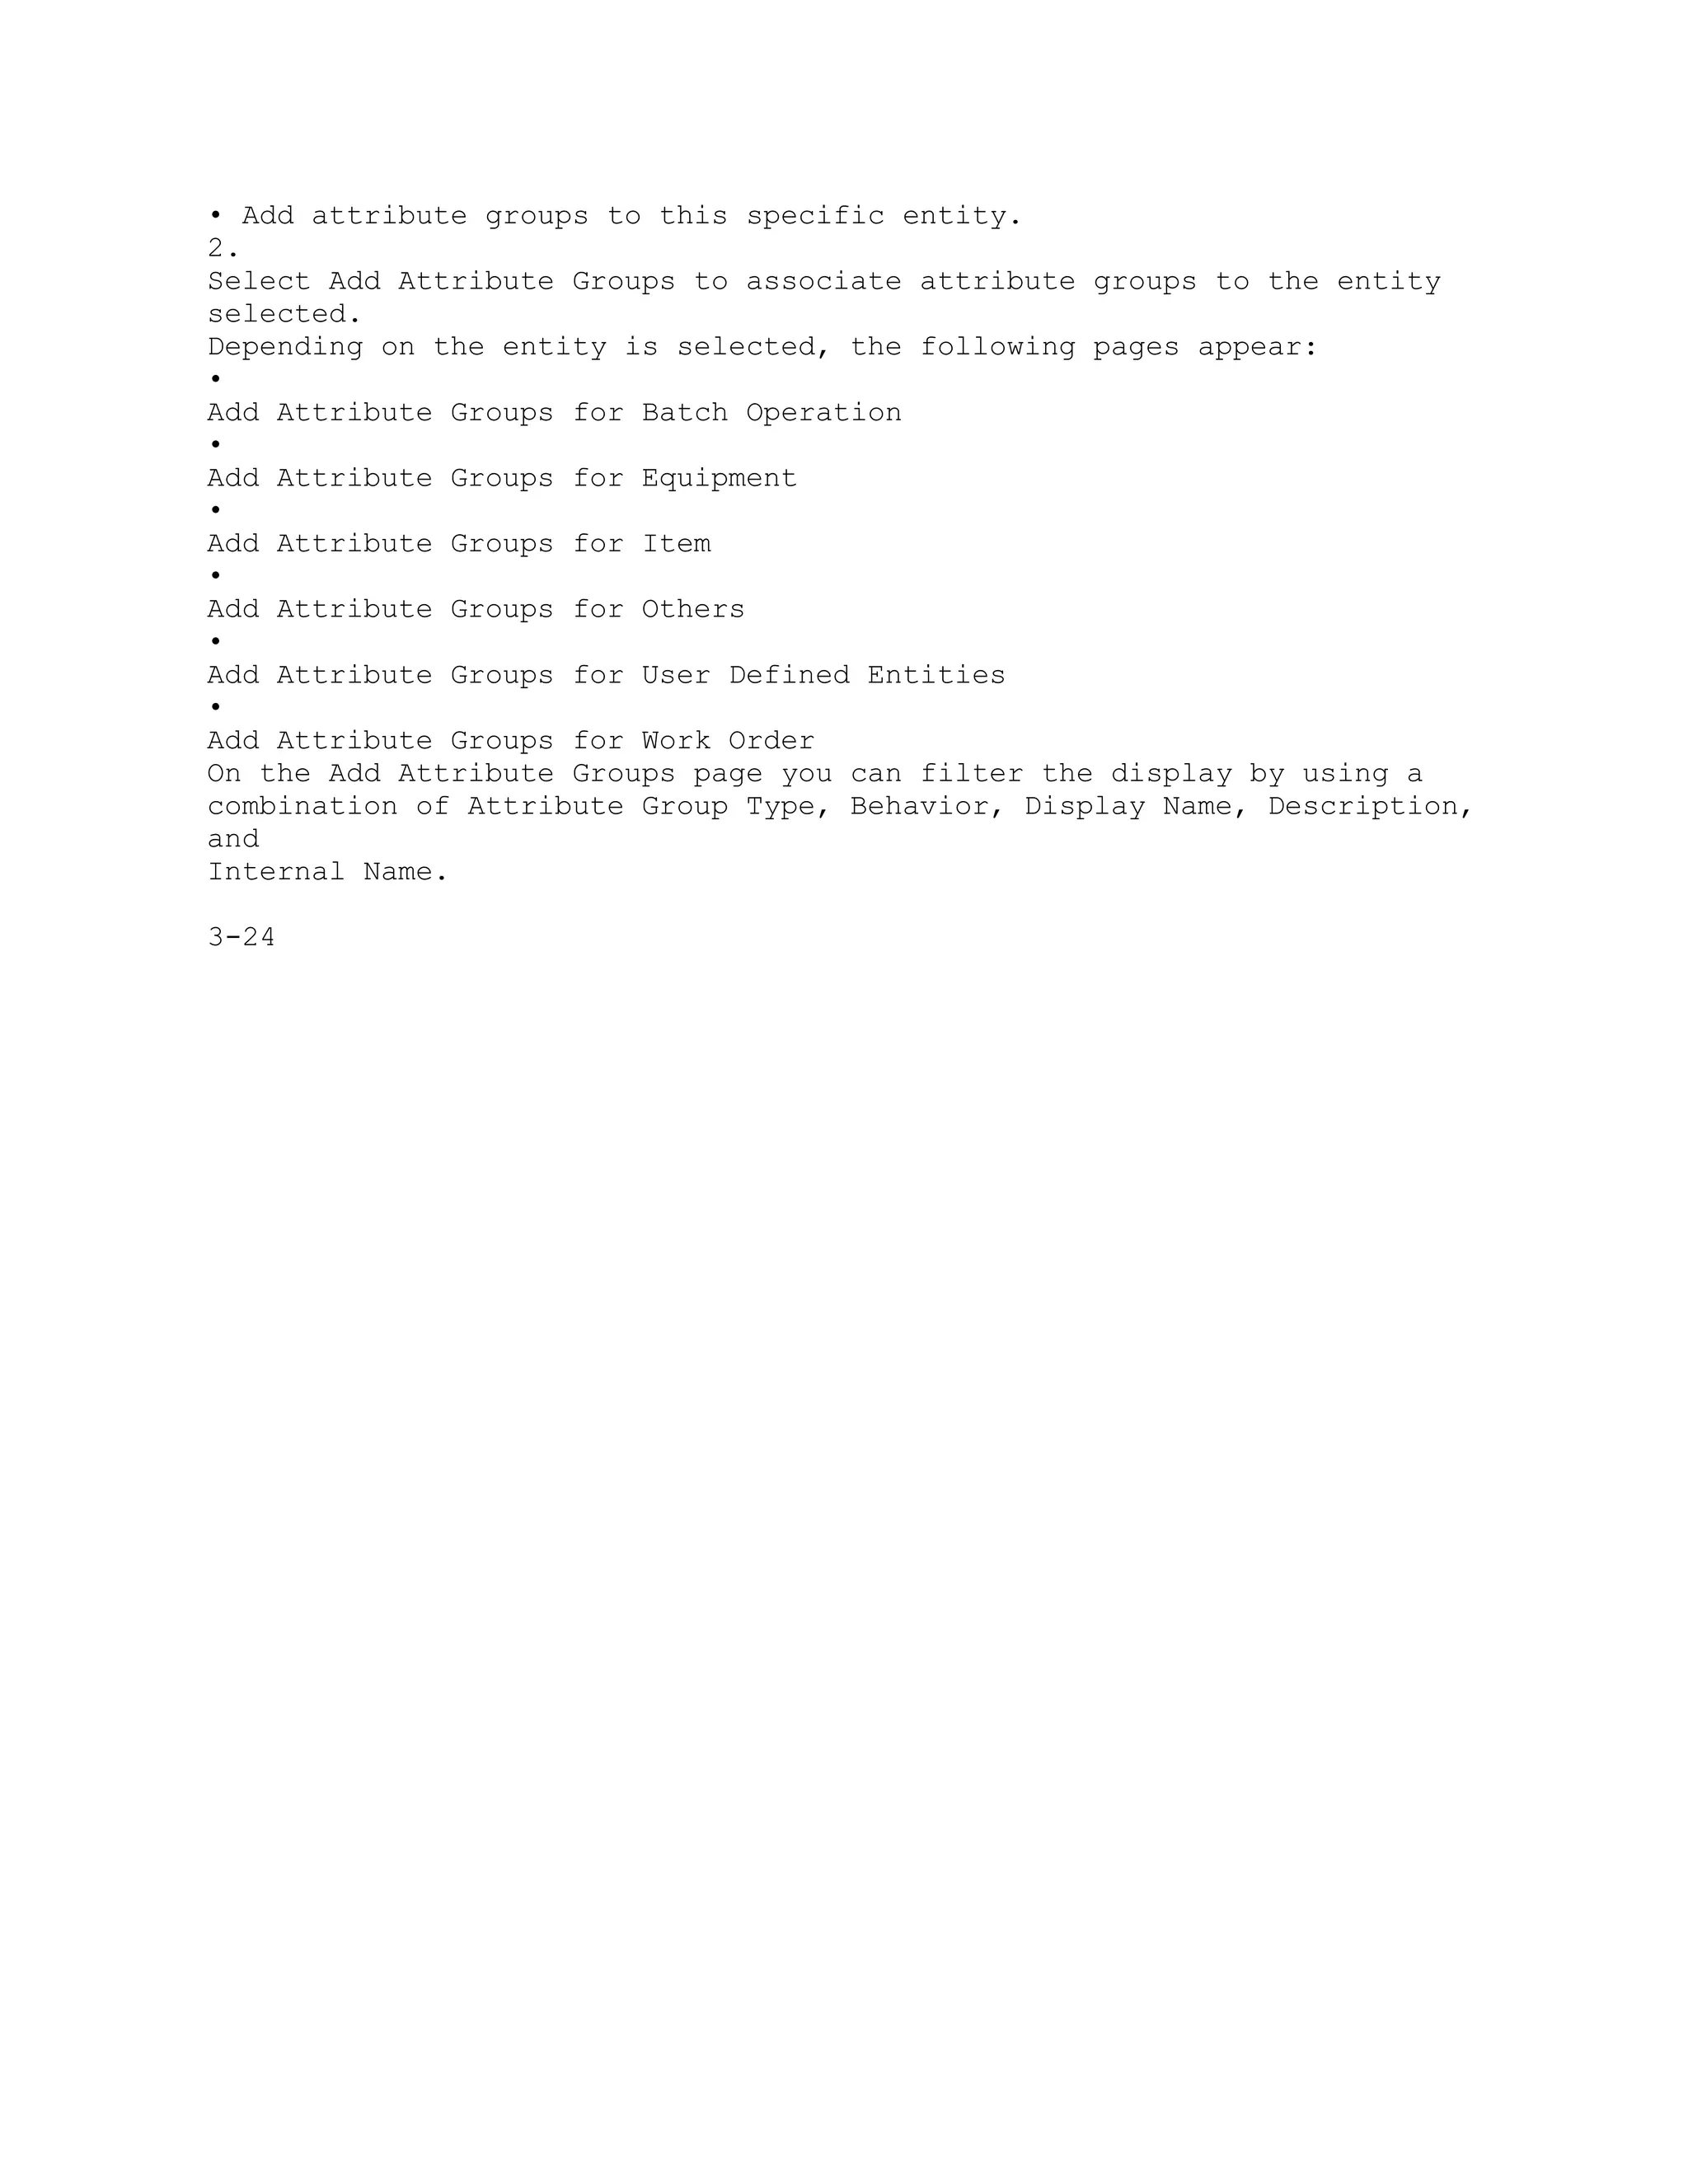
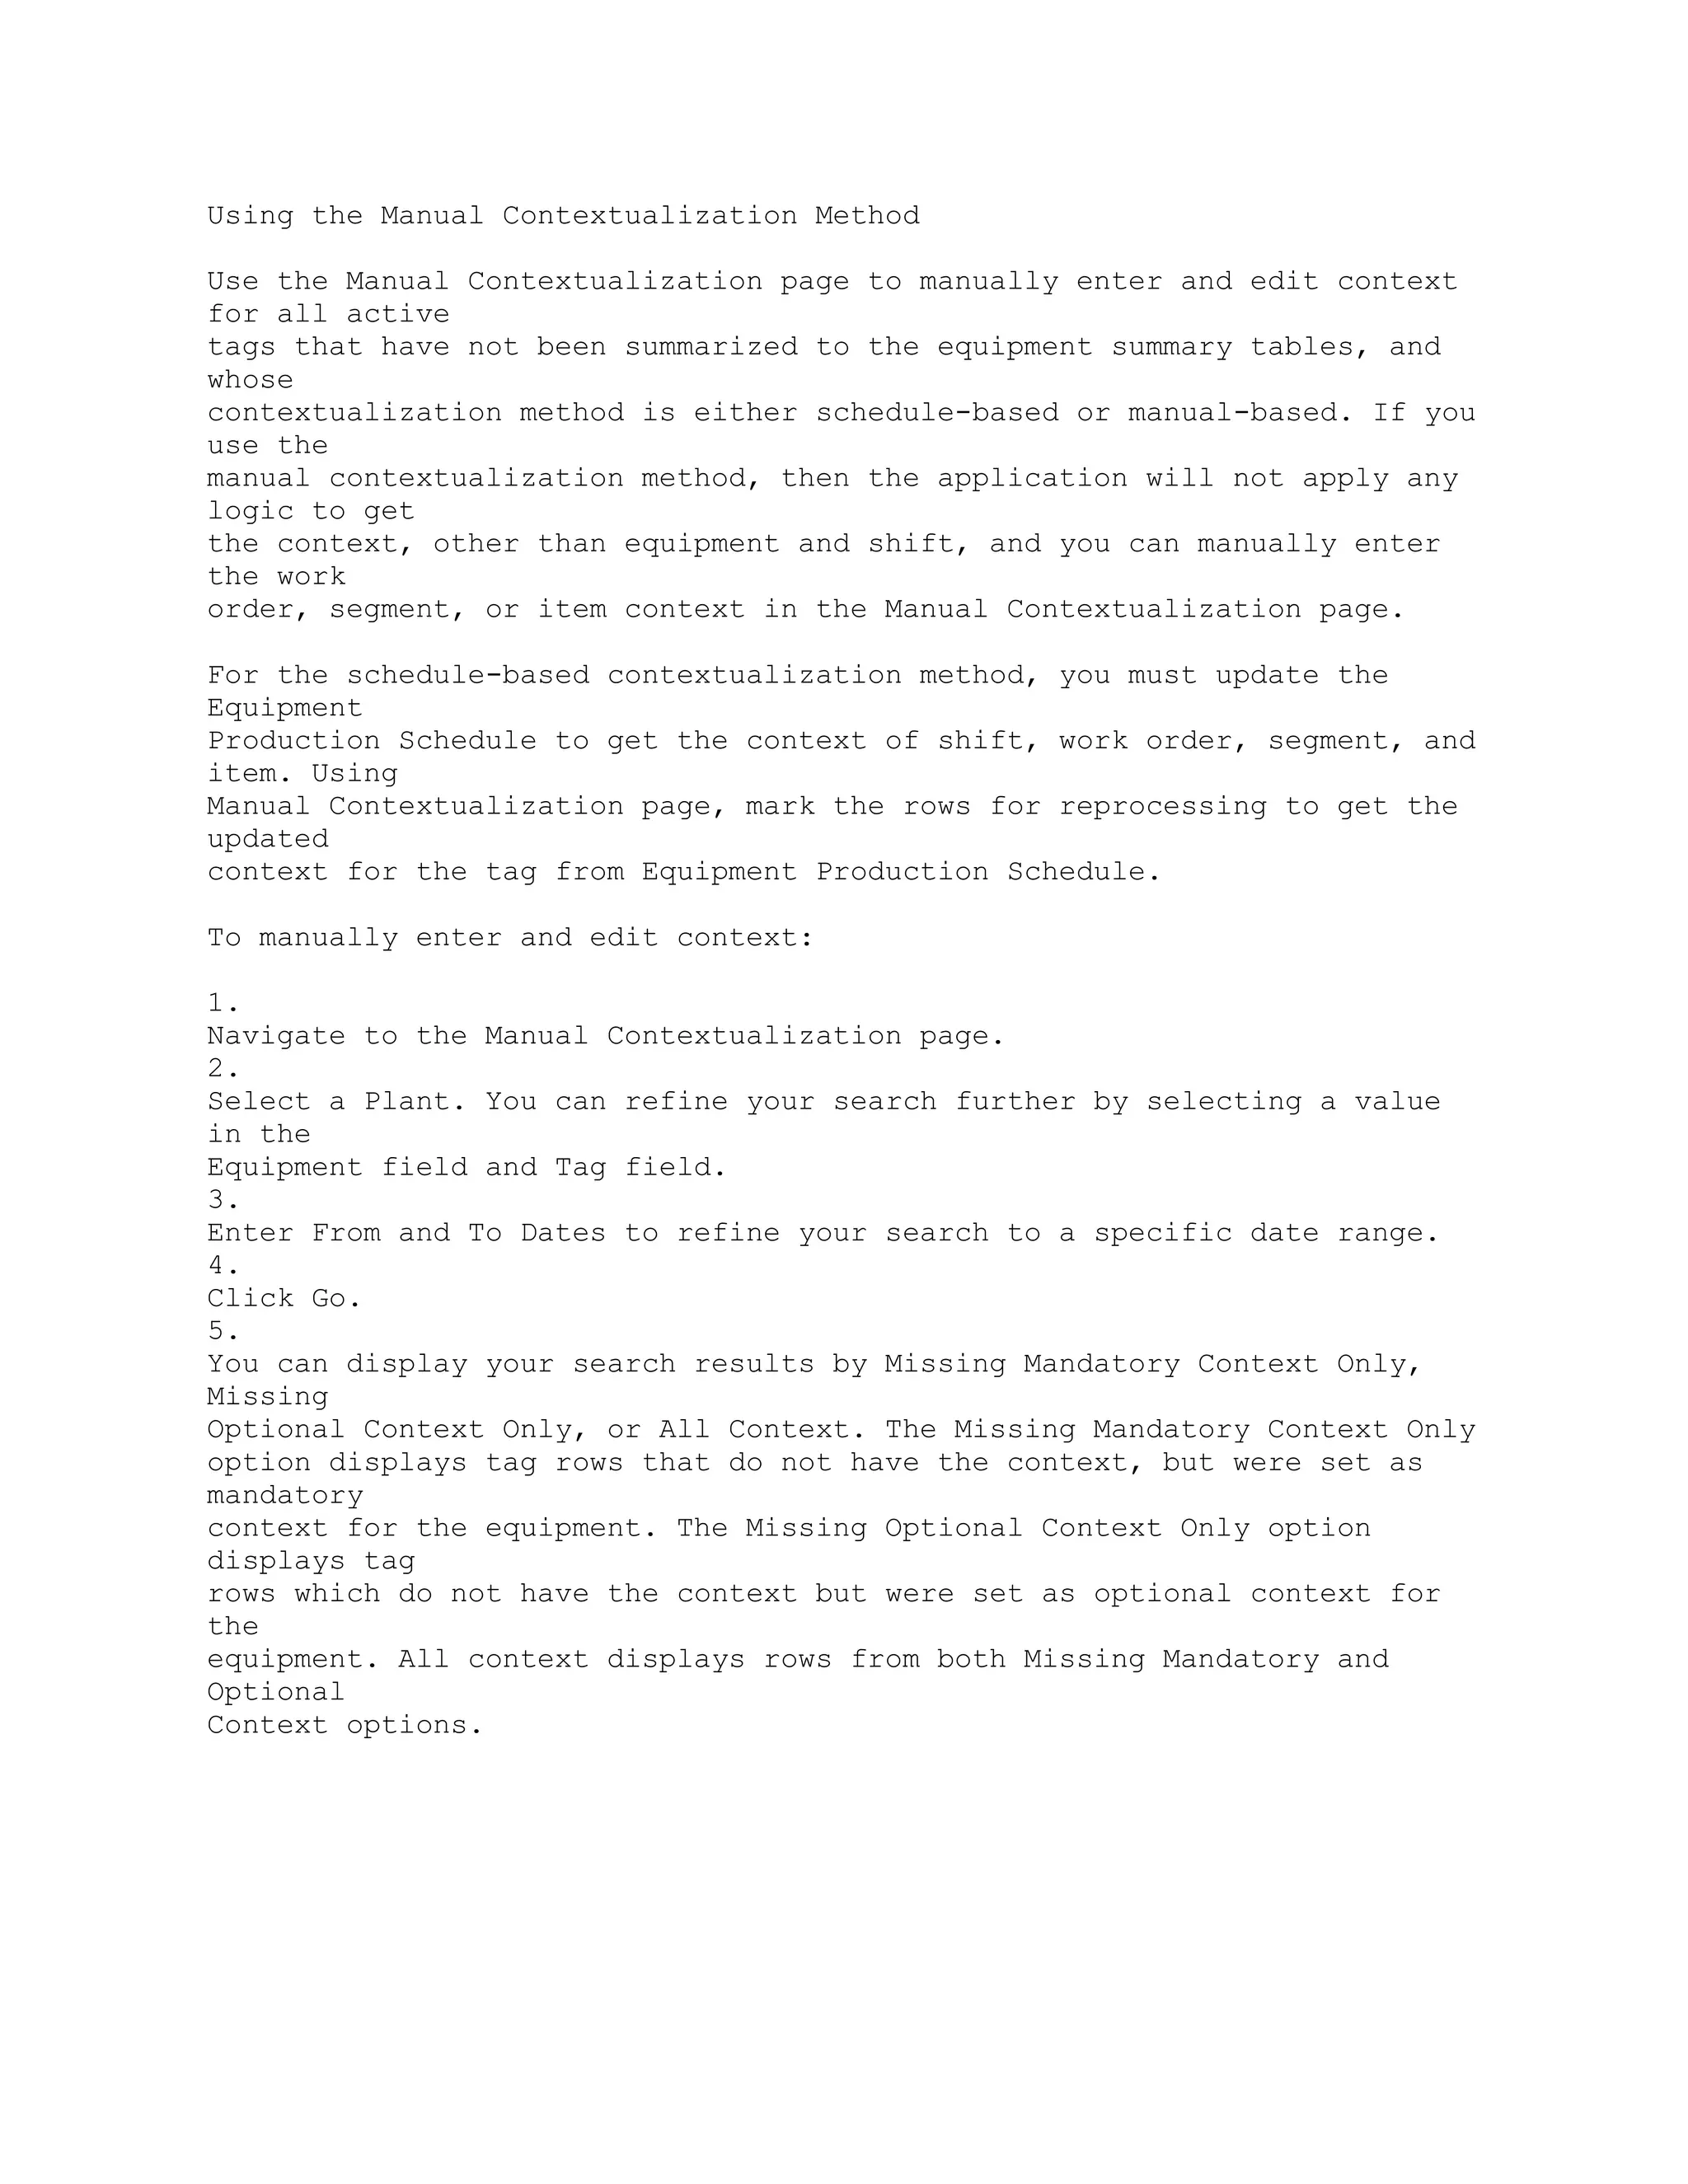
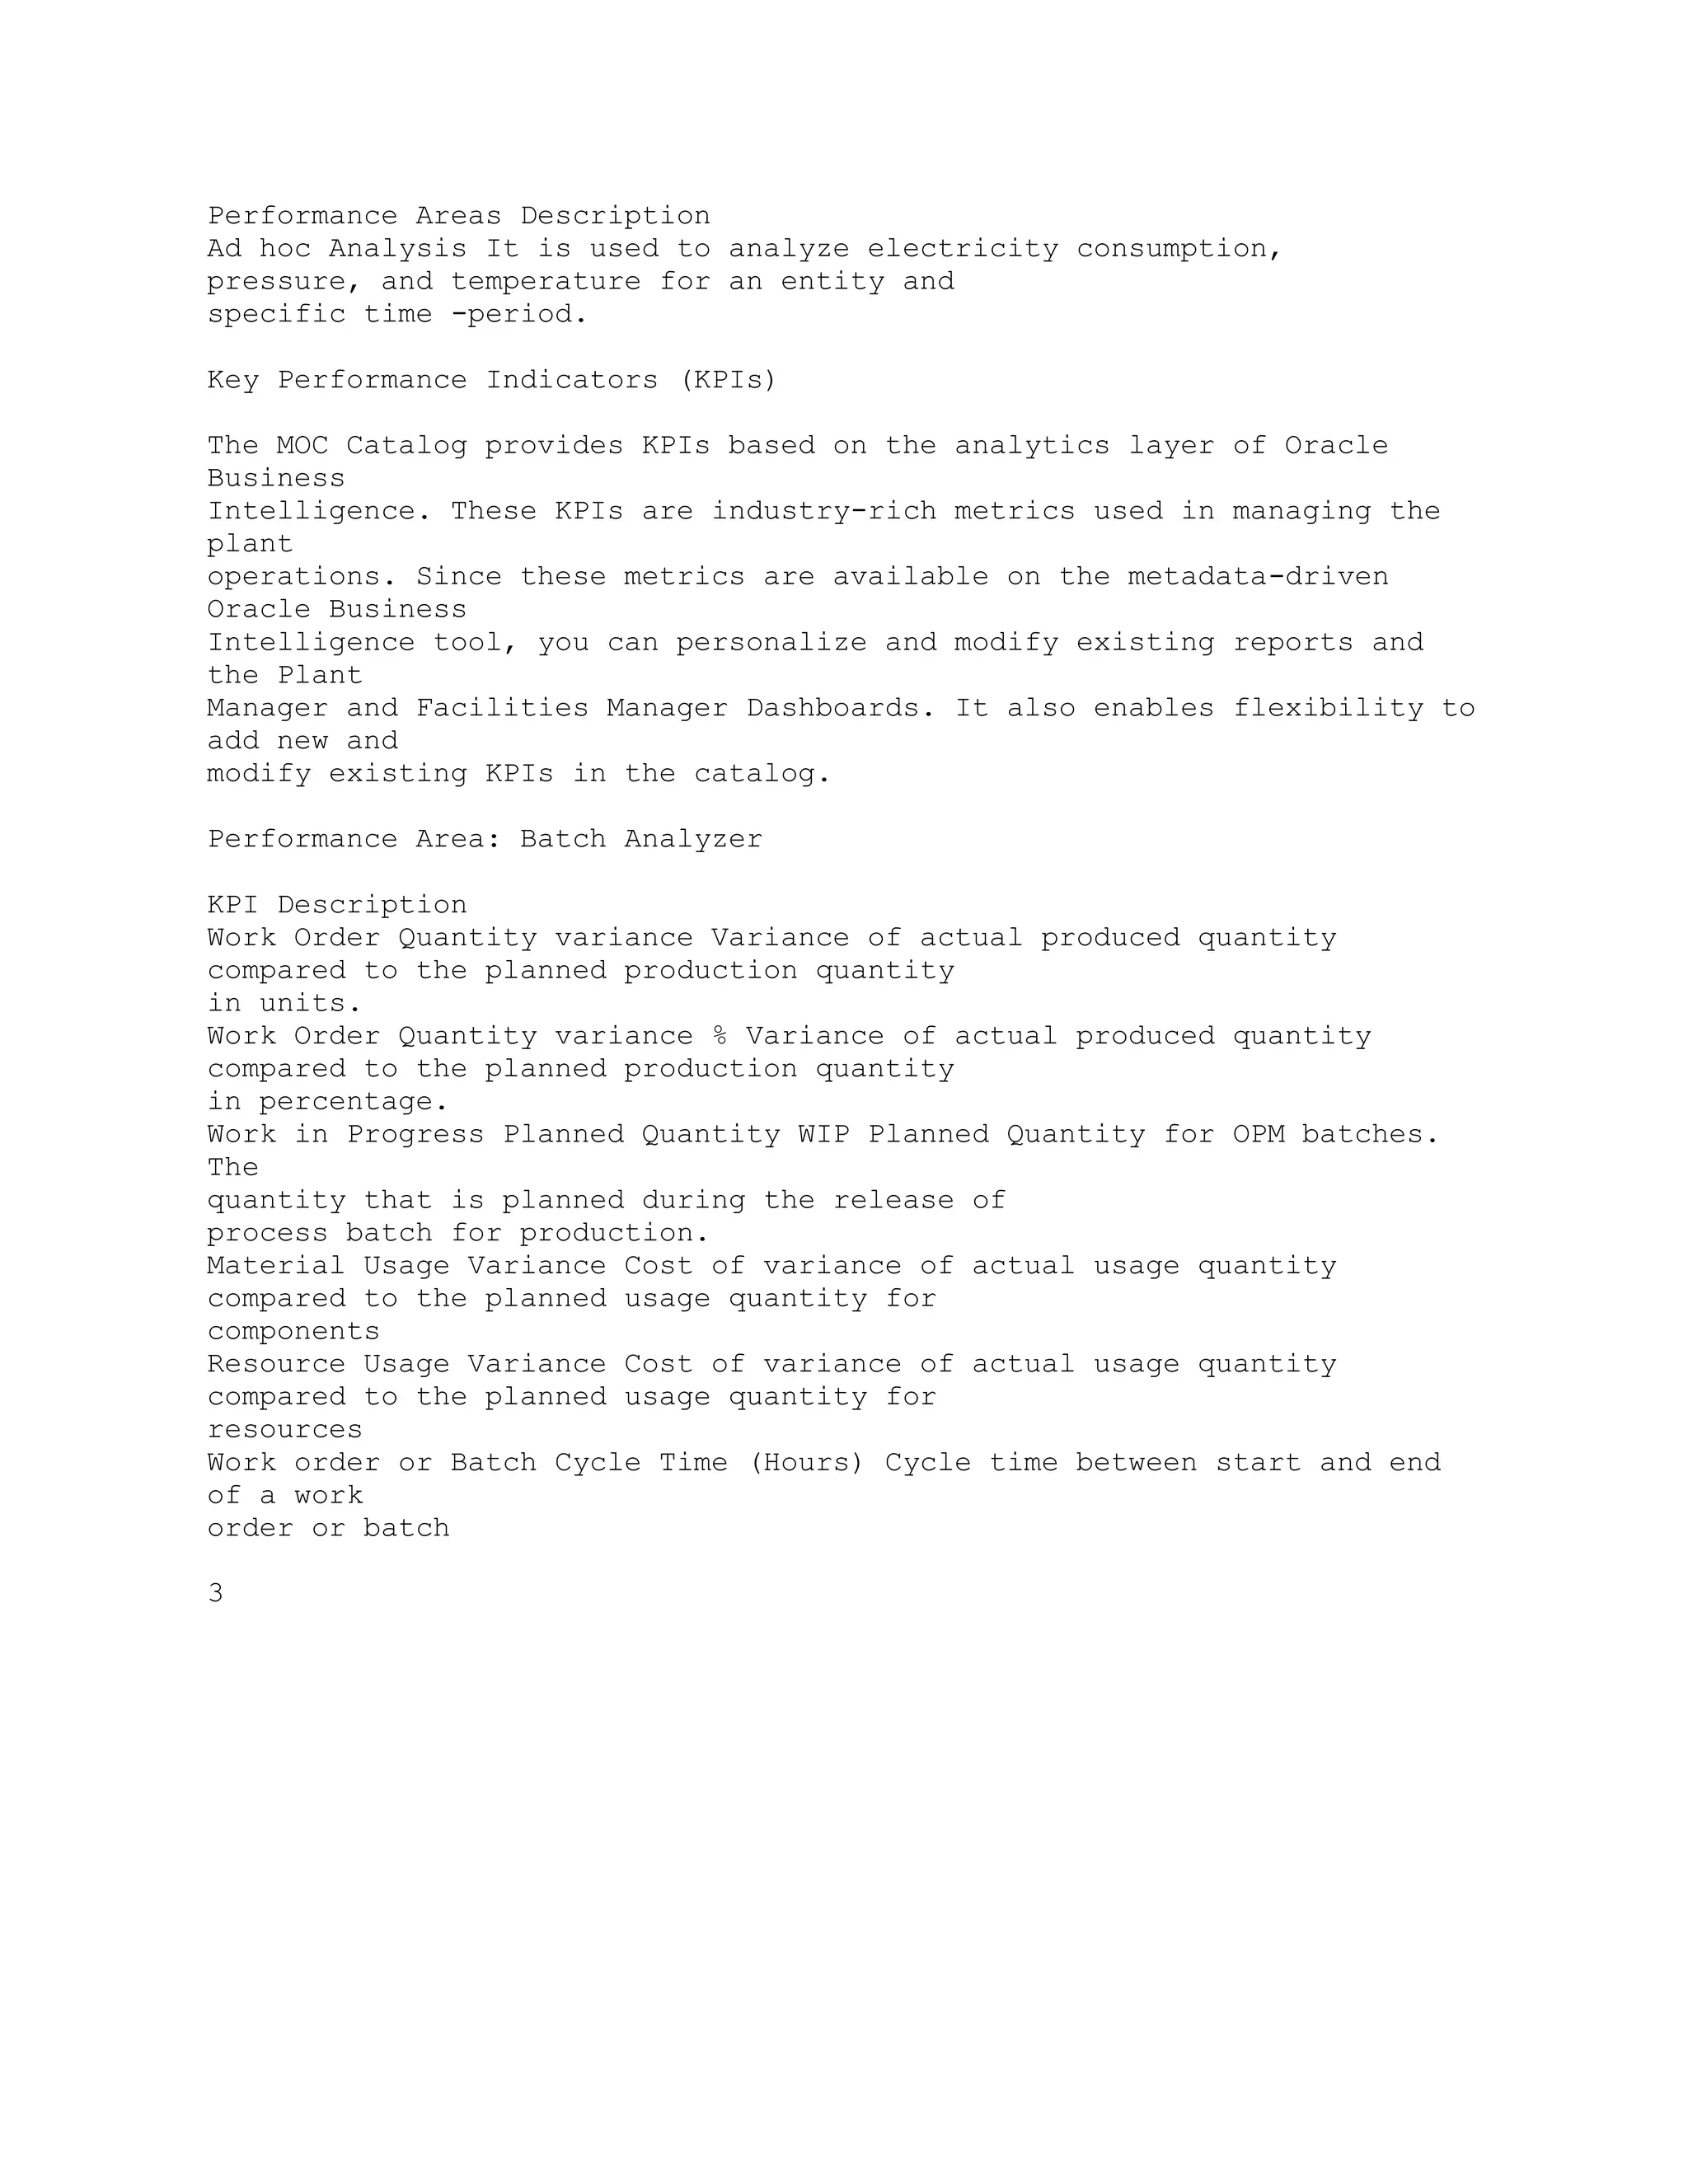
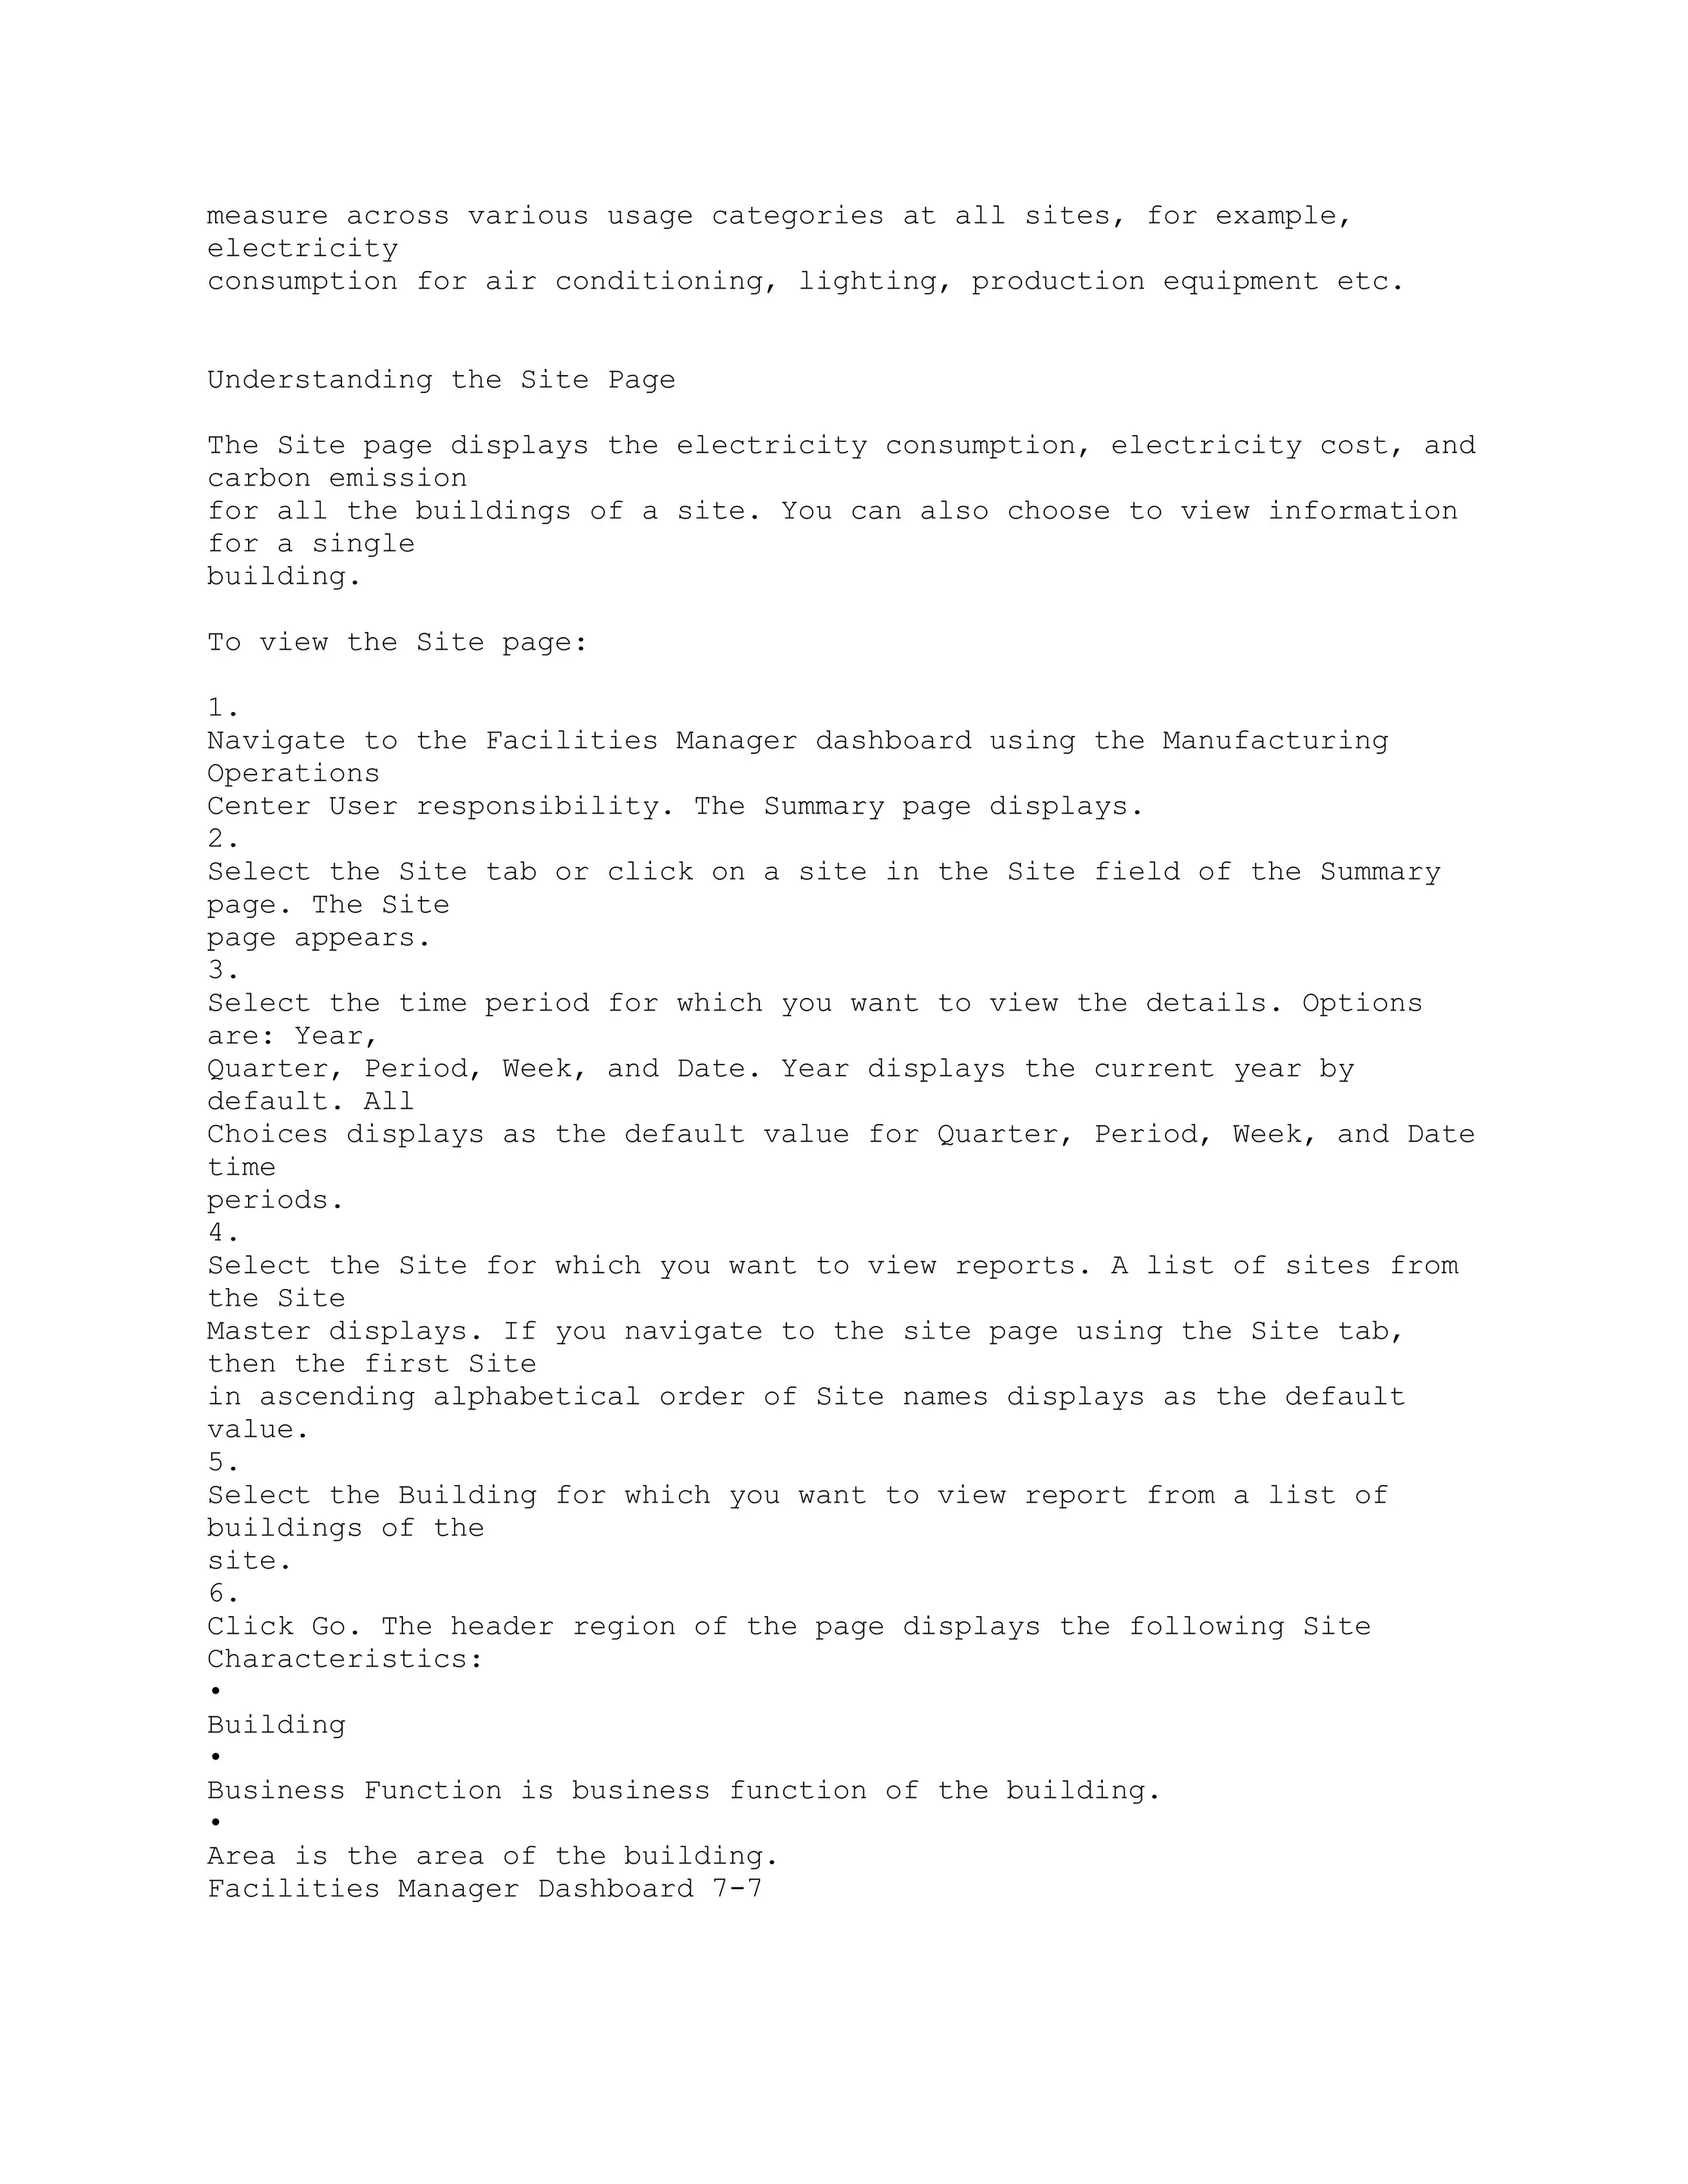
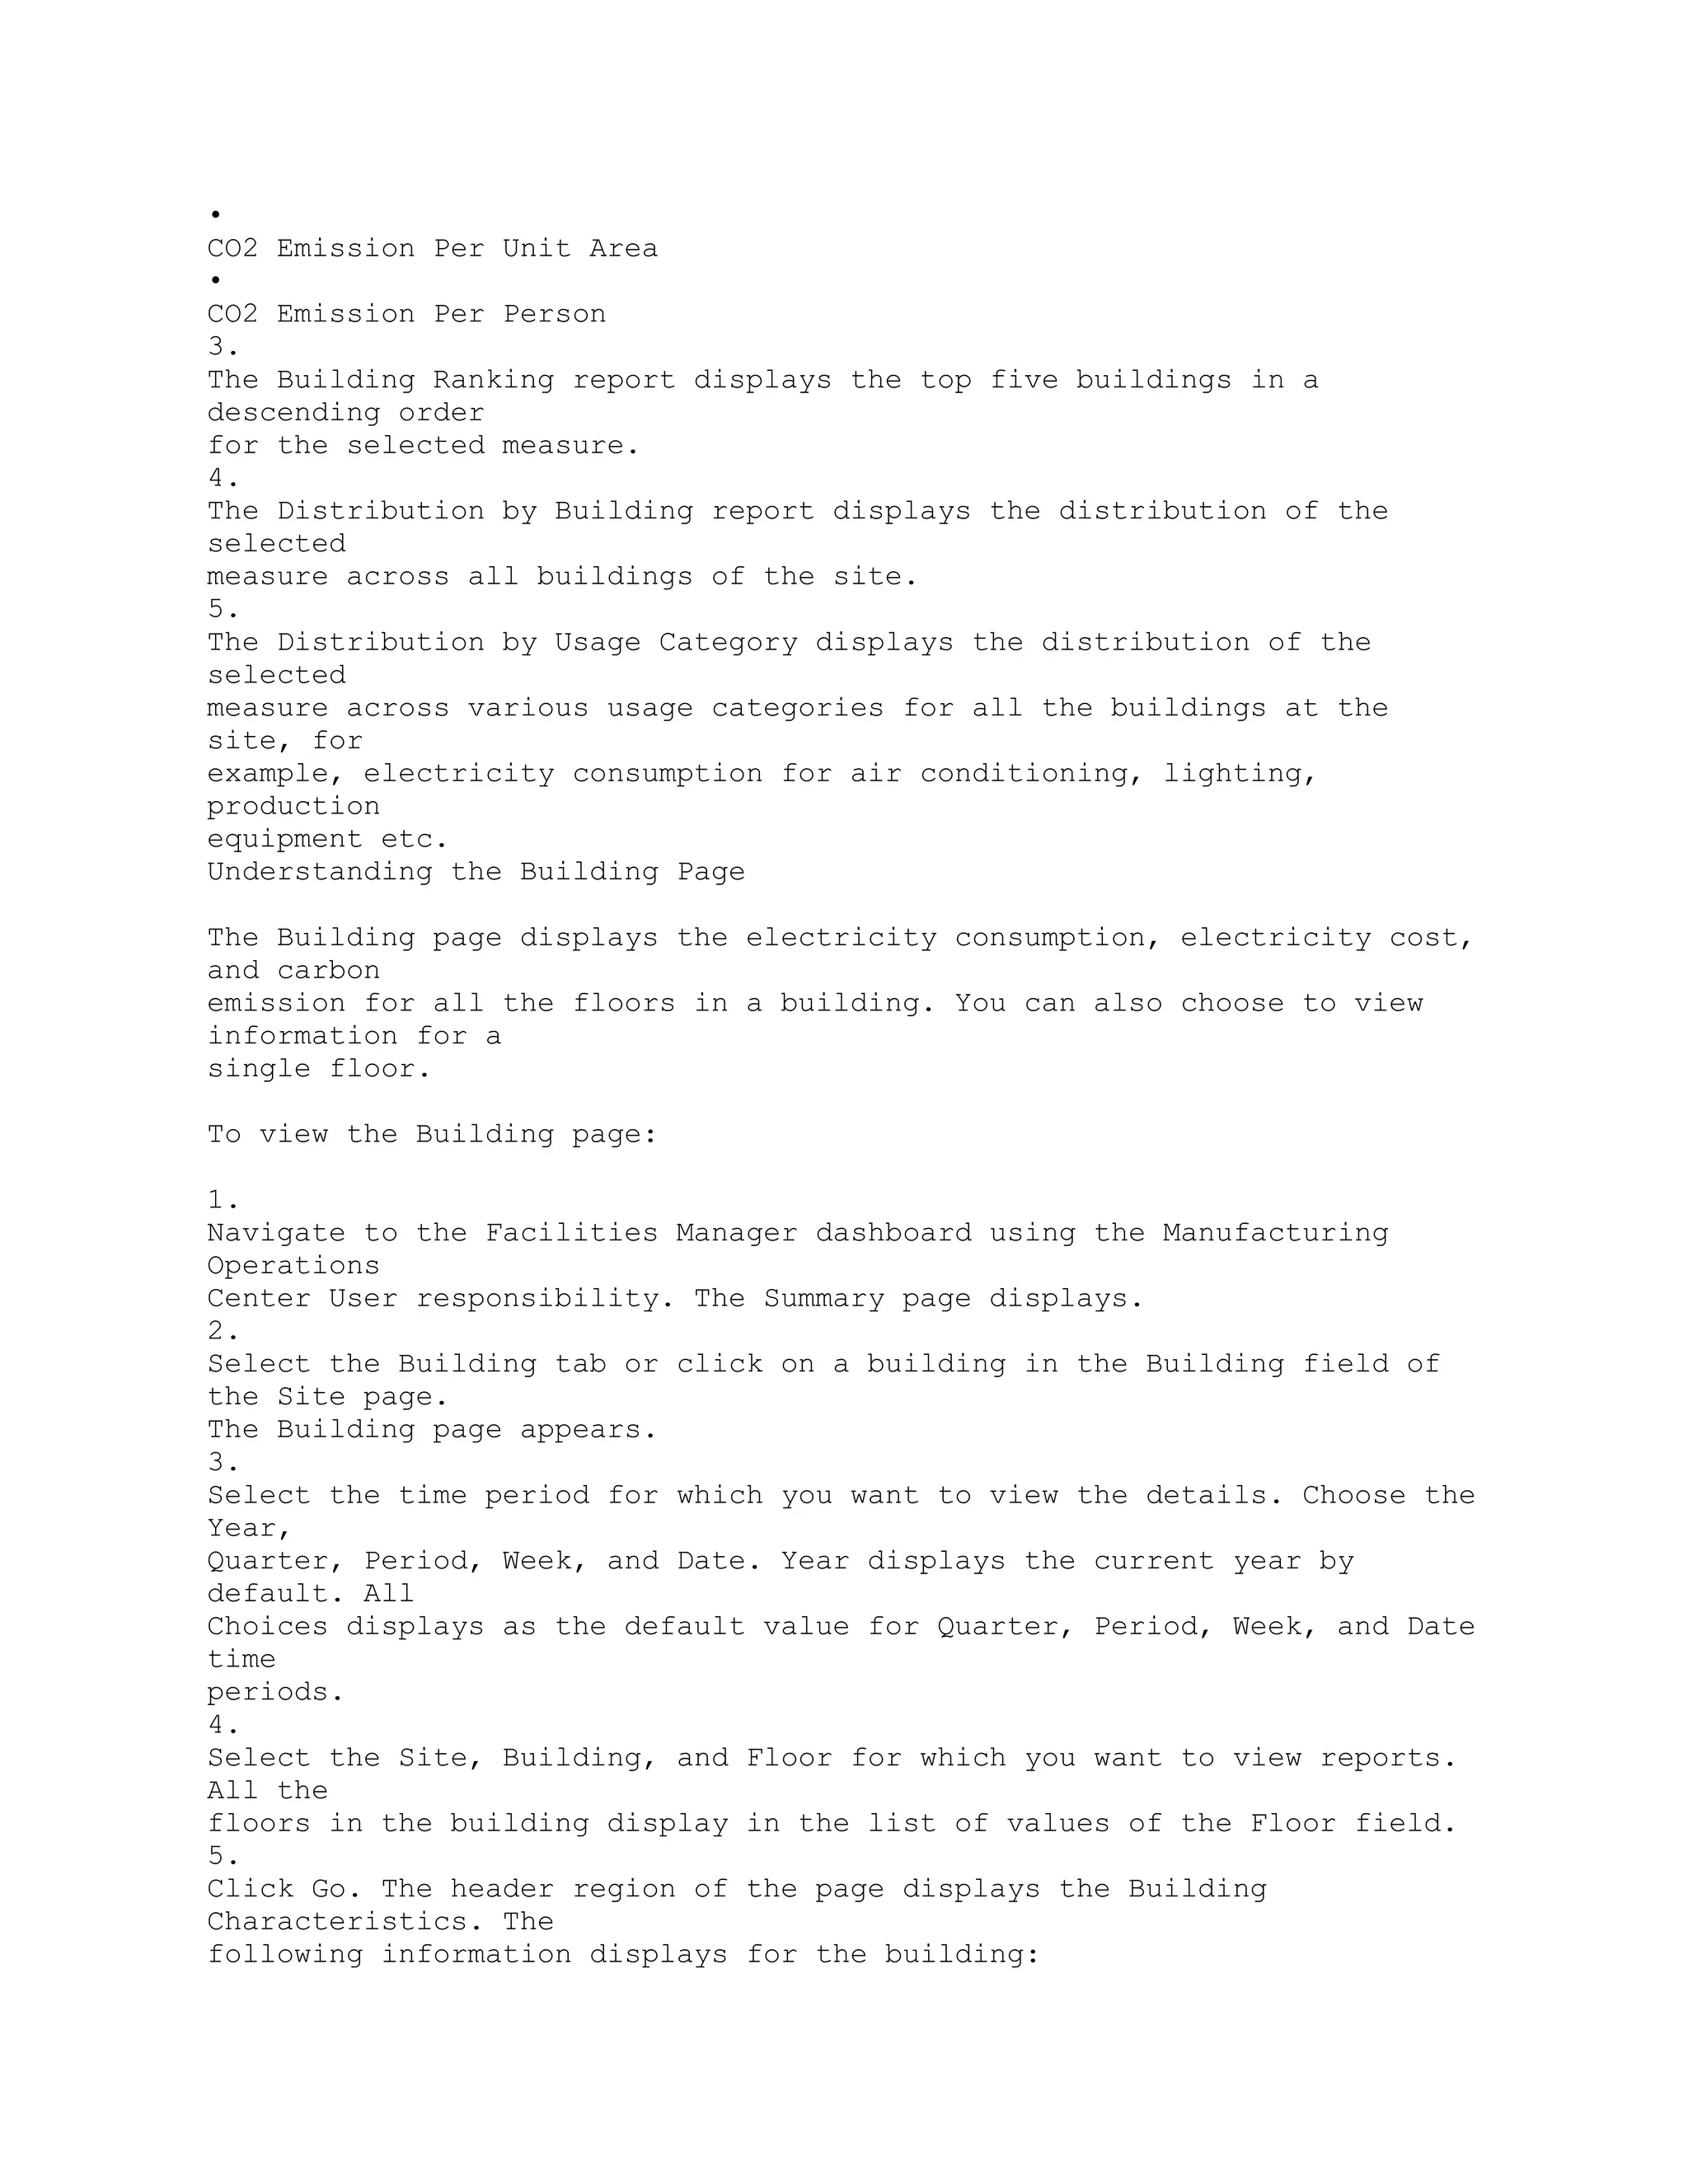
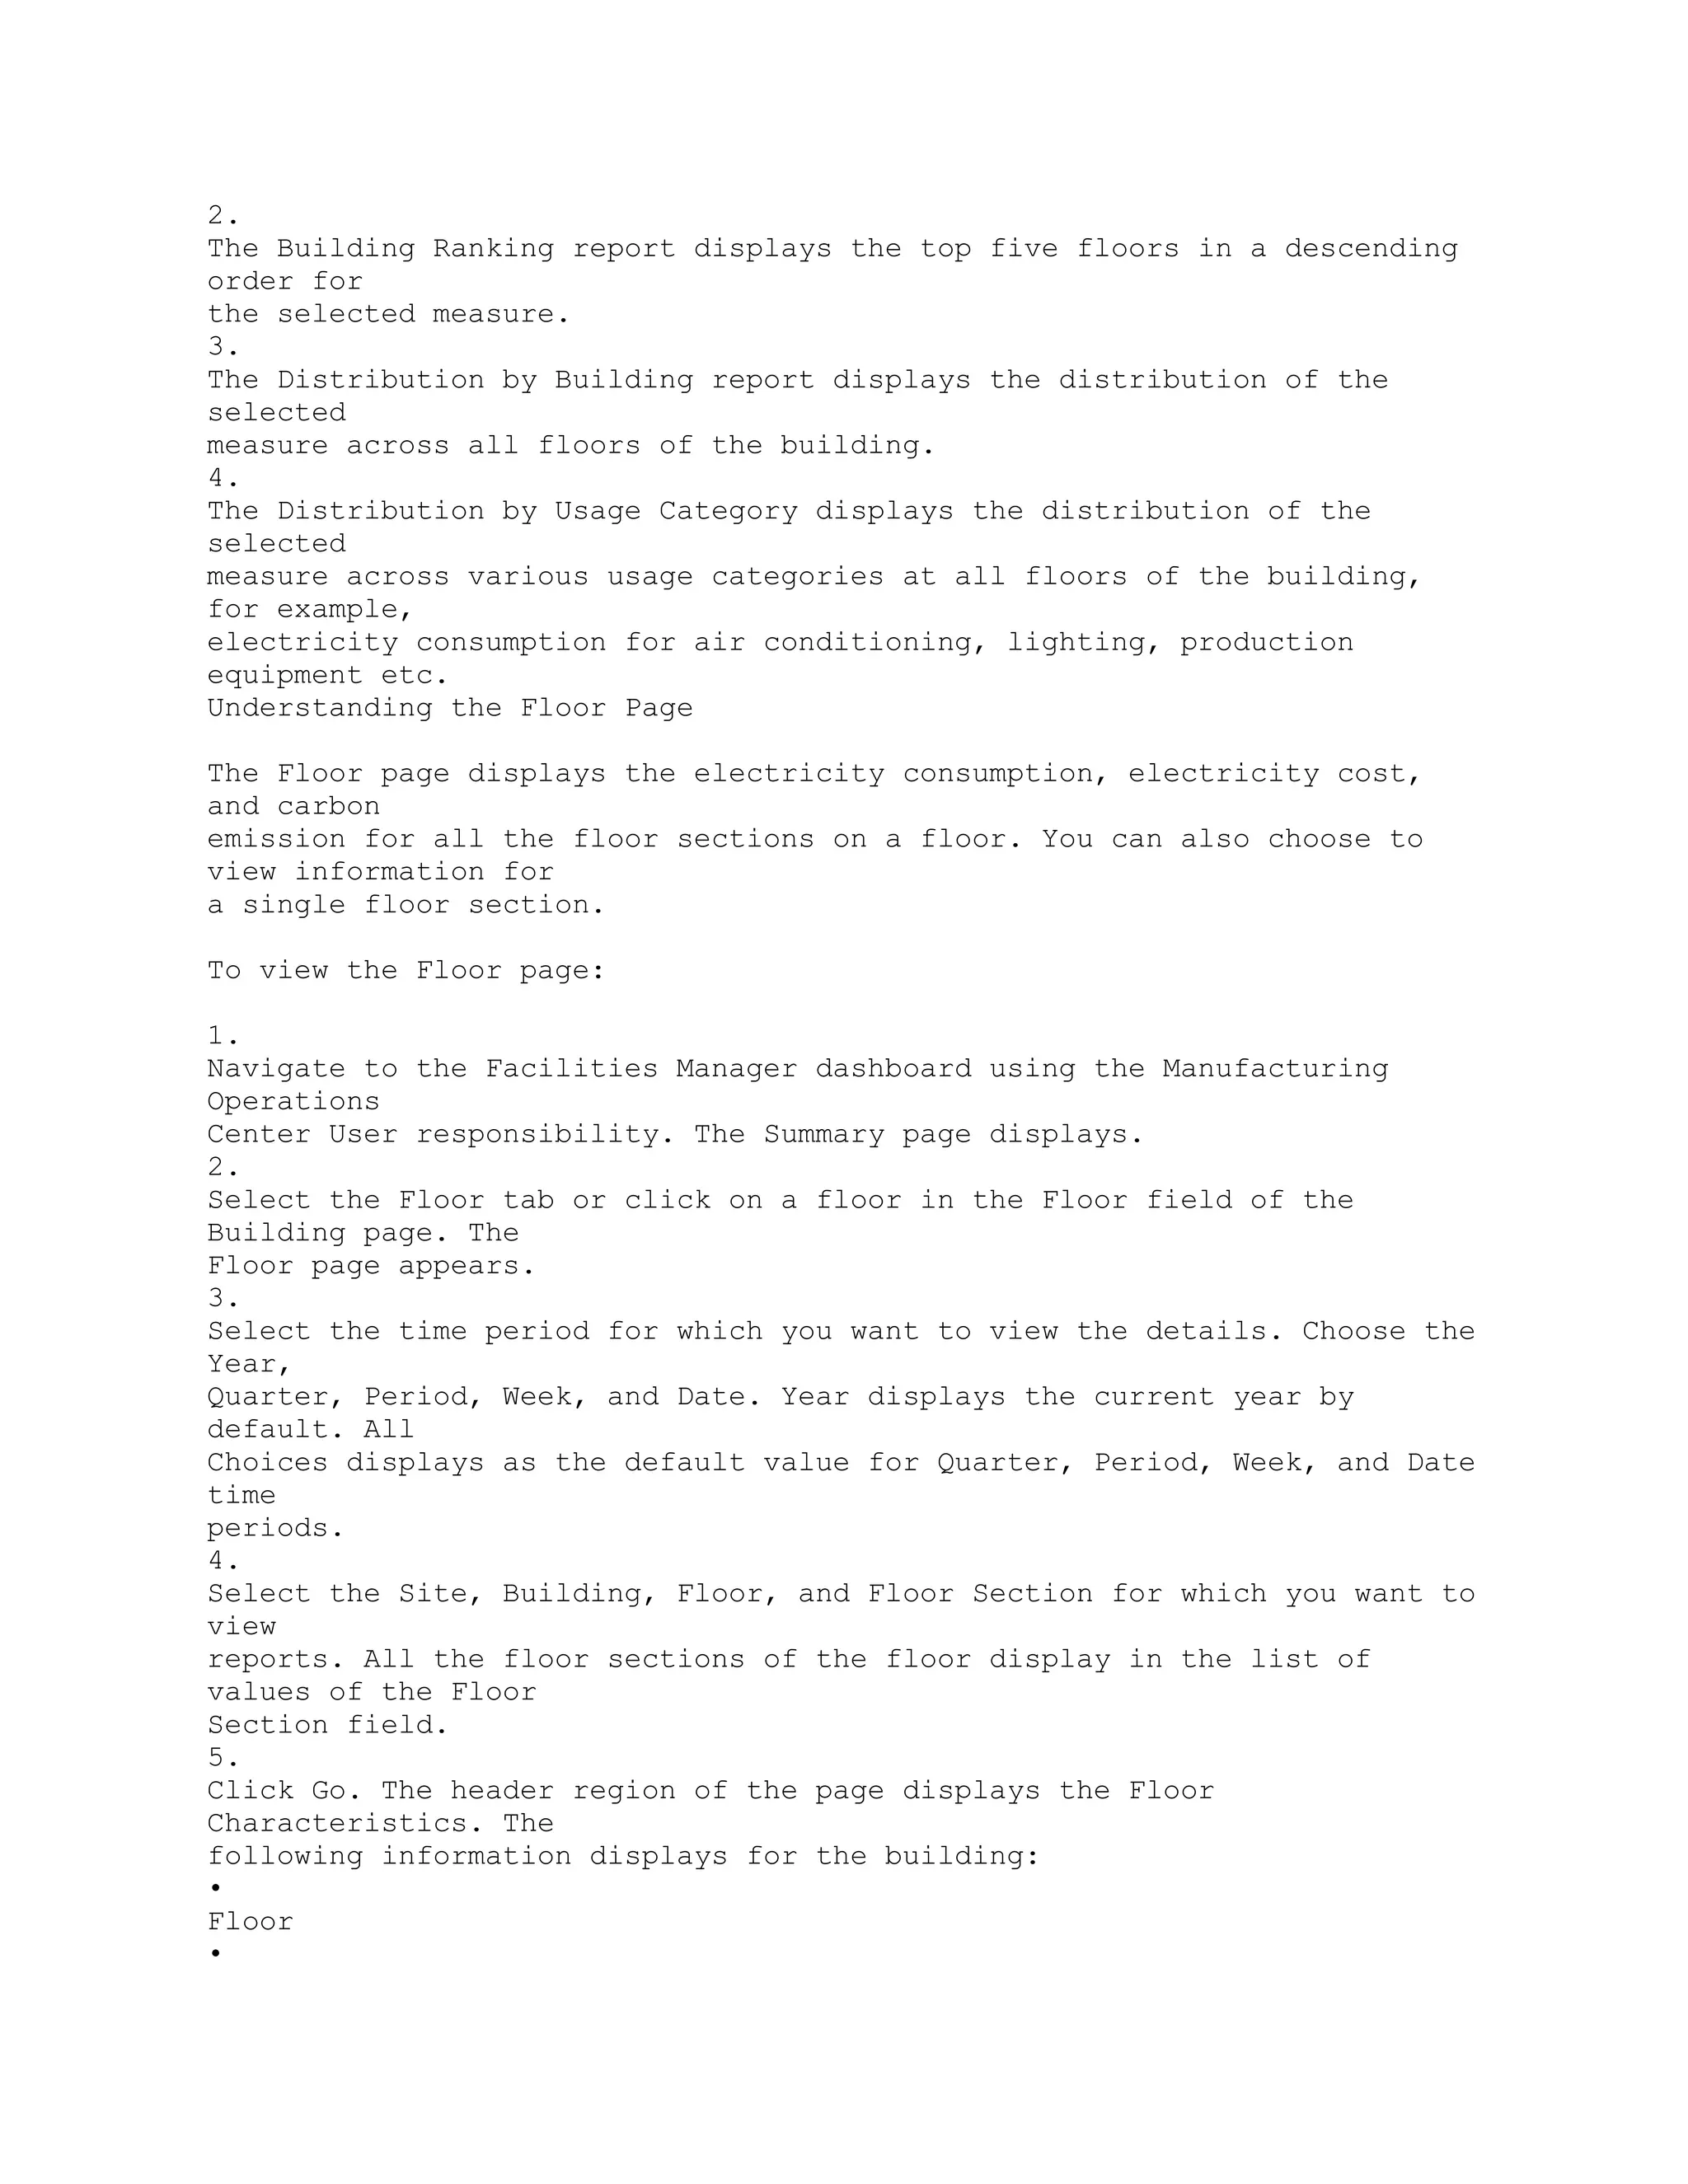
![Page Name Navigation Path
Batch Operation Pages MOC Administrator > Extensible Attributes
Workbench > Batch Operations > [select Entity
Name link] > Classifications tab [Page]
Batch Performance MOC User > Manufacturing Operations
Center Analytics > Plant Manager Dashboard
> [Batch Performance]
Batch Performance Detail MOC User > Manufacturing Operations
Center Analytics > Plant Manager Dashboard
> [Batch Performance] > Production Variance
by Product region > [select a Work Order
Quantity Variance Bar within bar graph]
Create Classification MOC Administrator > Extensible Attributes
Workbench > Others > [Create]
Downtime Reasons Entry MOC User > Tag Data Workbench >
Equipment Downtime Reasons > [select data
on Equipment Downtime Reason] > [select
records] > [Enter Downtime Reason]
Entity: Batch Operation MOC Administrator > Extensible Attributes
Workbench > Batch Operations
MOC User > Extensible Attributes Data >
Batch Operations
Entity: Batch Operation Classifications MOC Administrator > Extensible
Attributes
Workbench > Batch Operations > Entity: Batch
Operation > [select Entity Name link]
Entity: Equipment MOC Administrator > Extensible Attributes
Workbench > Equipment
MOC User > Extensible Attributes Data >
Equipment
Entity: Equipment Classifications MOC Administrator > Extensible
Attributes
Workbench > Equipment > Entity: Equipment
> [select Entity Name link]
A-4](https://image.slidesharecdn.com/12-1-man-operationcenter-ug2-150223055255-conversion-gate02/75/12-1-man-operation-center-ug-2-164-2048.jpg)
![Page Name Navigation Path
Entity: Item MOC Administrator > Extensible Attributes
Workbench > Items
MOC User > Extensible Attributes Data >
Items
Entity: Item Classifications MOC Administrator > Extensible Attributes
Workbench > Items > Entity: Item > [select
Entity Name link]
Entity: Others MOC Administrator > Extensible Attributes
Workbench > Others
MOC User > Extensible Attributes Data >
Others
Entity: Others Classifications MOC Administrator > Extensible Attributes
Workbench > Others > Entity: Others > [select
Entity Name link]
Entity: Work Order MOC Administrator > Extensible Attributes
Workbench > Work Orders
MOC User > Extensible Attributes Data >
Work Orders
Entity: Work Order Classifications MOC Administrator > Extensible
Attributes
Workbench > Work Orders > Entity: Work
Order > [select Entity Name link]
Equipment Contextualization Setup MOC Administrator > Setup >
Contextualization Setup
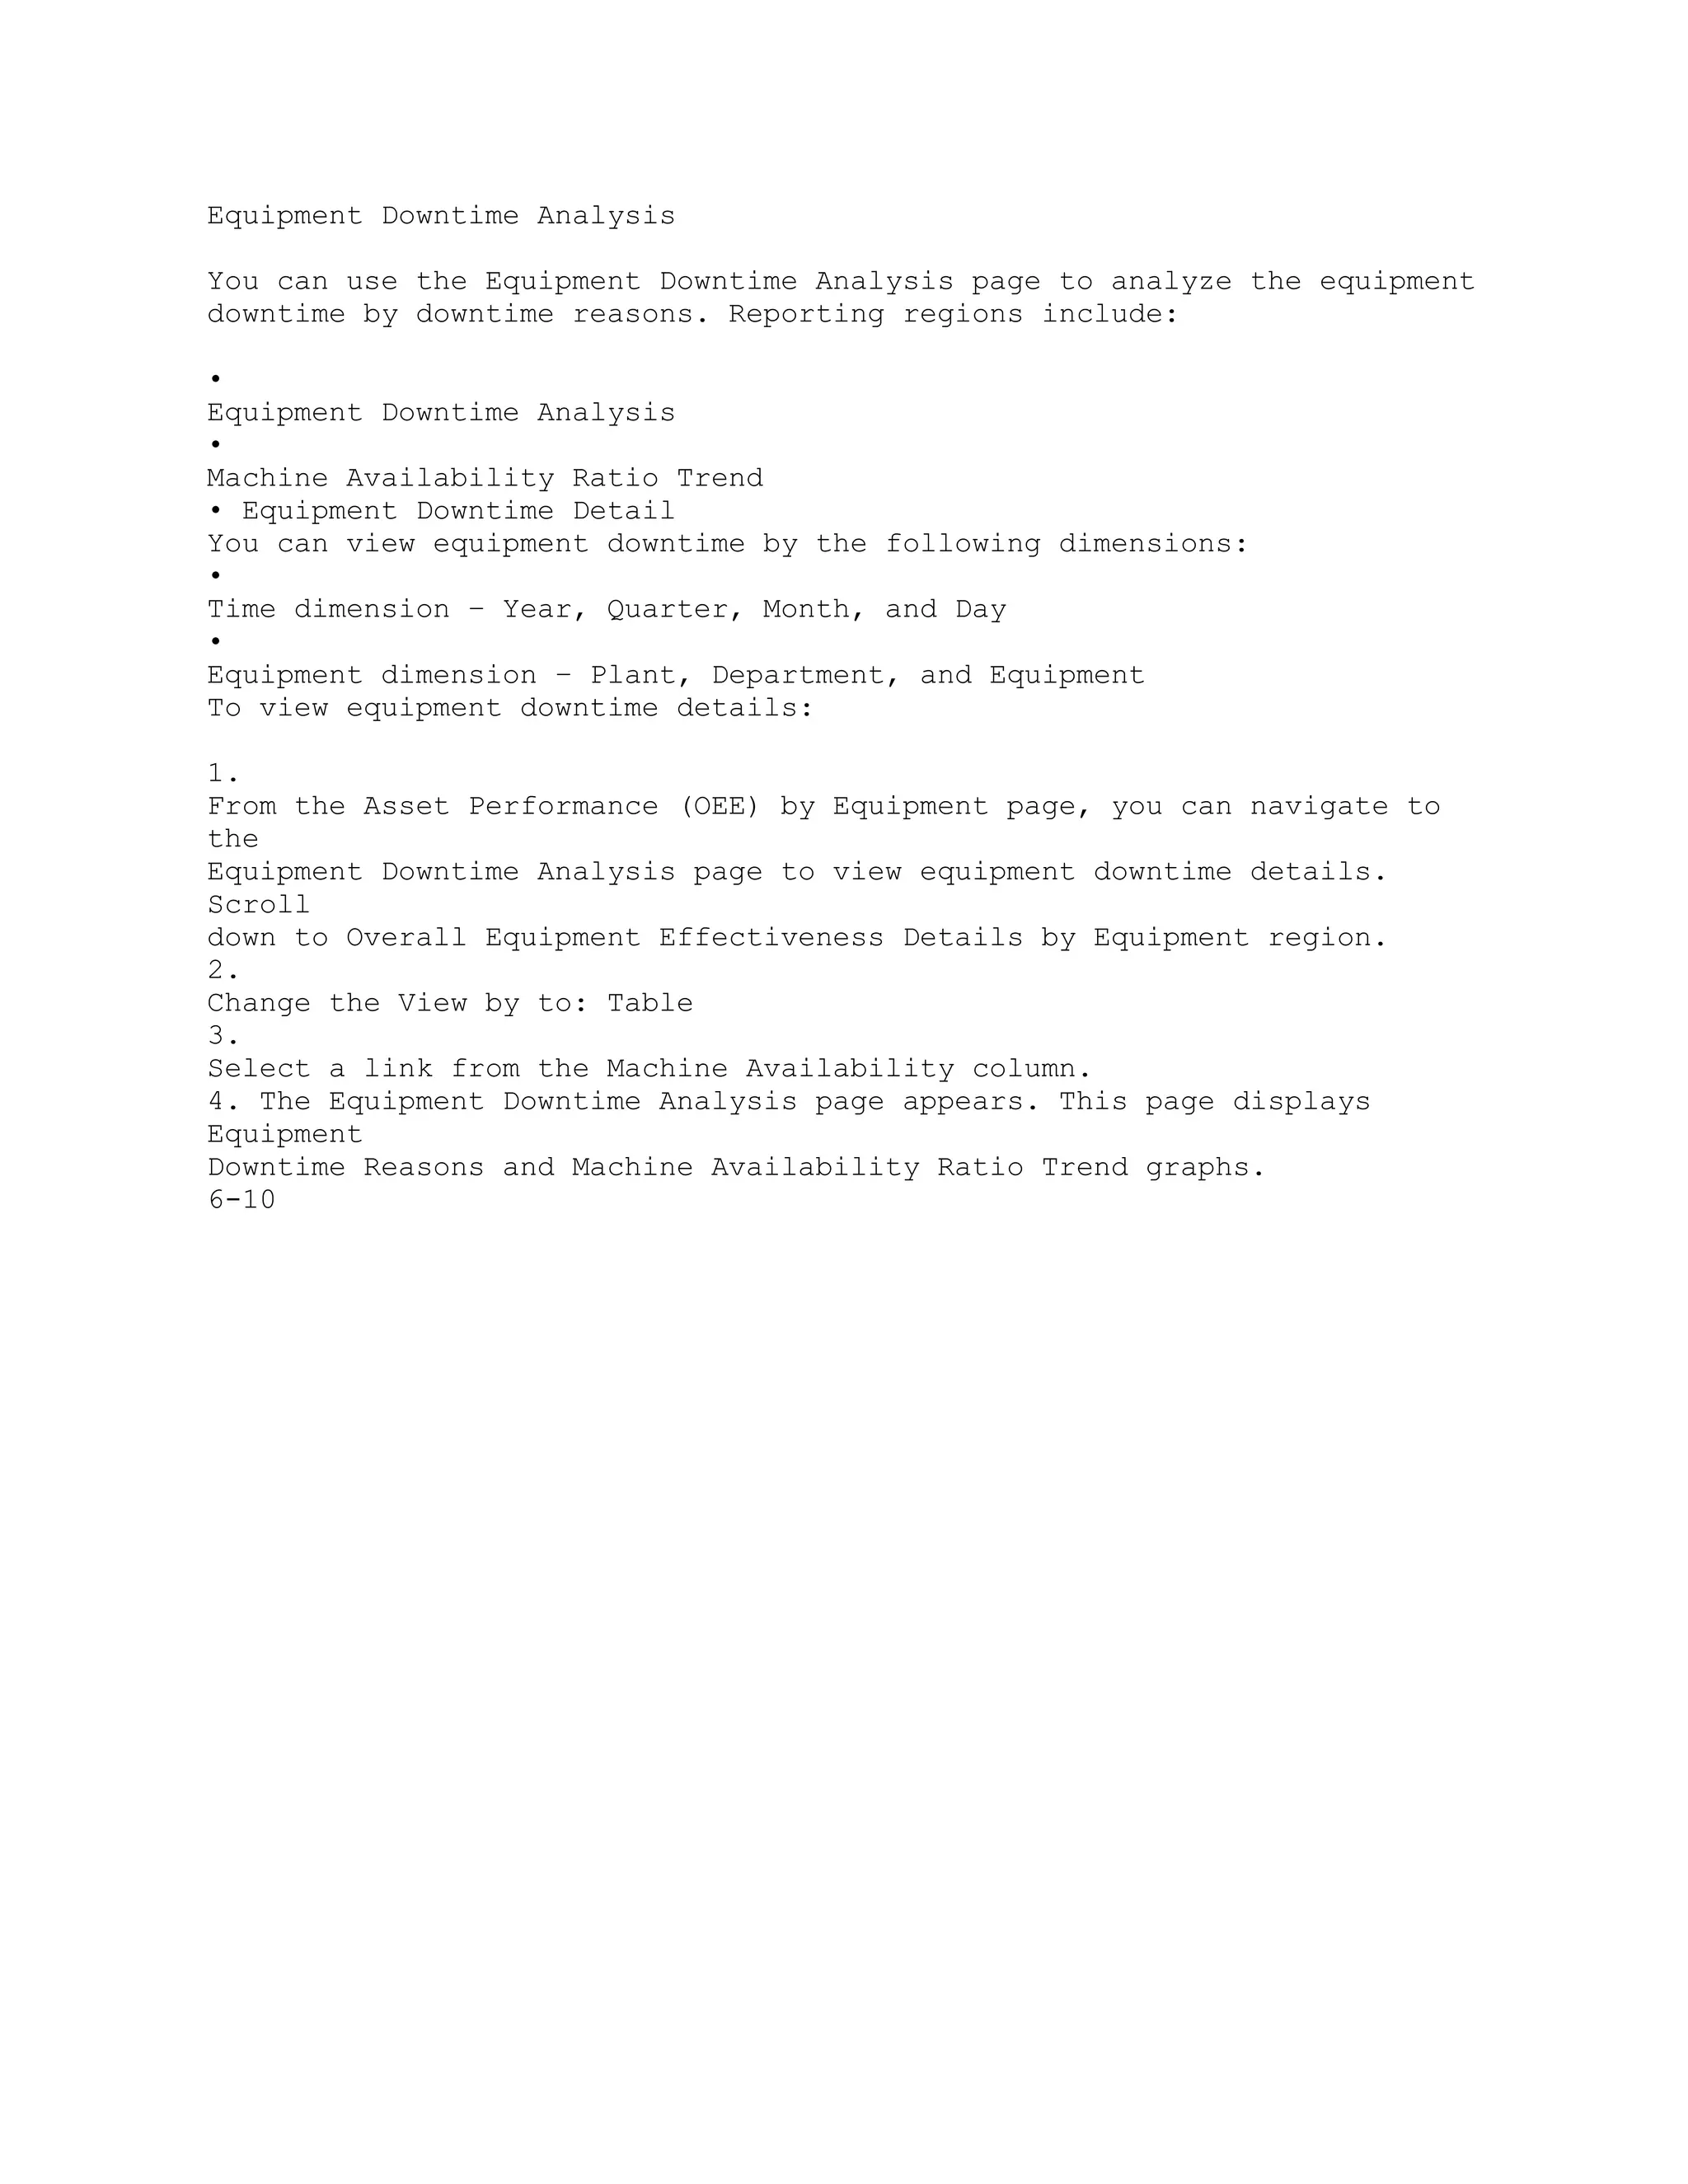
Equipment Downtime Analysis MOC User > Manufacturing Operations
Center Analytics > Plant Manager Dashboard
> [select a Bottom Performers Equipment
Gauge] > [Overall Equipment Effectiveness
Details Region] > [select a Machine
Availability Value]
5](https://image.slidesharecdn.com/12-1-man-operationcenter-ug2-150223055255-conversion-gate02/75/12-1-man-operation-center-ug-2-165-2048.jpg)
![Page Name Navigation Path
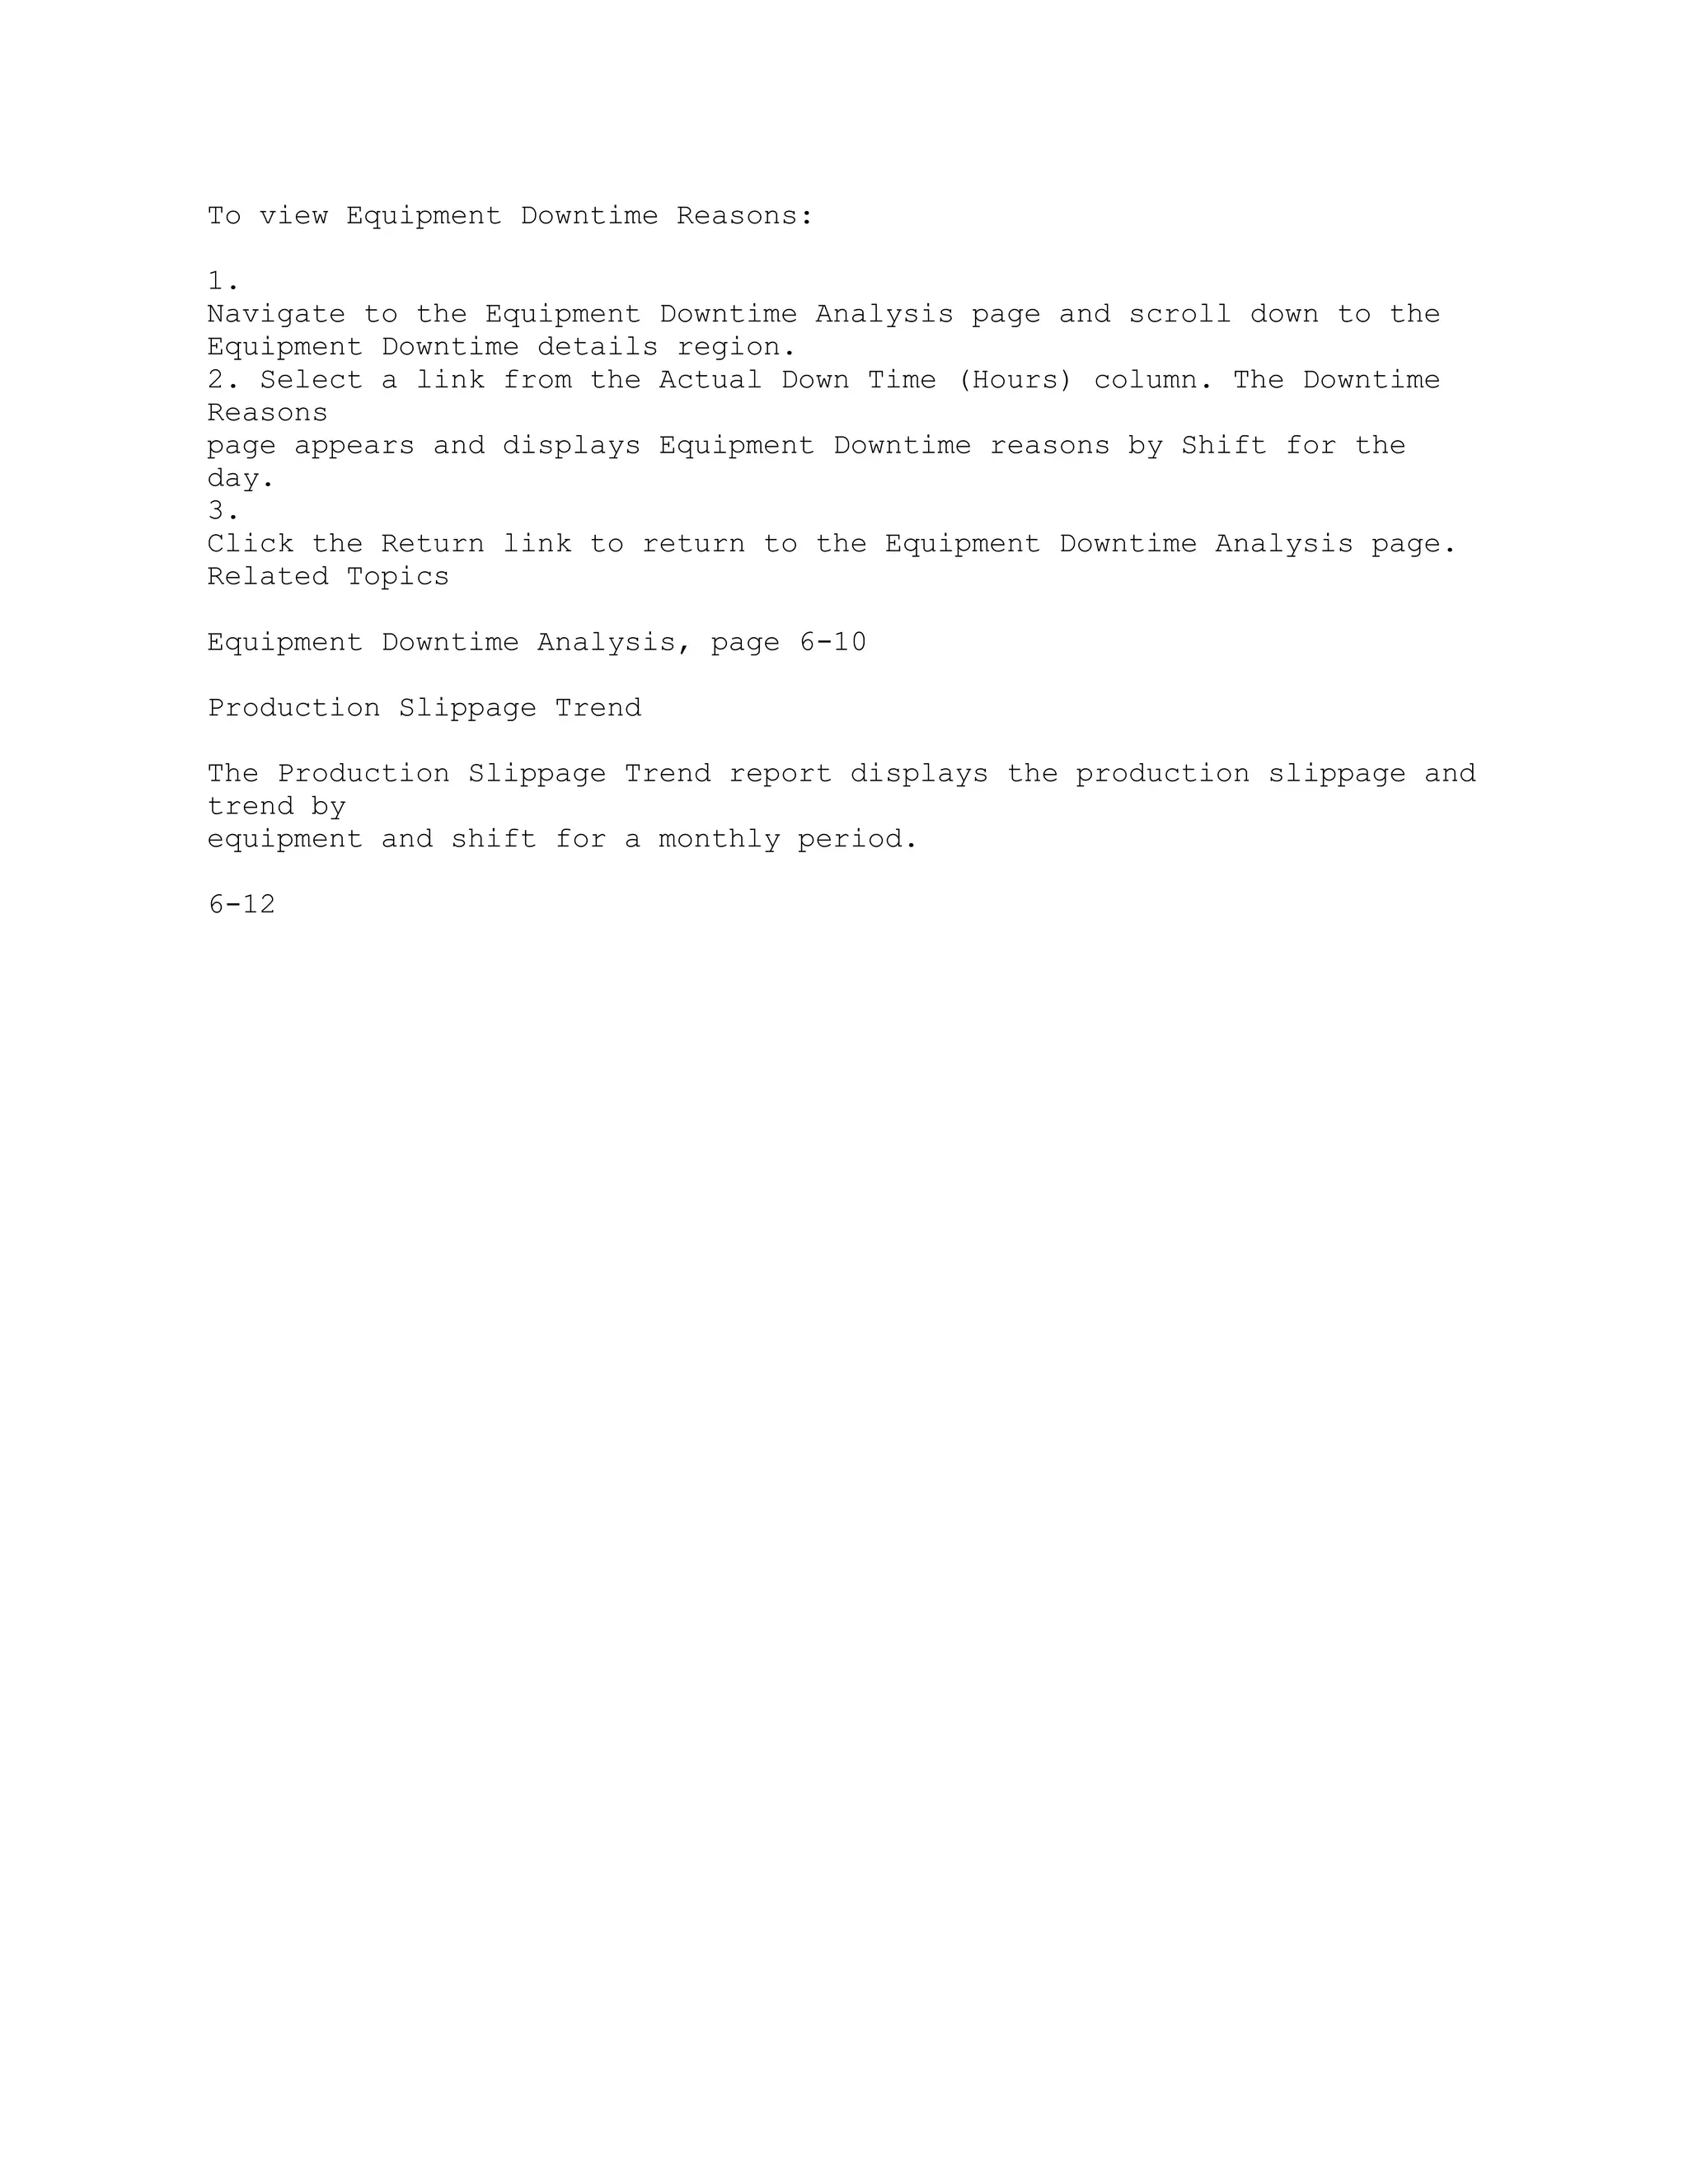
Equipment Downtime Reasons MOC User > Manufacturing Operations
Center Analytics > Plant Manager Dashboard
> [select a Bottom Performers Equipment
Gauge] > Overall Equipment Effectiveness
Details Region > [select Machine Availability
Value] > [select Actual Downtime Hours
value]
Equipment Downtime Reason MOC User > Tag Data Workbench >
Equipment Downtime Reasons
Equipment Downtime Reasons Entry MOC User > Tag Data Workbench >
Equipment Downtime Reasons > [Enter
Downtime Reason]
Equipment Downtime Reasons [View] MOC User > Tag Data Workbench >
Equipment Downtime Reasons > [select data
on Equipment Downtime Reason] > [select
records] > [View Reason]
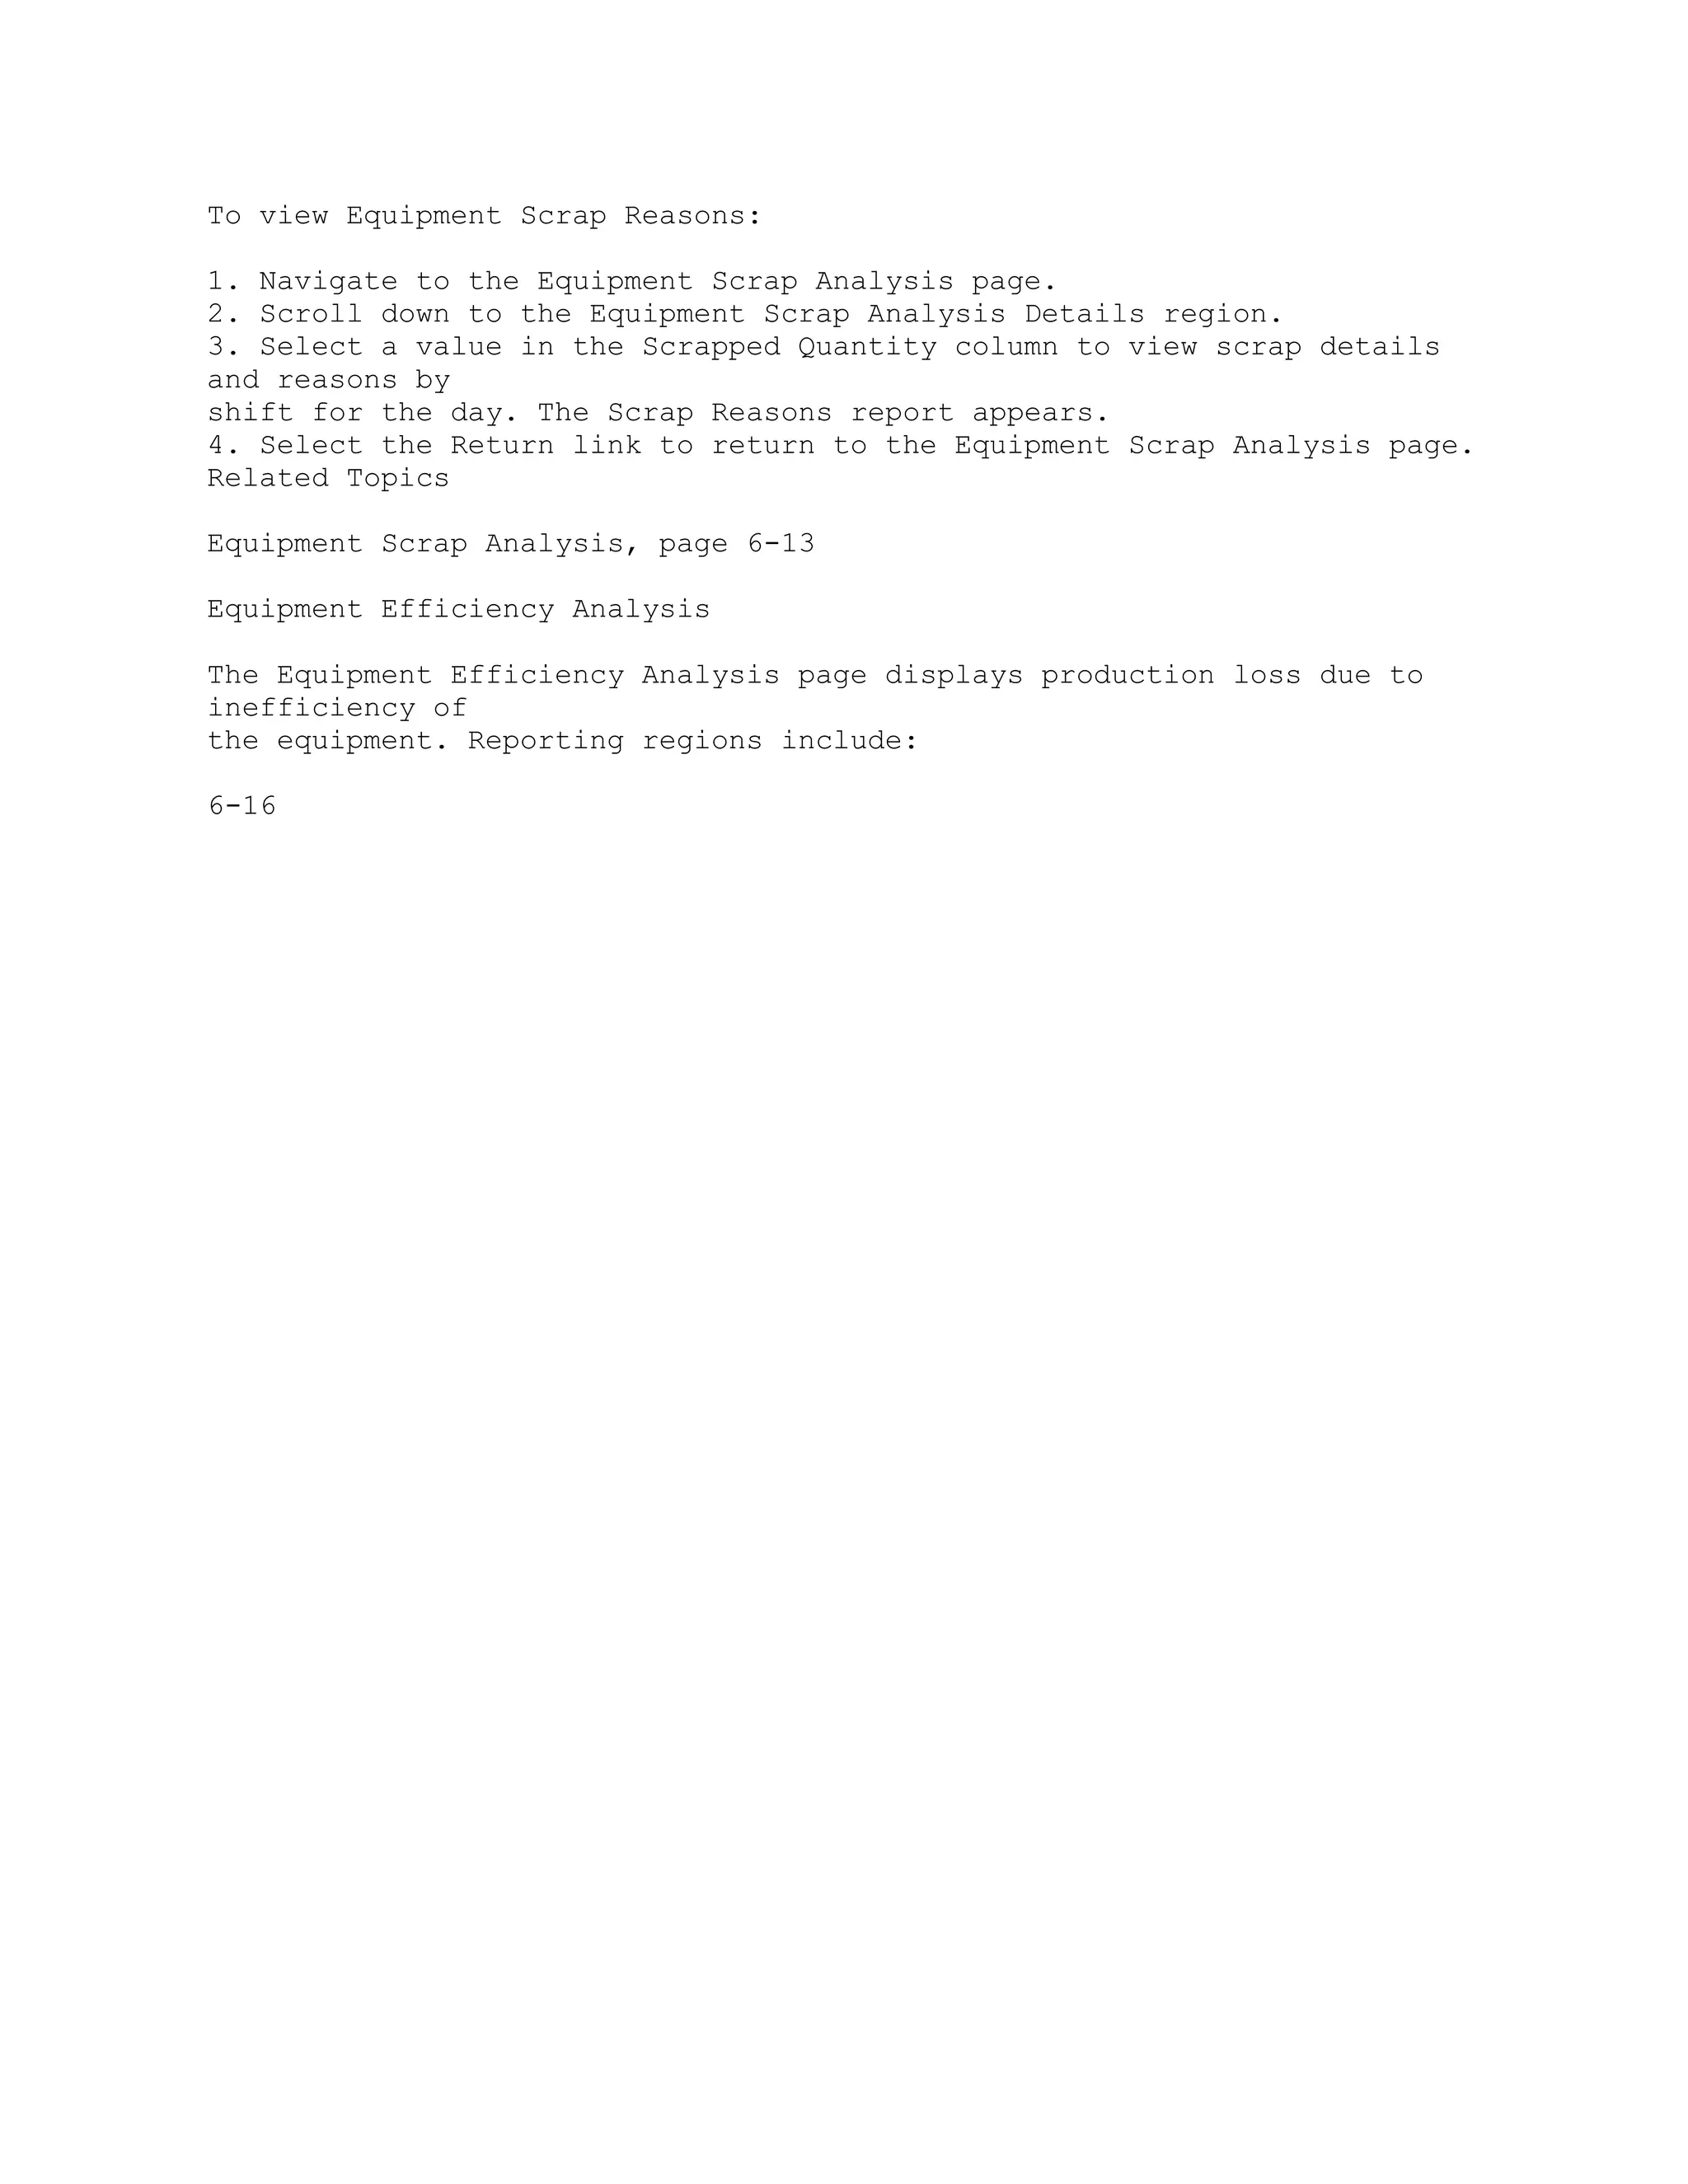
Equipment Efficiency Analysis MOC User > Manufacturing Operations
Center Analytics > Plant Manager Dashboard
> [select a Bottom Performers Equipment
Gauge] > [Overall Equipment Effectiveness
Details Region] > [select a Machine
Performance Value]
Equipment Efficiency Detail MOC User > Manufacturing Operations
Center Analytics > Plant Manager Dashboard
> [select a Bottom Performers Equipment
Gauge] > [Overall Equipment Effectiveness
Details Region] > [select a Machine
Performance Value] > [select a Machine
Efficiency value]
Equipment Overview MOC User > Extensible Attributes Data >
Equipment > Entity: Equipment [select Entity
Name link]
Equipment Pages MOC Administrator > Extensible Attributes
Workbench > Equipment > [select Entity
Name link] > Classifications tab [Pages]
A-6](https://image.slidesharecdn.com/12-1-man-operationcenter-ug2-150223055255-conversion-gate02/75/12-1-man-operation-center-ug-2-166-2048.jpg)
![Page Name Navigation Path
Equipment Reason Code Setup MOC Administrator > Equipment Reason
Code Setup
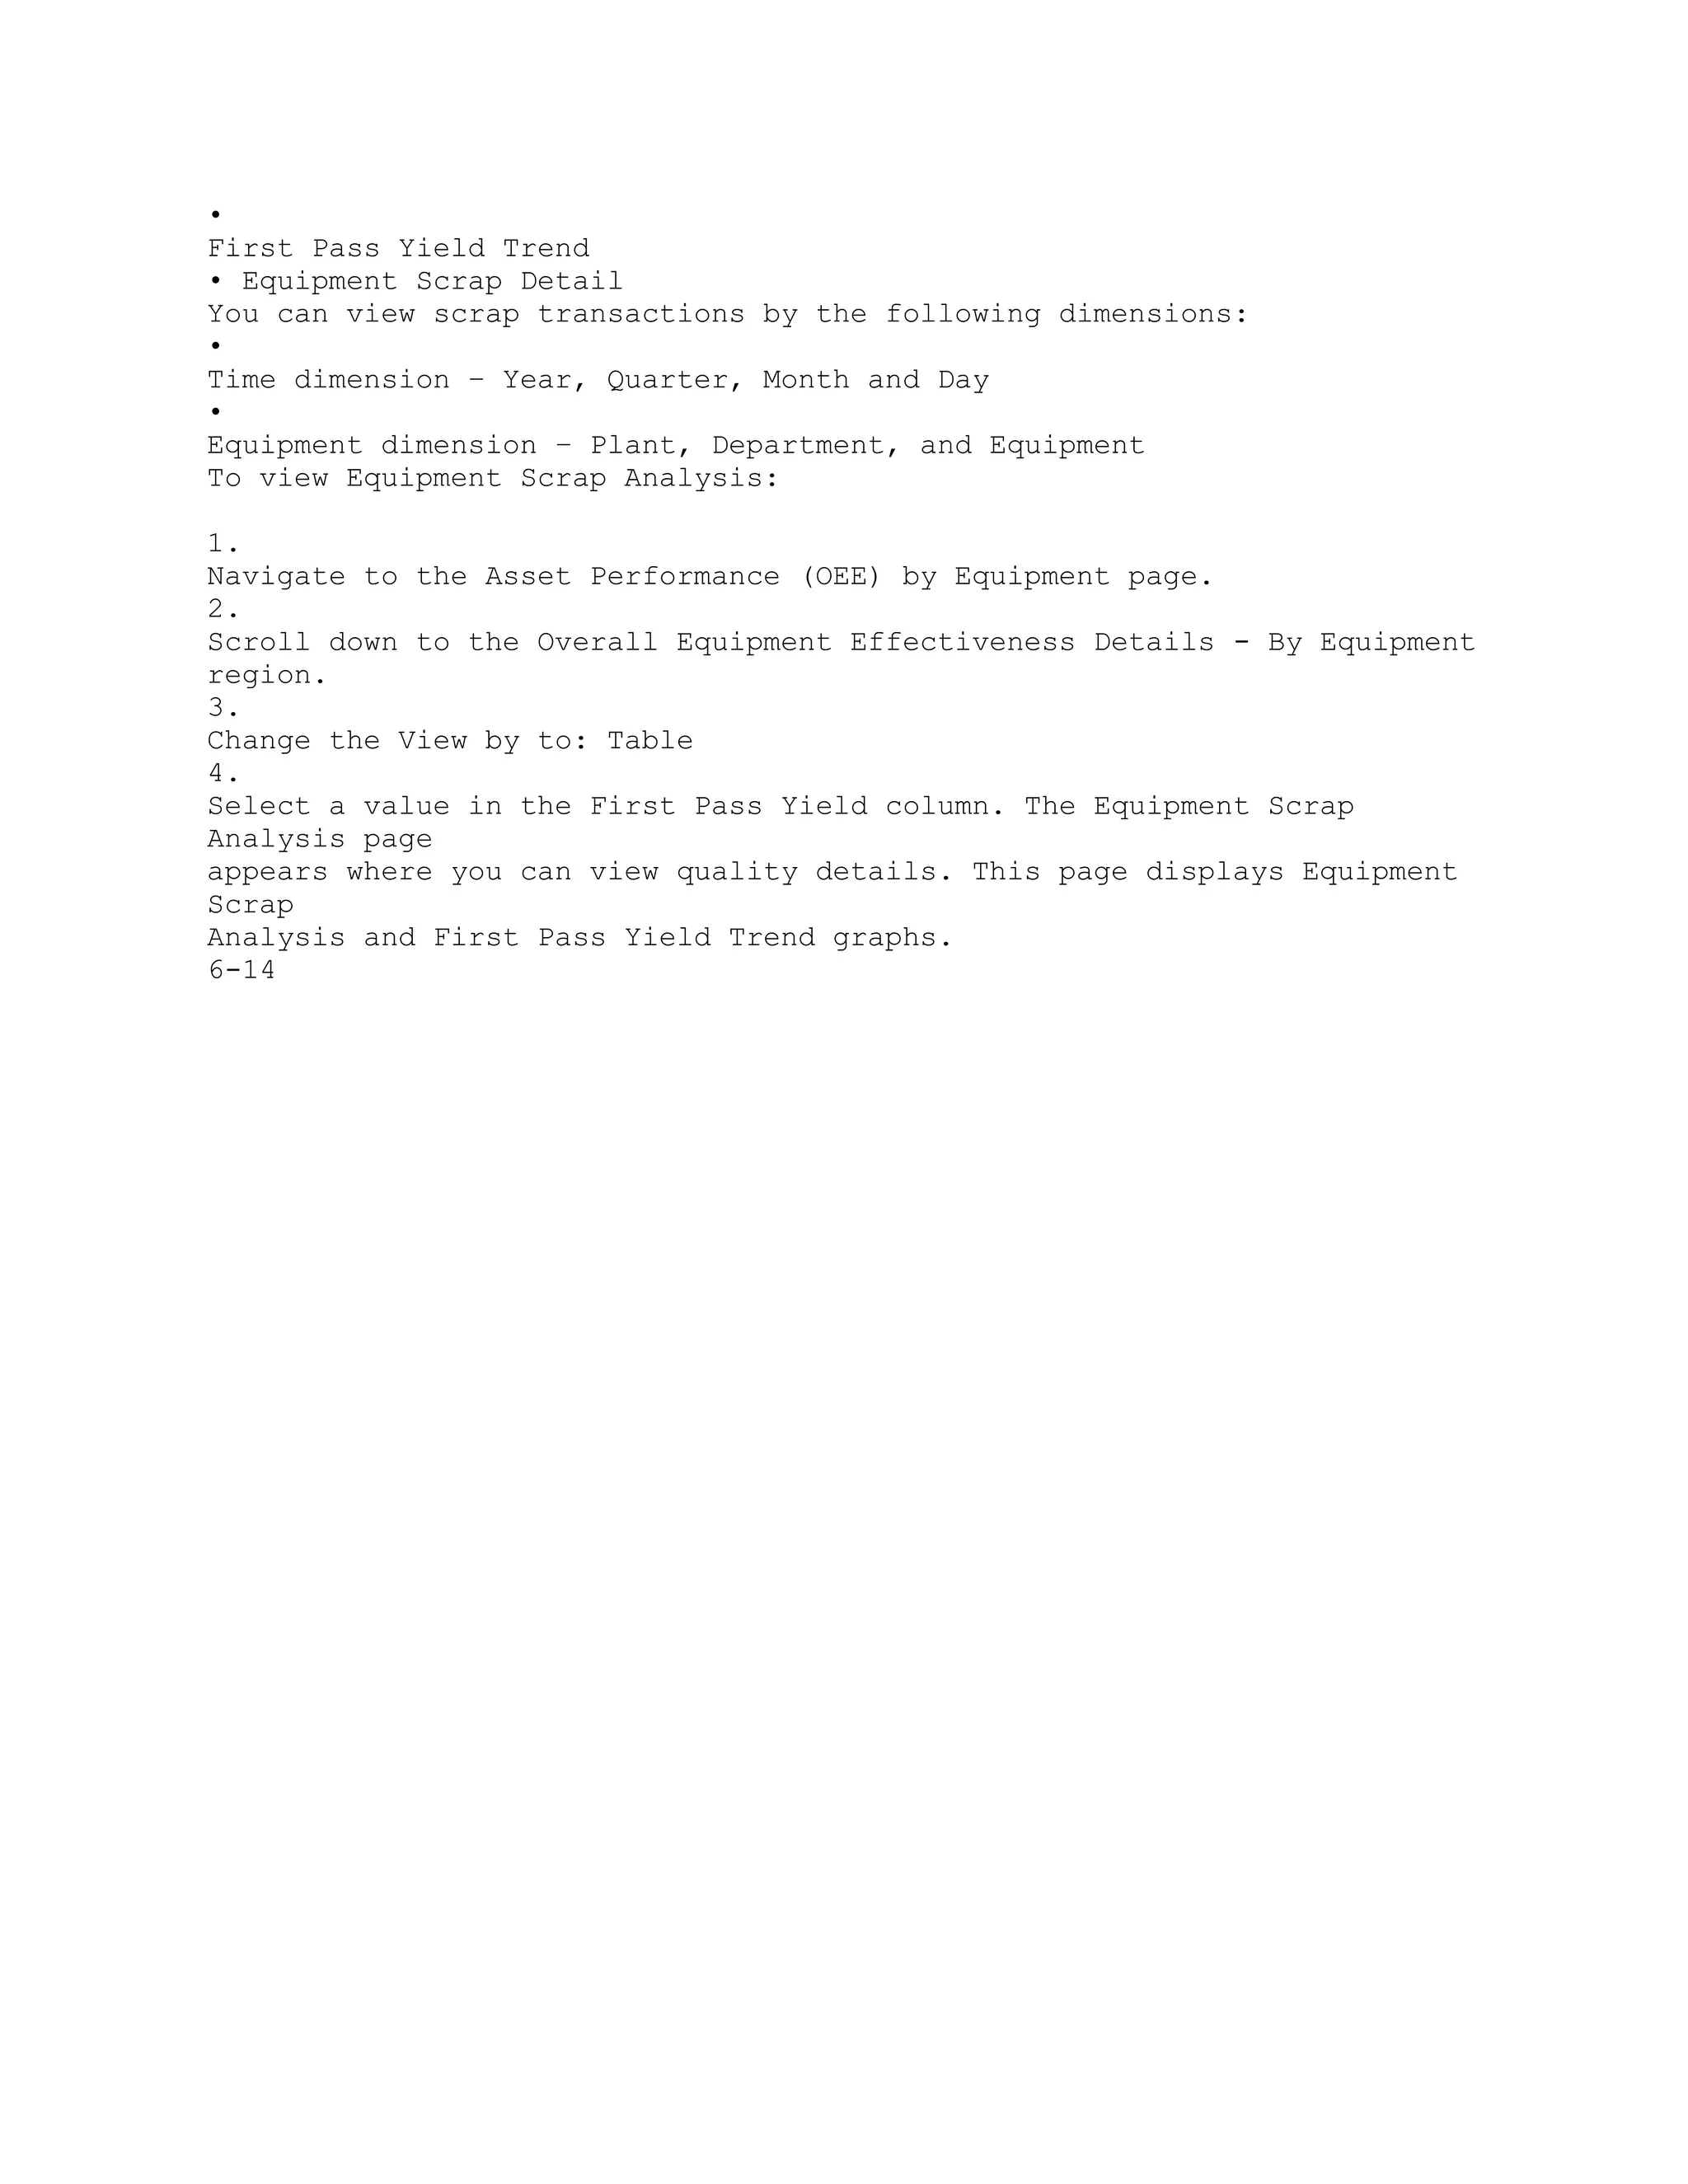
Equipment Scrap Analysis MOC User > Manufacturing Operations
Center Analytics > Plant Manager Dashboard
> [select a Bottom Performers Equipment
Gauge] > [Overall Equipment Effectiveness
Details Region] > [select a First Pass Yield
Value]
Equipment Scrap Reason MOC User > Tag Data Workbench >
Equipment Scrap Reasons
Equipment Scrap Reasons Entry MOC User > Tag Data Workbench >
Equipment Scrap Reasons > [Enter Scrap
Reason]
Equipment Scrap Reasons View MOC User > Tag Data Workbench >
Equipment Scrap Reasons > [select data on
Equipment Scrap Reason] > [select records] >
[View Reason]
Equipment Scrap Reasons MOC User > Manufacturing Operations
Center Analytics > Plant Manager Dashboard
> [select a Bottom Performers Equipment
Gauge] > [Overall Equipment Effectiveness
Details Region] > [select a First Pass Yield
Value] > [select a Scrapped Quantity value]
Event Setup MOC Administrator > Event Setup
Extensible Attributes Data MOC User > Extensible Attributes Data
Facilities Manager MOC User > Manufacturing Operations
Center Analytics > Facilities Manager
Items Overview MOC User > Extensible Attributes Data >
Items > [select an Entity Name link] > Entity:
Item [Entity Name link]
Item Pages MOC Administrator > Extensible Attributes
Workbench > Items > [select Entity Name link]
> Pages
7](https://image.slidesharecdn.com/12-1-man-operationcenter-ug2-150223055255-conversion-gate02/75/12-1-man-operation-center-ug-2-167-2048.jpg)
![Page Name Navigation Path
Manual Contextualization MOC User >Tag Data Workbench > Manual
Contextualization
Manufacturing Operations Center Catalog MOC User > Manufacturing
Operations
Center Analytics > Manufacturing Operations
Center Catalog
Others Overview MOC User > Extensible Attributes Data >
Others > [select an Entity Name link] > Entity:
Others [select Entity Name link]
Others Pages MOC Administrator > Extensible Attributes
Workbench > Others > [select Entity Name
link] > Classifications tab [Pages]
Parameters MOC Administrator > Setup > Run Requests >
Submit Request
Plant Manager Dashboard MOC User > Manufacturing Operations
Center Analytics > Plant Manager Dashboard
Production Loss Analysis MOC User > Manufacturing Operations
Center Analytics > Plant Manager Dashboard
> [select a Bottom Performers Equipment
Gauge] > [Production Loss Analysis]
Production Loss Detail MOC User > Manufacturing Operations
Center Analytics > Plant Manager Dashboard
> [select a Bottom Performers Equipment
Gauge] > [Production Loss Analysis] > [select
a Total Production Loss value]
Production Performance MOC User > Manufacturing Operations
Center Analytics > Plant Manager Dashboard
> [Production Performance]
Production Slippage Trend MOC User > Manufacturing Operations
Center Analytics > Plant Manager Dashboard
> [Production Performance]
Scrap Reason MOC User > Tag Data Workbench > Scrap
Reasons
A-8](https://image.slidesharecdn.com/12-1-man-operationcenter-ug2-150223055255-conversion-gate02/75/12-1-man-operation-center-ug-2-168-2048.jpg)
![Page Name Navigation Path
Scrap Reasons Entry MOC User > Tag Data Workbench >
Equipment Scrap Reasons > [select data on
Equipment Scrap Reason] > [select records] >
[Enter Scrap Reason]
Scrap Reasons [View] MOC User > Tag Data Workbench >
Equipment Scrap Reasons > [select data on
Equipment Scrap Reason] > [select records] >
[View Reason
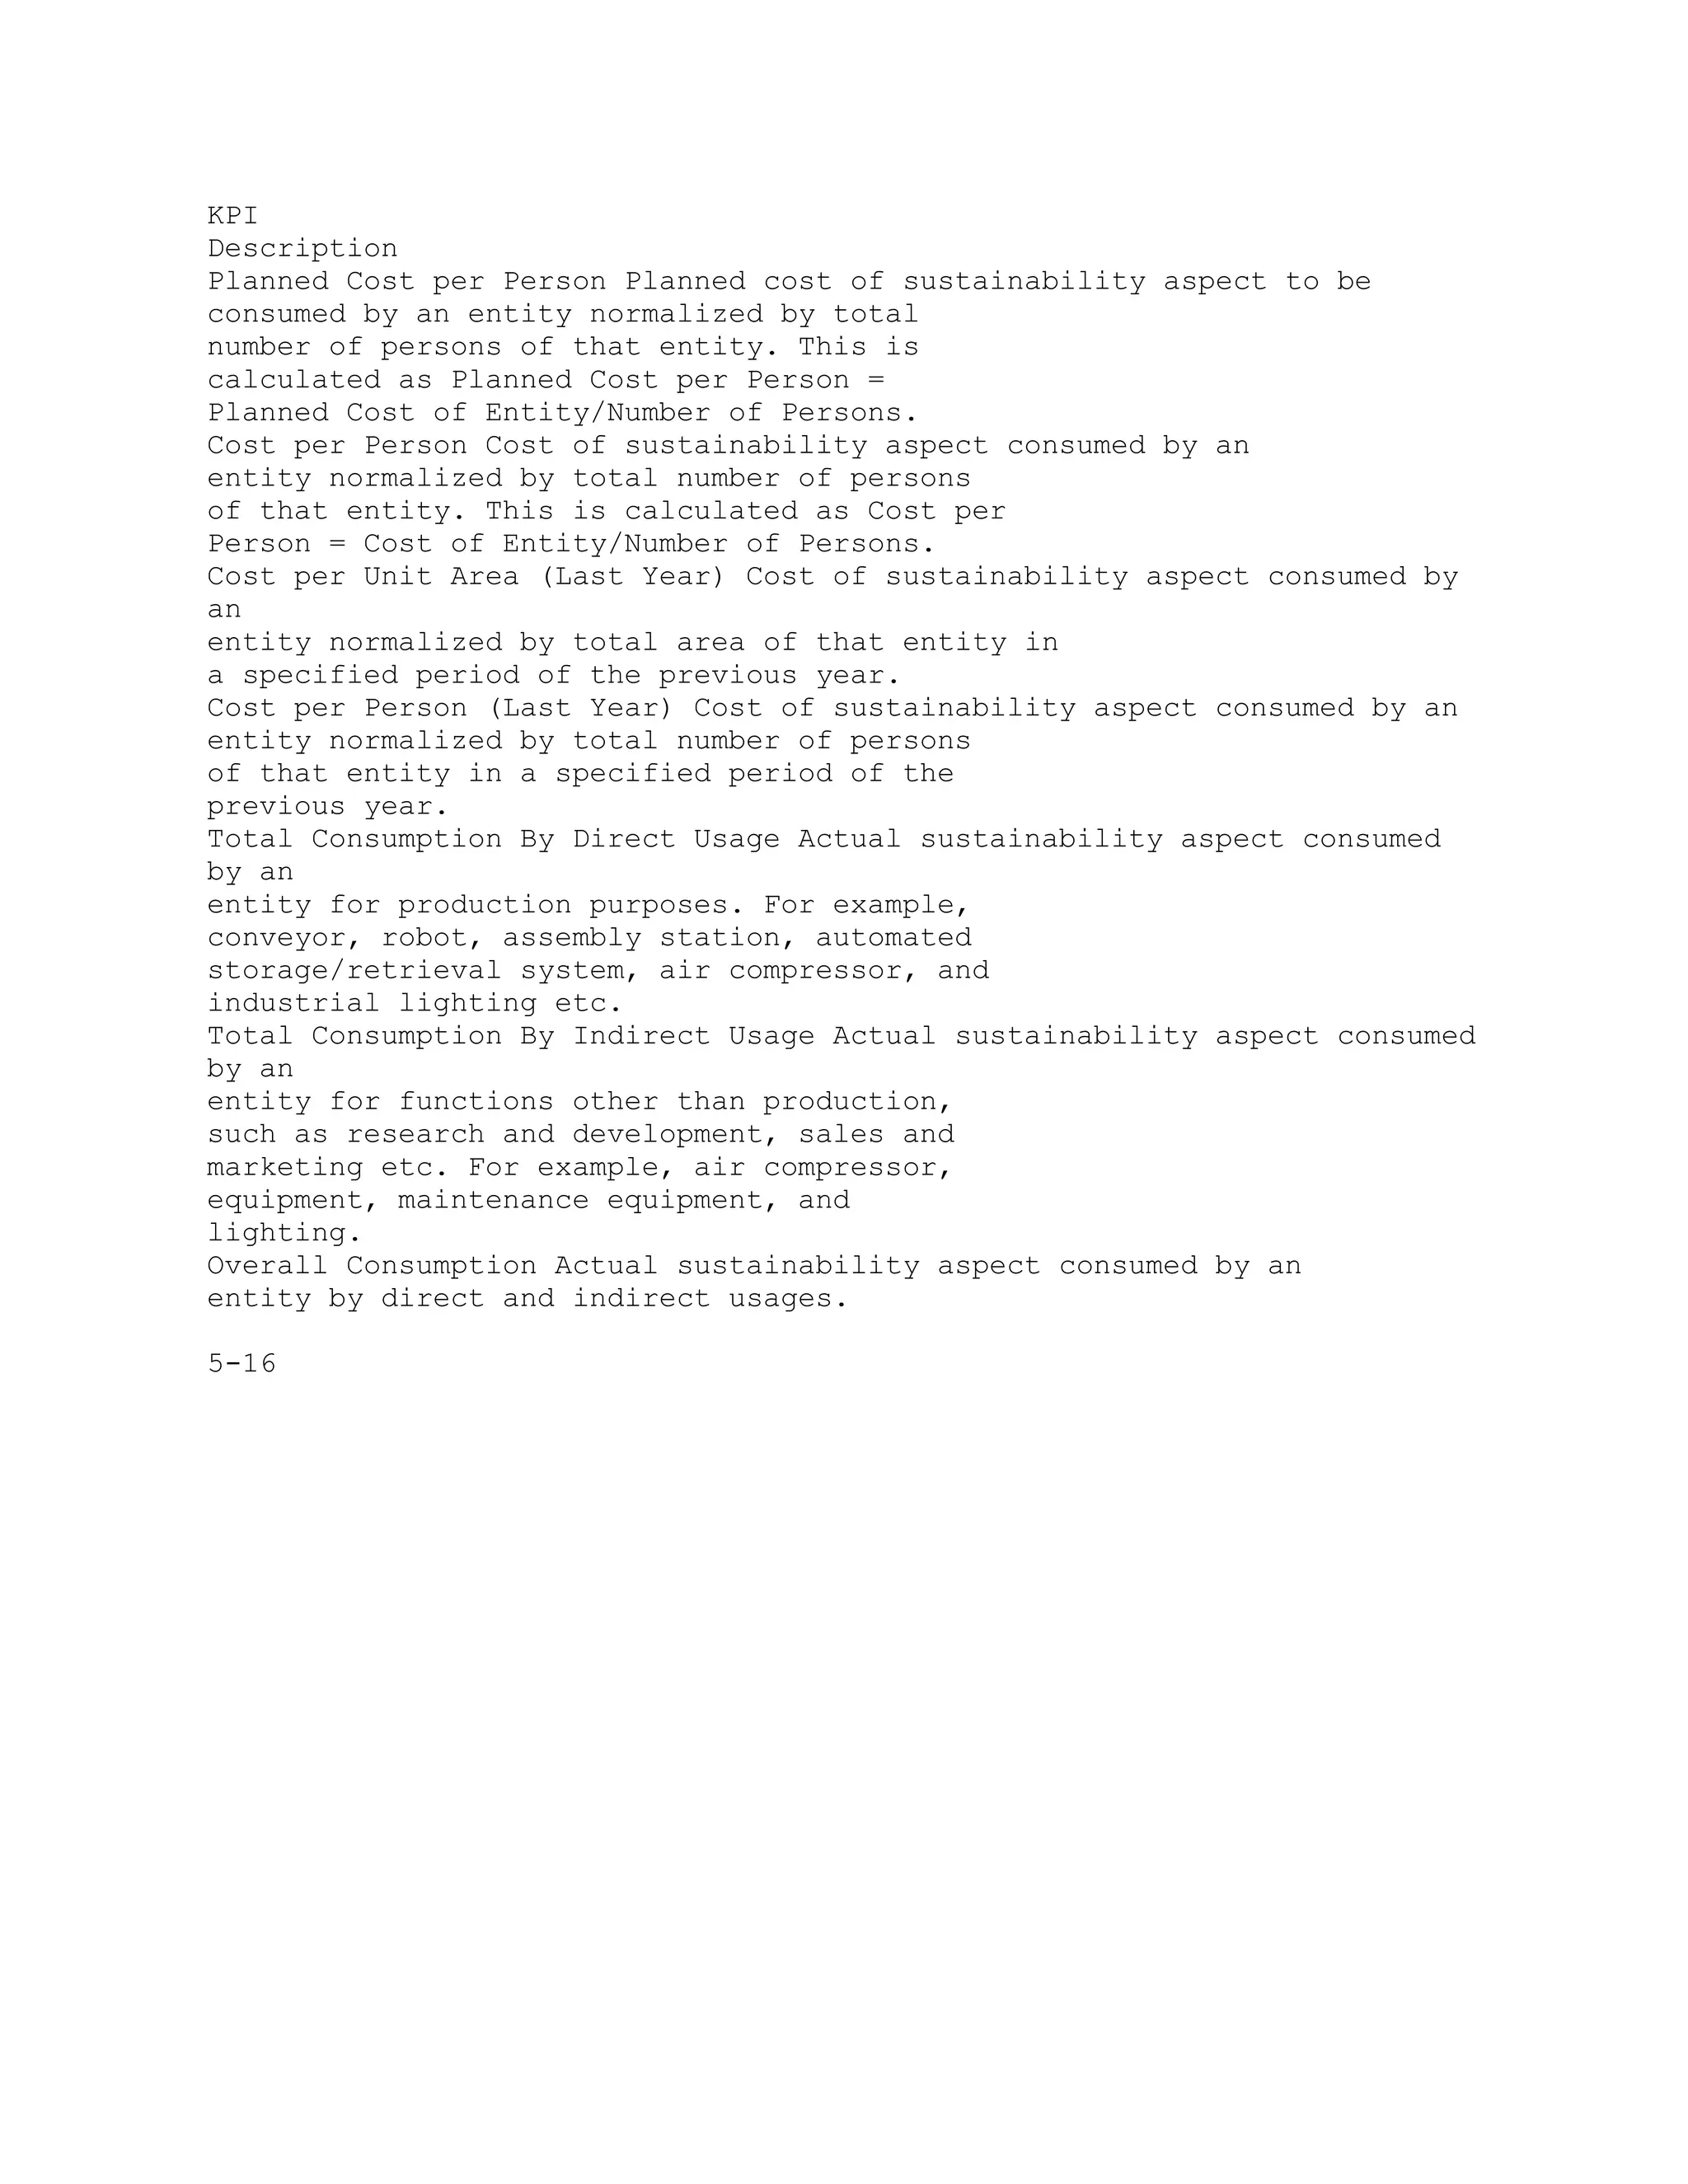
Sustainability Performance MOC User > Manufacturing Operations
Center Analytics > Plant Manager Dashboard
> Sustainability Performance
Tag Mapping MOC Administrator > Entity Hierarchy Home
Page > Equipment Setup> Tag Mapping
Tag Setup MOC Administrator > Setup > Tag Setup
Update Classification MOC Administrator > Extensible Attributes
Workbench > Others > Entity: Others [select
Entity Name link] > [Update]
Update Equipment Event Action Sequentially MOC Administrator > Event
Setup > [Update
Sequentially]
Update Equipment Reason Code Sequentially MOC Administrator > Equipment
Reason
Code Setup > [Update Sequentialy]
Work Orders Order Type MOC User > Extensible Attributes Data >
Work Orders > Entity: Work Order [select
Entity Name link] > Order Type
Work Orders Overview MOC User > Extensible Attributes Data >
Work Orders > Entity: Work Order [select
Entity Name link]
Work Order Pages MOC Administrator > Extensible Attributes
Workbench > Work Orders > [select Entity
Name link] > Classifications tab [Pages]
9](https://image.slidesharecdn.com/12-1-man-operationcenter-ug2-150223055255-conversion-gate02/75/12-1-man-operation-center-ug-2-169-2048.jpg)

Oracle Manufacturing Operations Center (MOC) is a solution that improves plant performance by collecting data from disparate systems, adding business context, and providing real-time analytics. Key components include a data model based on ISA-95, pre-built adapters, a rules engine to add context, and pre-built KPIs and reports delivered through Oracle BI. The MOC Administrator role is used to set up sustainability aspects, tags, equipment, and run processes to calculate metrics like energy consumption and emissions.


![Vibe Coding vs. Spec-Driven Development [Free Meetup]](https://cdn.slidesharecdn.com/ss_thumbnails/vibecodingvsspecdrivendevelopment-251209105622-43f455e7-thumbnail.jpg?width=640&height=640&fit=bounds)


