1 s2.0-s0165410104000758-main

This document summarizes a study that examines the relationship between financial reporting quality and investor losses during the 1929 stock market crash in the United States. The study tests two hypotheses: 1) whether managers voluntarily provided higher quality financial reporting consistent with investors' interests absent regulatory requirements, and 2) whether higher quality financial reporting was associated with smaller declines in stock prices during the crash. The study finds that factors like contracting conflicts and information costs influenced managers' voluntary financial reporting choices. It also finds that firms with higher quality financial reporting prior to 1929, as measured by transparency, conservatism, and auditing, experienced smaller declines in stock prices during the crash.

More Related Content
Similar to 1 s2.0-s0165410104000758-main
Similar to 1 s2.0-s0165410104000758-main (20)
More from Sri Apriyanti Husain
More from Sri Apriyanti Husain (20)
1 s2.0-s0165410104000758-main
- 1. ARTICLE IN PRESS Journal of Accounting and Economics 38 (2004) 65–116 www.elsevier.com/locate/econbase Investor protection under unregulated financial reporting$ Jan Barton, Gregory Waymire Goizueta Business School, Emory University, 1300 Clifton Road, Atlanta, GA 30322, USA Received 3 March 2003; received in revised form 26 January 2004; accepted 3 June 2004 Available online 11 November 2004 Abstract We examine whether availability of higher quality financial information lessens investor losses during a period seen as a stock market crash. We focus on October 1929, which partly motivated sweeping financial reporting regulations in the 1930s. Using a sample of 540 common stocks traded on the New York Stock Exchange during October 1929, we find that the quality of firms’ financial reporting increases with managers’ incentives to supply higher quality financial information demanded by investors. Moreover, firms with higher quality financial reporting before October 1929 experienced smaller stock price declines during the market crash. r 2004 Elsevier B.V. All rights reserved. JEL classification: D8; G1; K2; M4; N2 Keywords: Investor protection; Voluntary disclosure; Financial reporting quality; Financial reporting regulation; Stock market crashes $We appreciate the helpful comments of Anwer Ahmed, Linda Bamber, George Benston, Gary Biddle, Robert Bowen (the referee), John Dickhaut, Jennifer Francis, Michelle Hanlon, David Harris, S.P. Kothari (the editor), Dave Larcker, Richard Leftwich (the discussant), Andy Leone, Christian Leuz, Robert Lipe, Jerry Lobo, Tom Lys, D.J. Nanda, George Plesko, Shiva Rajgopal, Doug Skinner, Ram Venkataraman, Joe Weber, Peter Wysocki, Jerry Zimmerman, and seminar participants at Duke University, Emory University, Georgia State University, Syracuse University, University of Georgia, University of Michigan, University of Minnesota, University of Pennsylvania, the 2003 meetings of the American Accounting Association, the 2003 London Business School Accounting Symposium, and the 2003 JAE Conference. We also thank Allison Gilmore, Ron Harris and Steven Schmitt for research assistance, and the Goizueta Business School for generous funding. Corresponding author. Tel.: +1404 727 6398; fax: +1404 727 6313. E-mail address: jan_barton@bus.emory.edu (J. Barton). 0165-4101/$ - see front matter r 2004 Elsevier B.V. All rights reserved. doi:10.1016/j.jacceco.2004.06.001
- 2. 66 J. Barton, G. Waymire / Journal of Accounting and Economics 38 (2004) 65–116 1. Introduction ARTICLE IN PRESS One view that often emerges after a financial crisis is that investor losses would have been lower had managers chosen to supply higher quality financial reporting. Such a view surfaced in 19th-century Great Britain after periods with high business failure rates (Littleton, 1933, pp. 272–287), and in the United States after stock market downturns in October 1929 and 2000–2001 (Pecora, 1939; U.S. House, 2002). In each of these cases, this view partly motivated sweeping changes in financial reporting regulation. This regularity naturally raises the question: To what extent do managers, absent a regulatory mandate, actually supply higher quality financial reporting that mitigates investor losses during a financial crisis? We provide U.S. evidence on this issue by testing whether shareholders of firms with higher quality financial reporting during the late 1920s suffered smaller losses in the stock market crash of October 1929.1 Specifically, we examine two hypotheses. The first concerns the extent to which, in the absence of a regulatory mandate, managers voluntarily supply higher quality financial reporting consistent with investors’ economic interests. Our second hypothesis is whether financial reporting policies selected in an unregulated reporting environment are associated with beneficial investor protection as reflected in less negative common stock returns in October 1929. The available evidence on the association between financial reporting quality and stock returns during a market crash is sparse and based on international data. Johnson et al. (2000) find no relation between country-specific measures of accounting quality and stock market performance in the 1997–1998 East Asian crisis. Using two firm-specific proxies for accounting quality (external audit by a Big 6 auditor and U.S. ADR listing), Mitton (2002) documents a positive relation between reporting quality and firms’ stock returns during the East Asian crisis. Glaeser et al. (2001) compare stock market performance in Poland and the Czech Republic after the fall of communism in 1989. Poland adopted stringent reporting regulation (along with other legal requirements for protecting shareholders) and experienced strong capital market development over 1994–1998. In contrast, over the same period, the Czech financial market was much less regulated and experienced a substantial decline in aggregate market capitalization and number of listed firms. Our focus on U.S. firms in the 1920s offers insights beyond prior studies for three reasons. First, the 1920s’ reporting environment presents considerable cross-sectional variation in financial reporting, even on very basic choices such as disclosure of revenues and operating expenses (Benston, 1969). Hence, we can develop direct firm-specific measures of voluntarily chosen reporting quality and 1Hong and Stein (2003, p. 487) define a stock market crash as an event characterized by an unusually large negative price movement affecting multiple securities in the absence of new information. Identifying empirically whether an event represents a crash under this or any similar definition is difficult, if not impossible (Flood and Hodrick, 1990). As a result, our tests focus on an event (October 1929) widely perceived as a market crash, but we do not test formally whether such event is a crash as defined by Hong and Stein (2003). Thus, hereafter we use the term ‘‘crash’’ solely to refer to events such as October 1929 that are widely perceived by investors and policymakers to be stock market crashes.
- 3. ARTICLE IN PRESS J. Barton, G. Waymire / Journal of Accounting and Economics 38 (2004) 65–116 67 identify more clearly the effects of these choices on investor wealth. Second, the October 1929 market crash is seen as among the most significant financial crises in U.S. history (Galbraith, 1972), and was followed within five years by the most extensive changes in financial reporting requirements in U.S. history (Parrish, 1970). Thus, this setting suits well our need for an event perceived as a financial crisis linked, in part, to deficient financial reporting quality. Third, and most important, pre-1930s’ U.S. financial reporting had developed over a long period as part of the broader evolution of financial markets, contractual and related legal arrangements, and other institutions such as information intermediaries (Gower, 1920; Fisher, 1933; Hawkins, 1963; Miranti, 1986). Financial reporting in the setting we examine thus likely differs fundamentally from that in a newly created, unregulated market such as the Czech Republic in the mid-1990s. We believe our setting provides a powerful economic test of whether managers’ voluntary financial reporting choices can promote beneficial investor protection in the absence of mandatory reporting requirements.2 We model the economic determinants of voluntary financial reporting and test for the presence of beneficial investor protection, while controlling for the endogeneity of reporting policies and other determinants of crash-period stock returns. We first model managers’ choice of financial reporting quality, which we measure as income statement and balance sheet transparency, accounting conservatism and the purchase of an external audit. Our use of transparency measures assumes that finer disaggregation of financial statement data allows users to identify better underlying economic factors responsible for changes in key aggregates such as income and net assets. More conservative financial reporting can enhance information credibility when investors believe that managers might seek to overstate income and net assets for personal gain. Likewise, the purchase of an audit suggests that reported information is more likely free of misrepresentation and thus more reliable. We estimate reporting choice models where the dependent variable is a combination of these quality attributes derived from a principal factor analysis (consistent with Bushman et al., 2004a). Our independent variables include proxies for likely determinants of managers’ financial reporting choices (Watts and Zimmerman, 1986; Healy and Palepu, 2001). These include information costs in equity markets, potential contractual and control conflicts among claimants to the firm’s assets, the prospect of shareholder wealth loss due to competitor and government responses to the firm’s product market success, and the availability of alternative information for investors to use in valuing claims and monitoring management. Our evidence suggests that these factors are associated with our measure of financial reporting quality. Contracting and control conflicts play an important role in managers’ voluntary reporting policies. For example, our quality measure (as well as the underlying measures of income statement transparency, auditing and conservatism) is positively associated with leverage. Consistent with Ahmed et al. 2Basu (2003) discusses the benefits of empirical historical research on financial reporting. McCloskey (1995) makes a compelling, more general case for the study of economic history.
- 4. ARTICLE IN PRESS 68 J. Barton, G. Waymire / Journal of Accounting and Economics 38 (2004) 65–116 (2002), the presence of a potential income measurement conflict that can affect distributions to claimants also is associated with more conservative reporting.3 These findings are consistent with a longstanding demand for accounting information based on contracting (Watts, 1977, 2003; Watts and Zimmerman, 1983). Proxies for information costs in equity markets also are significantly associated with financial reporting quality. Higher financial reporting quality scores, driven largely by greater auditing and conservatism, characterize firms issuing equity. Young firms in technology-based industries that are more difficult to value also have higher reporting quality scores. Firms where alternative information is available, either because of the firm’s dividend policy or regulated product markets, exhibit significantly lower reporting quality measures. We also find some support for the conjecture that firms facing higher competitive and political costs choose lower quality reporting, but this evidence is weak and limited to conservatism as a measure of reporting quality. As a whole, our findings suggest that managers select financial reporting quality by factoring in investor demand for information. Our investor protection tests follow from the view that managers’ self-selected higher quality financial reporting can lessen investor losses during a market crash. Like Johnson et al. (2000) and Mitton (2002), we test the hypothesis that firms with higher quality reporting experience less negative stock returns during a market crash. These market-based tests require that we model managers’ self-selection of reporting quality and control for other factors associated with stock returns during the 1929 market crash. We use instrumental variables techniques to model the endogeneity in financial reporting. We also control for firms’ risk and inherent noise in fundamental values likely affecting stock returns during the 1929 market crash (Blanchard and Watson, 1982; Hong and Stein, 2003). We then estimate a cross-sectional model where the firm’s October 1929 common stock return is the dependent variable and the independent variable of primary interest is our proxy for financial reporting quality. We predict a positive coefficient on this independent variable; that is, higher reporting quality will be associated with less negative October 1929 returns, all else equal. Our evidence supports the hypothesis that shareholders of firms with higher quality financial reporting experienced significantly smaller losses during the 1929 crash. To get a better sense of the economic magnitude of this effect, we compare the returns of firms in the topqua rtile of our reporting quality measure with the returns of other firms. After controlling for endogeneity and other factors affecting crash-period returns, we estimate that investors in firms in the top quartile lost on average about 11% (i.e., 1,100 basis points) less during the 1929 crash than did investors in other firms—about half of what other investors lost during the crash. Our market-based tests also indicate that proxies for noisy fundamentals explain a significant proportion of October 1929 returns; these results are consistent with previous 3One example of possible income measurement conflicts is when dividends on participating preferred shares vary with income levels. In such a case, a large payout to preferred shareholders can reduce future dividend payments to common shareholders.
- 5. ARTICLE IN PRESS J. Barton, G. Waymire / Journal of Accounting and Economics 38 (2004) 65–116 69 research examining the cross-sectional variation in equity returns during a market crash (Chen et al., 2001). Viewed collectively, our evidence suggests that managers respond to investor demand for information and that managers’ voluntary financial reporting choices can promote investor protection. That is, economic forces in advanced markets provide managers with incentives for beneficial financial reporting even in the absence of a regulatory mandate. At the same time, our tests are modest in scope. We do not examine directly the incremental effects of mandatory financial reporting, which may have significant economic value beyond managers’ voluntary financial reporting choices. Thus, our results do not speak to the social value of financial reporting regulation. Measuring the relative effects of voluntary versus mandatory financial reporting quality remains an important issue for future research. As any empirical study, ours is subject to several caveats. First, our tests rely on proxies for unobservable constructs; measurement error could bias our tests against finding statistically significant results. In addition, theories and empirical work on accounting-based cross-sectional differences in stock returns during a market crash are limited (see, e.g., Bowen et al., 1989; Keating et al., 2003). To the extent that we are unable to identify and control for correlated omitted variables, our results may be biased. Finally, the period we examine differs markedly from current times, so it would be inappropriate to generalize our results directly to the present, when extensive financial reporting regulation is in place in the U.S. and in many other countries. The rest of the paper is organized as follows. Section 2 develops our hypotheses and Section 3 describes the sample. Corporate financial reporting, the stock market and equity valuation in the late 1920s are described in Section 4. Section 5 examines the relation between financial reporting quality before October 1929 and managers’ incentives to report consistent with shareholders’ interests. Evidence on the relation between October 1929 stock returns and ex ante measures of financial reporting quality follows in Section 6. Finally, Section 7 offers concluding remarks. 2. Hypotheses We examine two related hypotheses. The first concerns the extent to which, in the absence of a regulatory mandate, managers voluntarily supply higher quality financial reporting consistent with investors’ interests. The second hypothesis is whether financial reporting policies selected by managers in an unregulated reporting environment are associated with economically significant investor protection effects. This section describes the hypotheses and the economic intuition underlying them. Regulators often cite investor protection as a basis for the more stringent financial reporting requirements enacted after financial crises. This investor protection justification has a long history dating back at least to British legislation passed in the wake of corporate bankruptcies in the 19th century (Littleton, 1933, pp. 272–287). Investor protection arguments surfaced in the U.S. after the 1929 stock market crash as justification for the financial reporting requirements embodied in the Securities
- 6. ARTICLE IN PRESS 70 J. Barton, G. Waymire / Journal of Accounting and Economics 38 (2004) 65–116 Act of 1933 and the Securities Exchange Act of 1934 (Pecora, 1939; Parrish, 1970). The intent of the Securities Acts was to protect investors from exploitation by informed traders in the large-scale securities markets that developed to support financing of enterprises with diffuse ownership structures (Berle and Means, 1932). More recently, the U.S. Congress and the Securities and Exchange Commission (SEC) have cited investor protection as the basis for recent reporting rules following the market decline of the past few years (US House, 2002). Implicit in the investor protection justification for financial reporting regulation is that higher quality reporting would have lessened investor losses during the recent crisis and that managers lacked incentives to supply higher quality financial information voluntarily.4 Of course, mandatory disclosure requirements need not be the sole source of beneficial investor protection—self-interested managers supply information volun-tarily to reduce agency costs (Jensen and Meckling, 1976; Watts and Zimmerman, 1986) and information costs in securities markets (Dye, 2001; Verrecchia, 2001). There is also considerable evidence that U.S. managers disclose substantial amounts of information voluntarily, but this evidence is drawn largely from the modern, highly regulated reporting environment (Healy and Palepu, 2001). Such evidence is difficult to generalize to the setting we examine since voluntary disclosure can be affected by mandatory reporting requirements (Dye, 1985) and by liability rules that penalize nondisclosure (Skinner, 1997). Further, the sheer magnitude of regulation can impede identification of voluntary reporting incentives and effects. That is, modern U.S. financial reporting is heavily regulated, and the effects of voluntary reporting choices on investors are likely of lower order magnitude (Sunder, 1997, pp. 99–109; Basu, 2003). Recent cross-country research also does not lend itself to straightforward interpretation of the extent to which voluntary reporting choices can generate investor protection benefits. To illustrate, cross-country research suggests that countries with stronger mechanisms to protect minority shareholders’ rights (including enforceable financial reporting requirements) have more liquid stock markets, more effective corporate governance and superior economic performance (La Porta et al., 2000; Bushman and Smith, 2001). Most of the studies in this literature do not examine directly the extent to which beneficial investor protection can result from market forces that evolve over time in advanced market economies. Thus, a statistical association between financial reporting quality and investor protection in a cross-country study could result if either policymakers write new reporting rules in response to inefficiencies in the market for information, or write new rules that merely codify existing efficient practices that emerge as market arrangements evolve (Watts and Zimmerman, 1983).5 In either case, there would be 4The theoretical literature has long recognized that underproduction of information can occur because of externalities (Dye, 1990) or when accounting information is a public good (Gonedes and Dopuch, 1974). 5It is also possible that more advanced, wealthier market economies provide greater opportunities for policymakers to write rules that redistribute wealth and promote their own political survival (Stigler, 1971; Peltzman, 1976). Watts and Zimmerman (1978) argue that accounting rules emerge from a political process driven by the self-interested optimizing behavior of regulators.
- 7. ARTICLE IN PRESS J. Barton, G. Waymire / Journal of Accounting and Economics 38 (2004) 65–116 71 a positive association between the quality of financial reporting and investor protection, and inferring causality from such an association would be difficult (Sloan, 2001). More focused cross-country comparisons that control for differences in the nature of market development could provide clearer evidence as to the causal underpinnings of the association between voluntary financial reporting and investor protection. Mitton (2002) addresses this issue by proxying financial reporting quality via East Asian firms’ choices to have a listed American depositary receipt (ADR) and to engage a large international auditor. While Mitton’s analysis gets closer to measuring the impact of voluntary financial reporting on investor protection, his ADR variable essentially captures the extent of U.S. disclosure regulation. In addition, while auditor choice is likely an important factor in voluntary reporting choice, Mitton’s results on this variable are considerably less robust than for the ADR variable (Mitton, 2002, p. 235). Glaeser et al. (2001) compare financial reporting rules and other legal governance requirements in Poland and the Czech Republic during the 1990s. Both economies emerged from communism in 1989 and institutionalized privatization reforms in the next five years. Despite many similarities between these two countries, Poland adopted legal rules to protect investors (including mandatory disclosure), whereas the Czechs followed a more laissez-faire approach to corporate governance. Glaeser et al. (2001) document that Czech financial markets exhibited sharpdecli nes in aggregate capitalization and the number of listed firms during 1997–1998 as evidence of widespread investor expropriation surfaced, suggesting that laissez-faire approaches to corporate governance may not work well in the short-run for emerging market economies. Yet evidence from the Czech Republic may not generalize to markets and related infrastructures that evolve mostly on their own devices over a longer period. Hayek (1973, pp. 35–54, 1979, pp. 158–159) argues that market arrangements and supporting institutions evolve as ‘‘spontaneous orders’’ through trial and error. A spontaneous order can be thought of as a set of heuristics and practices that emerge naturally to facilitate economic exchange and social interaction. The primary example Hayek cites is British and American common law, which evolved slowly over time as a device to codify (via case law precedent) already existing norms of behavior that parties use to form expectations about the extent of protection provided under the law from harmful acts by others (Hayek, 1973, pp. 94–123). Substantial evidence supports the notion that U.S. financial markets and related institutions (including financial reporting) grew extensively before 1930. Rajan and Zingales (2003) document that U.S. equity markets showed large increases over 1913–1929 in stock market capitalization, the number of listed companies and the extent of capital formation via equity issuance. Qualitative historical analyses also suggest considerable development in corporate accounting and disclosure practices, tools for financial analysis and the extent of auditing in the three decades after 1900 (Hawkins, 1963; Horrigan, 1968; Miranti, 1986). Consistent with the idea that Hayekian spontaneous orders emerge within markets and related infrastructures, the development of generally accepted accounting principles before 1930 was influenced
- 8. ARTICLE IN PRESS 72 J. Barton, G. Waymire / Journal of Accounting and Economics 38 (2004) 65–116 strongly by case law (Gower, 1920; Hatfield, 1927, pp. 537–539; Fisher, 1933) and informal information sharing among professional accountants (Moonitz, 1970, pp. 147–150). Economics-based historical research also supports the notion that substantial voluntary financial reporting preceded the establishment of the SEC. Watts and Zimmerman (1983) find evidence that audits existed in the early 13th century, and Basu (1995) notes that the Conservatism Principle dates back at least to the 15th century. Other studies document that before 1930 U.S. firms voluntarily supplied considerable data in annual reports (Benston, 1969; Sivakumar and Waymire, 1993; Ely and Waymire, 1999) and disclosed interim earnings information absent a government mandate (Leftwich et al., 1981; Sivakumar and Waymire, 1994). Despite these studies, we still have little evidence on the factors that lead managers to voluntarily select higher quality financial reporting in the absence of government-mandated disclosure. Watts and Zimmerman (1983) evaluate their qualitative evidence on auditing in light of hypotheses regarding the economics of agency costs. Leftwich et al. (1981) test agency-related explanations for interim reporting, but find inconsistent results. We are left thus with an unresolved empirical question: What economic forces lead managers to supply higher quality financial reporting in more developed markets absent a regulatory mandate? We expect managers will supply higher quality financial statements voluntarily when the net benefits to shareholders from higher reporting quality are sufficiently large. Accordingly, our first (alternative) hypothesis is H1: Absent regulation, managers will supply voluntarily higher quality financial reporting consistent with investor interests. Testing this hypothesis requires that we specify proxies for the net benefits of financial reporting. Based on prior research (Watts and Zimmerman, 1986; Healy and Palepu, 2001), we predict that managers’ voluntary choice of financial reporting quality is driven by information costs in securities markets, potential contracting and control conflicts among claimants to the firm’s assets, adverse competitive and political responses arising from the firm’s superior product market performance, and the availability of alternative information that shareholders can use in valuing equity claims and monitoring managers. We discuss in Section 5 the specific incentive proxies included in our model of financial reporting choice. Our second hypothesis concerns the effect of voluntary financial reporting on investor protection. Consistent with recent finance studies, we focus on the extent to which higher quality financial reporting is associated with smaller investor losses during an event perceived as a stock market crash (Johnson et al., 2000; Glaeser et al., 2001; Mitton, 2002). Our empirical analysis is akin to Mitton’s (2002), who examines the relation between financial reporting quality and stock returns using firm-specific data for a sample of companies affected by the East Asian crisis of 1997–1998. The second (alternative) hypothesis we test is H2: Stock returns during October 1929 are positively associated with the firm’s prior financial reporting quality, all else equal.
- 9. ARTICLE IN PRESS J. Barton, G. Waymire / Journal of Accounting and Economics 38 (2004) 65–116 73 H1 and H2 are obviously sequential. Assuming that our tests are well specified and sufficiently powerful, failure to reject the null hypothesis implicit in H1 renders H2 moot. Absent a relation between managers’ reporting choices and investors’ demand for information, one cannot argue that voluntary financial reporting promotes investor protection. If we reject the null for H1, then failure to overturn the null for H2 likewise suggests that voluntary financial reporting does not promote investor protection. Only evidence that rejects both nulls for H1 and H2 implies that voluntary financial reporting promotes investor protection, at least in the setting we examine. Higher quality financial reporting can lessen investor losses during a market crash for three noncompeting reasons; obviously, distinguishing among them is irrelevant if our tests do not support H1 and H2. The first follows from the model in Johnson et al. (2000), who examine how the equilibrium amount of managerial wealth expropriation (i.e., ‘‘stealing’’) is set in response to penalties for stealing and returns to investment by the firm. Their model predicts that the manager’s incentive to steal increases following a market crash since returns to investment have declined. Because weaker governance structures are associated with smaller expected penalties, the manager’s level of stealing is more sensitive to declines in returns to investment. Thus, all else equal, higher quality financial reporting (i.e., stronger governance) should be associated with a smaller increase in managerial wealth expropriation during a market crash. Broadly consistent with managerial wealth expropriation, the Securities Acts enacted in the 1930s are disclosure-oriented statutes intended to limit investor exploitation by insiders in securities market transactions.6 This goal was to be achieved largely by limiting the extent to which insiders could exploit an informational advantage; for example, the 1934 Act outlaws market manipulation and insider short sales, and requires insiders to report equity transactions to the SEC (Loss and Seligman, 2001, pp. 631–675). More important for our purposes, the Securities Acts mandate extensive public disclosure under the argument that equal access to information limits insiders’ ability to profitably trade on nonpublic information in the first place. Thus, if higher quality financial reporting promotes investor protection and some managers already disclosed such information to investors, then their firms should be characterized by less negative October 1929 stock returns. A second explanation also predicts a positive relation between financial reporting quality and investor losses during a market crash, but based on a different story. Events perceived as stock market crashes often are viewed as the bursting of a speculative bubble (White, 1990). Experimental asset markets exhibit bubble-crash price dynamics (i.e., large price increases that depart from fundamentals, followed by sharpp rice declines), yet researchers have not identified fully the causal factors underlying this regularity (Lei et al., 2001). Prior theoretical research suggests that 6The impetus for the Securities Acts was not related to widespread direct fraud by managers, as was alleged in the East Asian crisis or in Eastern European countries in the 1990s (Johnson et al., 2000; Glaeser et al., 2001). There is little evidence of widespread, economically significant fraud in the decade before the enactment of the Securities Acts (Benston, 1969, pp. 517–519), even though a few highly visible cases were discussed prominently in congressional hearings (Flesher and Flesher, 1986).
- 10. ARTICLE IN PRESS 74 J. Barton, G. Waymire / Journal of Accounting and Economics 38 (2004) 65–116 speculative bubbles can exist even when investors behave rationally (Blanchard and Watson, 1982; Tirole, 1982), although detecting such bubbles with archival data is complicated by the need to specify a correct asset-pricing model (Flood and Hodrick, 1990). Prior research also predicts that, if a bubble develops, its occurrence is probably related to inherent noise in or uncertainty about the asset’s fundamental value.7 For instance, Blanchard and Watson (1982) argue that speculative bubbles are more probable for risky investments like common stocks than for low-risk investments like U.S. Treasury bills because future cash flows are more uncertain for common stocks (see also Hong and Stein, 2003).8 Hirota and Sunder (2002) argue that bubbles are more likely when investors cannot accurately forecast future dividends. The absence of a future dividend ‘‘anchor’’ makes it difficult for investors to induct backward to fundamental values, so investors may substitute towards forecasts of future prices (and by implication, also forecasts of other traders’ expectations about future prices). As a consequence, prices may depart from fundamental values, and Hirota and Sunder (2002) predict, like Blanchard and Watson (1982), that this will be more likely for firms in technology-driven, emerging industries where value depends more on future growth prospects. Their evidence from experimental markets is consistent with this conjecture. Also consistent with this view, historical episodes perceived as speculative bubbles often occur during times of major technological innovation with potentially large but highly uncertain payoffs for the firms involved (Shiller, 2000, pp. 96–117). If bubbles are related to noise in fundamental values, higher quality financial reporting can offset such noise at least partly and mitigate shareholder losses during a subsequent market crash. This could occur even if managers do not choose reporting policies explicitly with an intent to lessen shareholder losses during an unforeseeable crash, because the information costs in security markets that managers have incentives to reduce are probably a function of predisclosure noise in fundamental values. Under this explanation, higher quality financial reporting reduces noise in fundamental values and lessens the extent to which stock prices are subject to large run-ups followed by sharp declines.9 A third possible explanation is that financial reporting quality proxies for managerial quality. Prior research suggests that more talented or diligent managers 7In the context of human judgment and decision-making research, ‘‘noisy fundamentals’’ can be thought of as a task complexity problem in equity valuation. Wood (1986) suggests that task complexity is a function of three components: (1) the number of actions required to complete the task, (2) the complexity of the relation between inputs (e.g., information cues) and actions (e.g., forecasting earnings), and (3) the likelihood of a change in the relation between inputs and actions. The third component represents nonstationarity in the causal relation between inputs and actions, and seems most akin to the ‘‘noisy fundamentals’’ construct described in economics-based theories of market crashes. 8Other related theoretical work on speculative bubbles includes Harrison and Kreps (1978), Allen et al. (1993, 2003), and Scheinkman and Xiong (2003). 9We examine the association between crash-period returns and ex ante financial reporting quality, but do not predict or test the information content of contemporaneous accounting numbers during a market crash. Keating et al. (2003) provide evidence suggesting that accounting numbers may convey new information associated with stock price declines during a market crash. Bowen et al. (1989) show that earnings may be priced differently during a crash.
- 11. ARTICLE IN PRESS J. Barton, G. Waymire / Journal of Accounting and Economics 38 (2004) 65–116 75 will select higher quality reporting. This allows the firm to issue equity at higher prices either because the manager has committed to greater monitoring through higher quality reporting to reduce agency costs (Jensen and Meckling, 1976; Watts and Zimmerman, 1986), or because he has chosen reporting attributes (e.g., more intensive auditing) that signal the firm’s superior future prospects, which are likely better for firms with more talented managers (Titman and Trueman, 1986; Trueman, 1986; Datar et al., 1991). If the market decline in October 1929 results from information about deteriorating macroeconomic conditions and investors perceive that higher quality managers will be better able to adjust their firms’ operating and investment decisions in response to these changes, then higher quality reporting firms would experience less negative October 1929 returns, all else equal.10 3. Sample We first identify all firms listed on the monthly database of the Center for Research in Security Prices (CRSP) as traded on the New York Stock Exchange (NYSE) in October 1929. Of the 710 firms listed, only 494 had been listed in December 1925, the first month that returns are available on CRSP. Almost half of the remaining ‘‘newly listed’’ firms entered the database in 1929. We exclude 72 railroads (2-digit SIC code 40) and 28 financial services firms (2-digit SIC codes 60–67) because reporting practices in these industries are highly idiosyncratic, making it impossible to develop comprehensive proxies for financial reporting quality comparable with those of other industries.11 We use monthly stock returns 10The late 1920s’ expansion peaked in August 1929 and the Federal Reserve recognized modest deterioration in macroeconomic conditions in late September 1929 (Meltzer, 1976). The Great Depression of the early 1930s was among the worst periods of macroeconomic performance in American history. The massive drop in output in this period has been linked to Federal Reserve actions that reduced the money supply and led to deflation (Friedman and Schwartz, 1963). Some scholars also believe that the Great Depression was exacerbated by passage of the Smoot–Hawley Tariff Act, whose effects were transmitted through direct channels and indirectly when price deflation raised the real level of many tariffs (Crucini and Kahn, 1996; Irwin, 1998). Whether the Smoot–Hawley Act caused the stock market crash in October 1929 is unclear. President Hoover ran on a protectionist platform in 1928 and tariff legislation was introduced after he took office in March 1929. At the same time, high tariffs were already in place in the U.S. before 1929, and the Smoot–Hawley bill was stalled in Congress in Fall 1929 and not enacted until June 1930 (Dye and Sicotte, 2001). Because of this uncertainty and the difficulty of measuring the effects of the Smoot–Hawley Act on any particular firm, we do not control for these political actions in our tests. 11The reporting practices of railroads differed in fundamental ways from those of industrials before 1930. Railroads voluntarily supplied extensive interim earnings information and nonfinancial data beginning in the 19th century (Chandler, 1977, pp. 109–121; Boockholdt, 1978; Miranti, 1989; Sivakumar and Waymire, 2003). They also were subject to inspection by examiners of the Interstate Commerce Commission after 1906, and some chose therefore to forego purchase of an external audit (DeMond, 1951, pp. 83–84). These differences impede reliable measurement of proxies that capture cross-sectional differences in financial reporting quality. Note that our sample selection criteria do not exclude electric utilities and other regulated firms. We retain utilities since many of these firms’ reporting policies were subject to intense scrutiny after the 1929 market crash. We discuss control variables needed by this research design choice in Section 5. Excluding these variables and the 30 regulated firms in our sample still leads to similar inferences.
- 12. ARTICLE IN PRESS 76 J. Barton, G. Waymire / Journal of Accounting and Economics 38 (2004) 65–116 from CRSP, share trading volume from the NYSE’s Monthly and Yearly Record published in The Commercial and Financial Chronicle, and financial reporting data from Moody’s Investment Manual. The data in Moody’s include ‘‘practically all official information available concerning all the more important companies’’ (Jones, 1935, p. 611). Moody’s data also are used commonly in historical studies of pre-SEC U.S. financial reporting practices (Benston, 1973; Ely and Waymire, 1999). We further exclude 39 firms with incomplete CRSP data to construct the returns-based variables in our tests (e.g., equity beta, stock return autocorrelation), 6 firms without share turnover data for the second and third calendar quarters of 1929, and 25 firms without annual reports in Moody’s. Our final sample consists of 540 firms. Table 1 reports the mean and median values of market capitalization on September 30, 1929, age (measured as the number of months since the firm was first listed on CRSP), and October 1929 stock returns for the groups of firms excluded from our sample. The table indicates first that the 72 deleted railroads are large, mature firms that experienced less negative returns in October 1929 (mean of 13.7% vs. 21.75% for the final sample). This return differential suggests that including railroads may introduce a bias in favor of finding a positive relation between October 1929 returns and proxies for financial reporting quality. Financial service firms and those lacking financial statements in Moody’s are similar to the final sample in terms of October 1929 returns (means of 23.51% and 21.13%, respectively). The six firms without share turnover data are probably too few to exert a material influence on our results even though their mean October 1929 return (11.72%) is less negative than that for the final sample. Finally, the 39 firms dropped for lacking CRSP data not surprisingly tend to be very young (i.e., ‘‘newly listed’’).12 4. Historical context 4.1. Corporate reporting before October 1929 Shortly after 1900, external financial reporting of U.S. industrial corporations was relatively limited as many firms provided sparse, if any, financial statements (Hawkins, 1963; Brief, 1987; Sivakumar and Waymire, 1993). State incorporation laws required firms to disclose annual reports but did not stipulate their form or content. The reports of railroads and utilities were more extensive because the Interstate Commerce Commission and various state commissions mandated these firms’ financial reporting policies (Jarrell, 1979; Miranti, 1989; Sivakumar and Waymire, 2003). 12Because we control directly for firm age in our multivariate analyses, these missing observations should lead mostly to inefficiency as long as there is sufficient variation in firm age in the final sample (see Greene, 2000, pp. 259–263). Our final sample appears to reflect such variation. We discuss this issue in more detail in Section 6.1.
- 13. ARTICLE IN PRESS J. Barton, G. Waymire / Journal of Accounting and Economics 38 (2004) 65–116 77 Table 1 Characteristics of firms deleted in the sample selection process Sample selection criteria N Market capitalization on September 30, 1929 (in $ million) Months on CRSP Stock return in October 1929 Mean Median Mean Median Mean Median Initial sample 710 Firms excluded Railroads 72 $127.7 $36.4 44.3 46.0 13.70% 11.15% Financial services 28 69.7 37.9 29.4 38.5 23.51 19.93 Firms with 39 67.2 23.7 3.5 2.0 29.22 28.92 incomplete monthly returns on CRSP Firms with incomplete share turnover data 6 158.0 63.5 40.8 46.0 11.72 17.19 Firms without financial statements in Moody’s 25 316.2 21.3 37.2 46.0 21.13 20.00 Final sample 540 $98.3 $21.5 37.5 46.0 21.75% 20.03% The initial sample consists of 710 firms listed on the New York Stock Exchange in October 1929. Returns are adjusted for dividends and stock splits. Over the next three decades, corporate reporting gradually became more informative as managers responded to the demands of bankers and other financial statement users for more extensive disclosure (Hawkins, 1963). Managers of firms seeking debt financing had incentives to supply such information, consistent with research suggesting a longstanding demand for accounting information in connection with debt contracting (Watts, 1977). Increased dispersion in equity ownershipalso led to more extensive financial reporting. NYSE listing agreements began requiring exchange-traded firms to disclose more information (Shultz, 1936, pp. 16–22). Shortly after 1900, these agreements required industrial corporations to disclose annual financial statements subsequent to listing; after 1910, the agreements typically included commitments to disclose interim earnings data. However, compliance with listing agreements was essentially voluntary before 1929 as the NYSE rarely enforced them (Hawkins, 1963).13 Writers at the time perceived that the separation of ownership and control during the early 20th century, along with less developed corporate governance mechanisms, allowed managers to operate firms more for their own interest than for the interest of 13Income tax laws also influenced directly the amount of information available to shareholders (Mills and Plesko, 2003). With passage of income tax laws beginning in 1909, shareholders could access the firm’s tax returns in some years. In other years, the amount of tax paid was a matter of public record. The practice of making tax payments and returns matters of public record ceased in February 1926.
- 14. ARTICLE IN PRESS 78 J. Barton, G. Waymire / Journal of Accounting and Economics 38 (2004) 65–116 shareholders (Ripley, 1927, pp. 37–38; Berle and Means, 1932). Because most managers controlled external financial reporting, they allegedly could mask the effects of agency problems by manipulating accounting numbers or suppressing the disclosure of relevant information. Such behavior was difficult to penalize because managers’ legal liability for misleading or fraudulent financial reporting was far more limited than today (Benston, 1973). However, managers’ decisions to suppress disclosure also may be consistent with shareholder interests. Some managers did not disclose revenues or interim earnings on grounds that competitors would use such information to erode the firm’s competitive advantage (Ripley, 1927, p. 188; Benston, 1973, p. 144). The early 20th century also was marked by government hostility toward large corporations, which was reflected in the passage of antitrust laws like the 1890 Sherman Act and the 1914 Clayton Act. Managers thus had strong incentives to avoid political costs by suppressing or manipulating information, especially with respect to their firms’ profitability (Sivakumar and Waymire, 2003). The development of accounting and auditing principles was in its infancy in the 1920s (Ely and Waymire, 1999). Pre-SEC accounting principles were more like norms developed in practice (Moonitz, 1970); firms sometimes deviated from these norms without disclosing specific accounting policies (Ripley, 1927, p. 194). Only after the 1929 stock market crash did the NYSE require listed firms to disclose their accounting policies (Shultz, 1936). In the early 1930s, the NYSE began cooperating with the American Institute of Accountants to developa statement of basic accounting principles (Miranti, 1986, pp. 458–460). In the 1920s, there were no federal or NYSE requirements for external auditing of financial statements. Although the NYSE did not require audits until 1934, most listed companies had purchased audits voluntarily by the mid-1920s (May, 1926), consistent with substantial private incentives to produce credible accounting information (Watts and Zimmerman, 1983). Early 20th-century writers believed that, even though auditors had limited power in disputes with management, audits increased the accuracy of financial statements and mitigated managerial optimism in financial reporting (Montgomery, 1913; Moss, 1914). 4.2. The stock market and equity valuation in the 1920s The stock market environment of the 1920s was similar to that of the 1990s (Chancellor, 1999, pp. 225–232; Shiller, 2000, pp. 7–8). For instance, the closest parallel to the aggregate price-earnings ratio of 44 in early January 2000 is September 1929, when the ratio stood at 33. Like the high earnings growth rates in the five-year period ending in 1997, earnings more than quadrupled over 1921–1926 as the economy emerged from a severe recession. Moreover, like the 1990s, the 1920s was a period of rapid technological innovation—in the 1990s, it was the personal computer, the Internet and biotechnology; in the 1920s, it was the automobile, radio broadcasting, electricity and electric household appliances. Indeed, even modern buzzwords like ‘‘New Economy’’ describing the 1990s resemble those like ‘‘New Era’’ describing the 1920s (Graham and Dodd, 1934, pp. 307–316; Ip, 2000).
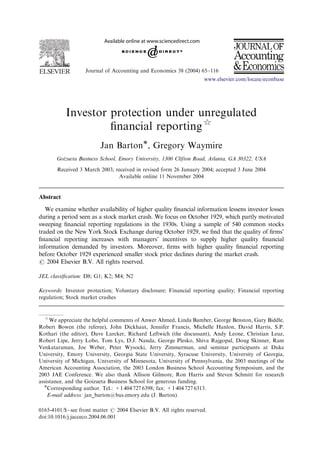
- 15. ARTICLE IN PRESS J. Barton, G. Waymire / Journal of Accounting and Economics 38 (2004) 65–116 79 The NYSE was the preeminent U.S. stock market at the time, accounting for a substantial majority of trading volume (Bernheim and Schneider, 1935, pp. 222–238, 748). As in modern times, NYSE trading took place in a continuous specialist market with transaction data distributed rapidly through the financial press and wire services. Although the number of brokerage houses expanded by over 80% in the second half of the 1920s (Chancellor, 1999, p. 199), relatively fewer analysts and other sophisticated intermediaries participated in the decade’s equity markets compared to today (Ely and Waymire, 1999, p. 25). Nevertheless, stock prices still reflected fundamental analysis, as they captured information not only in financial statement aggregates like earnings and equity book value, but also in more complex items such as intangible assets (Ely and Waymire, 1999). An often cited reason for the 1920s’ bull market was the entry of inexperienced investors into the market. For example, investment trusts (the equivalent of modern-day mutual funds) allowed inexperienced investors to participate in the stock market. These trusts increased from about 160 in 1926 to over 750 by 1929 (Galbraith, 1972). New individual investors also accounted for a sizable portion of share turnover (White, 1990; Chancellor, 1999, pp. 204–205). The NYSE had no restrictions on insider trading or short selling. Insider trading was perceived to be widespread; insiders were alleged to create additional buying by uninformed outsiders, leading to price run-ups that insiders could exploit profitably (Thomas and Morgan-Witts, 1979). In contrast, short selling was limited in the late 1920s, with short interests representing less than 1% of the total NYSE shares outstanding (Carret, 1930; Meeker, 1932). Shorting costs were not particularly high, suggesting that low levels of short interest reflected investors’ unwillingness to undertake short positions (Jones and Lamont, 2002). Because many short sellers incurred large losses during the 1920s’ bull market, ‘‘few had the hardihood to sell short’’ prior to the 1929 crash (Meeker, 1932). This pattern is consistent with theories of market crashes in which short sellers exit the market during a sustained price run-up (Hong and Stein, 2003). Fig. 1 depicts the cumulative monthly return on CRSP’s value-weighted index from January 1, 1926, through December 31, 1935. The figure shows that the cumulative market return rose steadily through the end of 1928 and leveled off during the first half of 1929. Following another rise during the third quarter of 1929, the cumulative market return dropped sharply in October 1929 (depicted by the darker segment in the graph). Untabulated analyses show that average price-to-book and price-to-earnings ratios also rose over the four years preceding the market crash, consistent with stock prices increasing relative to fundamentals. Moreover, average quarterly share turnover rose before October 1929, consistent with heightened investor uncertainty prior to the crash (Hong and Stein, 2003; Chen et al., 2001). Table 2 reports summary statistics for the cross-sectional distribution of sample firms’ stock returns in October 1929 and the surrounding three years. Stock prices dropped on average 21.75% in October 1929, when more than 96% of the firms experienced negative stock returns. October 1929 mean returns are significantly more negative than returns in August, September, November or December of 1929.
- 16. ARTICLE IN PRESS 80 J. Barton, G. Waymire / Journal of Accounting and Economics 38 (2004) 65–116 200% 150% 100% 50% 0% -50% -100% Jan. 1926 Jul. 1926 Jan. 1927 Jul. 1927 Jan. 1928 Jul. 1928 Jan. 1929 Jul. 1929 Jan. 1930 Jul. 1930 Jan. 1931 Jul. 1931 Jan. 1932 Jul. 1932 Jan. 1933 Jul. 1933 Jan. 1934 Jul. 1934 Jan. 1935 Jul. 1935 Month Cumulative market return Fig. 1. Cumulative value-weighted market return from January 1, 1926, until December 31, 1935, based on all firms included on the CRSP database. The darker line in the graph represents the drop in cumulative market return during October 1929. Returns in these last three months are predominantly negative. October 1929 returns were significantly more negative than mean and compounded monthly returns over October 1926–September 1929, when more than two-thirds of the firms experienced positive returns. October 1929 returns also were significantly more negative on average than monthly returns over November 1929–October 1932, the period marking the beginning of the Great Depression, when over three-fourths of sample firms also experienced negative returns. The average buy-and-hold return over the October 1929–October 1932 period (73.84%) nearly wiped out the average buy-and-hold return over the three years preceding October 1929 (82.40%). 5. Financial reporting quality and managers’report ing incentives before October 1929 In this section, we provide evidence on H1, the hypothesis that managers select reporting policies in an unregulated environment by factoring in investors’ demand for information. We begin by discussing our proxies for financial reporting quality. Next, we describe the independent variables in our reporting choice model, which capture cross-sectional variation in market information costs, potential contracting and control conflicts, proprietary disclosure and political costs, and the availability of alternative information. We conclude the section by presenting our findings.
- 17. ARTICLE IN PRESS J. Barton, G. Waymire / Journal of Accounting and Economics 38 (2004) 65–116 81 Table 2 October 1929 stock returns compared to returns in surrounding three-year period Period Mean Median Standard deviation % Negative October 1929 return 21.75% 20.03% 14.64% 96.1 Adjacent months August 1929 return 2.67*** 1.09*** 12.53*** 44.4*** September 1929 return 4.35*** 4.69*** 11.27*** 70.9*** November 1929 return 11.84*** 12.50*** 14.19 85.2*** December 1929 return 3.35*** 2.14*** 14.59 57.8*** October 1926–September 1929 Average monthly return 1.61*** 1.60*** 2.95*** 24.3*** Compounded monthly return 0.93*** 1.17*** 2.82*** 31.9*** Buy-and-hold return 82.40*** 38.52*** 152.08*** 31.9*** November 1929–October 1932 Average monthly return 1.21*** 1.51*** 2.75*** 76.9*** Compounded monthly return 4.17*** 4.24*** 2.88*** 95.2 Buy-and-hold return 66.57*** 78.05*** 32.56*** 95.2 The sample consists of 540 firms listed on the New York Stock Exchange in October 1929, excluding railroads and financial services firms (2-digit SIC codes 40 and 60–67). Returns are based on all monthly data available on the CRSP database. The buy-and-hold return, RBH, is the gross return from the earliest to the latest month in the holding period (e.g., October 1927 to September 1929); the compounded monthly return is (1+RBH)(1/k) – 1, where k is the number of months over which RBH is calculated (e.g., 24 in the case of a return over October 1927–September 1929). All returns are adjusted for dividends and stock splits. ***denotes significantly different from October 1929 at the 0.01 level or better, based on two-tailed tests. 5.1. Measuring financial reporting quality Since widely accepted definitions of financial reporting quality do not exist, we focus on measurable attributes that are likely correlated with reporting quality. To avoid introducing hindsight bias into our tests, we base our quality measures on attributes seen as important by knowledgeable 1920s’ critics of corporate reporting (e.g., Ripley, 1927; Sloan, 1929).14 We then perform a principal factor analysis on these measures to extract a proxy for the underlying, unobserved quality construct. Our measures emphasize the transparency and credibility of publicly disclosed annual financial statements. Transparency is important since it allows financial statement users to understand better key components of income and net assets. We measure transparency separately for the income statement and the balance sheet. Financial reporting credibility is partly a function of the extent to which the financial statements provide objective evidence that reported income and net assets are not 14For example, choosing quality measures based on attributes emphasized in congressional hearings before the passage of the Securities Acts could introduce hindsight bias into our tests. This would occur if interested parties selected the reporting attributes emphasized in congressional hearings purely because a few firms with large investor losses during the crash exhibited such attributes.
- 18. ARTICLE IN PRESS 82 J. Barton, G. Waymire / Journal of Accounting and Economics 38 (2004) 65–116 overstated. Hence, we also include measures reflecting the existence and quality of external audits and the extent to which accounting conservatism influences the firm’s financial reporting. We construct our measures using annual data in Moody’s for the most recent fiscal year ending no later than June 30, 1929. We measure income statement transparency (ISTRANSP) based on the separate disclosure of sales, cost of sales, depreciation expense, tax expense, and other operating expenses. Financial statement users saw the disclosure of these items as important in identifying the underlying economic drivers of firm performance (Ripley, 1927, pp. 171–186; Sloan, 1929, pp. 59–61, 109–131). ISTRANSP is coded 0–5 based on the count of separate items disclosed in the firm’s income statement. The maximum value of 5 applies to firms that disclosed all five items; firms that disclosed no item were coded 0. We measure the transparency of the balance sheet (BSTRANSP) based on separate disclosures about fixed assets, intangibles, surplus and reserves. Like ISTRANSP, BSTRANSP is the sum of five indicator variables. The first is coded 1 (0 otherwise) if the net value of property, plant and equipment is reported (indicating that fixed assets had been subject to depreciation at some time), and the second indicator is coded 1 (0 otherwise) if the depreciation reserve also is revealed. The third indicator equals 1 (0 otherwise) if intangible assets were accorded separate line-item disclosure, the fourth equals 1 (0 otherwise) when earned surplus was reported separately from capital surplus, and the fifth indicator equals 1 (0 otherwise) if reserves other than depreciation also are reported separately. Thus, BSTRANSP ranges from 0 to 5, where firms reporting all items (none) receive scores of 5 (0). Prior research establishes a centuries-old demand for independent audits to reduce agency costs (Watts and Zimmerman, 1983). If larger auditors have stronger reputation-based incentives to provide high quality audits, financial statements audited by larger auditors are likely perceived as more credible (DeAngelo, 1981). AUDITOR is coded 2 if the firm’s financial statements were audited by one of the nine largest auditors at the time, 1 if they were audited by a small auditor (i.e., all other auditors), and 0 if they were not audited.15 Finally, we measure accounting conservatism (CONSERV) based on firms’ reported intangible asset values.16 We include conservatism as a quality measure because it is an optimal response to managers’ incentives to overstate net assets and income (Watts, 2003). During the 1920s, creditors preferred balance sheets that were ‘‘clean’’ with respect to questionable assets like intangibles because reporting practices for intangibles varied considerably across firms ((Lagerquist, 1922, pp. 56–61, Ely and Waymire, 1999, pp. 20–25). By valuing intangibles at nominal 15According to Merino et al. (1994), the nine largest auditors at the time were (in descending order) Price Waterhouse; Ernst and Ernst; Haskins and Sells; Arthur Young; Peat, Marwick and Mitchell; Lybrand, Ross Brothers and Montgomery; Barrow, Wade and Guthrie; Delloite, Plenders and Griffin; and Touche Niven. We assume that managers not disclosing the name of an external auditor did not issue audited financial statements. 16Data limitations underlie this design choice. For instance, many firms did not disclose information that would allow us to construct accruals-based measures of conservatism (Givoly and Hayn, 2000), and we lack sufficient data to estimate models of asymmetric income timeliness (Basu, 1997).
- 19. ARTICLE IN PRESS J. Barton, G. Waymire / Journal of Accounting and Economics 38 (2004) 65–116 83 amounts (e.g., $1), managers could communicate the economic existence of intangibles. More important, nominal values most likely indicate the immediate expensing of intangibles’ costs for financial reporting purposes, suggesting that earnings and net assets are less likely to be overstated (Graham and Meredith, 1937, pp. 21–23). CONSERV takes on the value 1 (0 otherwise) if the firm reported intangible assets at nominal amounts on the balance sheet. The appendix provides two examples that show our coding of financial reporting quality. The first example is General Mills, Inc., which we view as a higher quality reporter because it provides a disaggregated income statement (ISTRANSP=5), separately discloses both net PPE and depreciation reserves, and breaks out intangibles, earned surplus and other reserves (BSTRANSP=5). This firm also is audited by a large auditor (AUDITOR=2) and carries intangible assets at $1 (CONSERV=1). The second example is United States Tobacco Company, which we consider to be a lower quality reporter. This firm reports no information on income components (ISTRANSP=0), discloses intangible assets separately from fixed assets on the balance sheet (BSTRANSP=1), mentions no auditor (AUDITOR=0), and reports material carrying values for intangible assets (CONSERV=0). Table 3 describes the distribution of sample firms across levels of financial statement transparency, audit quality and conservatism. Panel A shows the percentage of sample firms disclosing separately the selected financial statement items. With respect to the income statement, 63% of the firms disclose sales but only 25.6% report cost of sales; 76.7% (74.4% | 74.1%) disclose separately depreciation expense (other operating expenses | income tax expense). For the components of balance sheet transparency, 91.7% report the net book value of PPE and 75% the total depreciation reserve; 84.6% of the firms report a separate line for reserves; and 49.8% and 33.3% report intangibles and earned surplus separately. Panel B shows that 44.3% disclose either four or more income statement items and only 11.6% disclose one or none. In terms of balance sheet transparency, 48.4% disclose four or more items and only 6.4% disclose one or none. Finally, 59.8% (20.4% | 19.8%) of the firms are coded as having large (small | no) auditors, and 18.9% as having conservative financial statements. Panel A of Table 4 presents Pearson correlations between the four measures of financial reporting quality. Except for the correlation between ISTRANSP and CONSERV, all pairwise correlations are positive (two-tailed po0.10). We perform a principal factor analysis to extract underlying factors explaining the correlation structure of these four measures. Preliminary tests based on maximum likelihood factoring suggest that a single factor summarizes the information better than no factor (w2 ð4Þ ¼ 93:97; po0.01) and just as well as two or more factors (w2 ð2Þ ¼ 1:05; p ¼ 0:59). Thus, we retain one factor only, which we extract iteratively to obtain a more accurate estimate. Panel B presents the factor analysis results.17 The first factor (i.e., the one we retain) has the largest eigenvalue (0.87 vs. 0.03 for the second factor) and accounts 17As a robustness check, we reestimate the factor analysis presented in Table 4 after excluding 12 firms identified as multivariate outliers using the technique described in Hadi (1992). Our inferences remain unaffected.
- 20. ARTICLE IN PRESS 84 J. Barton, G. Waymire / Journal of Accounting and Economics 38 (2004) 65–116 Table 3 Sample firms across levels of financial reporting quality Panel A: percentage of firms disclosing selected financial statement items Income statement item disclosed % Balance sheet item disclosed % Sales 63.0 Property, plant and equipment (net) 91.7 Cost of sales 25.6 Depreciation reserve 75.0 Depreciation expense 76.7 Reserves other than for depreciation 84.6 Other operating expenses 74.4 Intangible assets 49.8 Income tax expense 74.1 Earned surplus 33.3 Panel B: percentage of firms across levels of financial statement transparency, audit quality and conservatism ISTRANSP % BSTRANSP % AUDITOR % CONSERV % 5 items 17.8 5 items 11.9 2 (Large) 59.8 1 (Yes) 18.9 4 26.5 4 36.5 1 (Small) 20.4 0 (No) 81.1 3 21.3 3 33.0 0 (None) 19.8 2 22.8 2 12.2 1 9.4 1 5.9 0 2.2 0 0.5 Total 100.0 Total 100.0 Total 100.0 Total 100.0 The sample consists of 540 firms listed on the New York Stock Exchange in October 1929, excluding railroads and financial services firms (2-digit SIC codes 40 and 60–67). Financial reporting variables are for the most recent fiscal year ending no later than June 1929. The variables are defined as ISTRANSP=Number of following items disclosed: sales, cost of sales, depreciation expense, other operating expenses, income tax expense. BSTRANSP=Number of following items disclosed: property, plant and equipment (net of accumulated depreciation); intangible assets; depreciation reserve; reserves other than for depreciation; earned surplus. AUDITOR=2 if the firm’s financial statements were audited by one of the nine largest auditors at the time, based on Merino et al. (1994); 1 if they were audited by a small auditor (i.e., all other auditors); 0 if they were not audited. CONSERV=1 if the firm reported on the balance sheet intangibles assets valued at nominal amounts (e.g., $1), 0 otherwise. for essentially all the shared correlation among ISTRANSP, BSTRANSP, AUDITOR and CONSERV.18 To obtain an estimate of the unobserved true values of the underlying factor, we combine the four original variables using the scoring coefficients reported in the first column of Panel C. The second column shows the Pearson correlations between the factor and the original variables; these range from 0.52 to 0.73. Consequently, we label the retained factor QUALITY.19 18Had we retained all factors with positive eigenvalues, the first factor would have accounted for about 82% of the shared variation in the four measures. 19Scholars have measured reporting quality in other ways that may be superior to our measure. As already noted, Bushman et al. (2004a) extract a comprehensive corporate transparency measure from international data. Khanna et al. (2004) examine firm-specific transparency and disclosure scores compiled by Standard and Poor’s. Others have measured financial reporting quality based on earnings management and income smoothing-type measures (Lang et al., 2003; Leuz et al., 2003; Haw et al., 2004). Our measure is highly specific to the context we examine and should not be interpreted as a superior measure of reporting quality for applications other than the historical setting we examine.
- 21. ARTICLE IN PRESS J. Barton, G. Waymire / Journal of Accounting and Economics 38 (2004) 65–116 85 Table 4 Principal factor analysis of financial reporting quality variables Panel A: Pearson correlations between financial reporting quality variables ISTRANSP BSTRANSP AUDITOR BSTRANSP 0.18*** — — AUDITOR 0.08* 0.23*** — CONSERV 0.05 0.28*** 0.13*** Panel B: iterated principal factors (one factor retained) Factor Eigenvalue Proportion explained Cumulative proportion 1 0.87 1.00 1.00 2 0.03 0.04 1.04 3 0.01 0.01 1.05 4 0.04 0.05 1.00 Panel C: scoring coefficients of retained factor (Factor 1 in Panel B) and correlations with financial reporting quality variables Variable Scoring coefficient Pearson correlation ISTRANSP 0.551 0.52*** BSTRANSP 0.649 0.73*** AUDITOR 0.558 0.58*** CONSERV 0.563 0.59*** The sample consists of 540 firms listed on the New York Stock Exchange in October 1929, excluding railroads and financial services firms (2-digit SIC codes 40 and 60–67). Financial reporting variables are for the most recent fiscal year ending no later than June 1929. The variables are defined in Table 3. *** and * denote significant at the 0.01 and 0.10 levels based on two-tailed tests. 5.2. Financial reporting choice model and definition of independent variables We test H1, the hypothesis that unregulated financial reporting reflects managers’ incentives to disclose higher quality information to investors, by estimating the following cross-sectional model: QUALITYi ¼ b0 þ b0 1 INCENTIVESi þ i ; (1) where, for firm i, QUALITY is the combined measure obtained from the principal factor analysis results in Table 3, INCENTIVES is a vector of variables capturing managers’ incentives to report higher quality financial statements, bs are parameters and is an error term. We argue that QUALITY is a choice variable that managers select in response to incentives induced by equity market forces, private contracts and other external factors. This choice varies across firms because different managers expect different net benefits associated with providing higher quality financial statements. We predict that managers will select higher quality financial reporting when (1) information costs in equity markets are large, (2) the potential for contractual and control conflicts among claimants to the firm’s assets is high, (3) the firm does not face
- 22. ARTICLE IN PRESS 86 J. Barton, G. Waymire / Journal of Accounting and Economics 38 (2004) 65–116 potentially adverse responses from competitors and regulators due to its superior product market performance, and (4) alternative information is not available for shareholders to use in valuing their equity claims and monitoring management.20 Firms with diffuse equity ownershipha ve shares traded in large secondary markets like the NYSE, generating costs associated with information asymmetry (e.g., private information production costs and higher market-making costs). Managers have incentives to disclose voluntarily information that mitigates this problem (Diamond, 1985; King et al., 1990) since lower information asymmetry reduces the firm’s cost of capital (Botosan, 1997; Healy and Palepu, 2001; Verrecchia, 2001). We expect that shareholders’ demand for information is likely greater for young, high risk firms in emerging industries and with future prospects linked to technological innovation. Further, managers’ incentives to reduce information asymmetry are more pronounced for better-performing firms that are raising equity capital. Thus, INCENTIVES includes six variables capturing firm age, technology dependence, earnings volatility, equity risk, profitability and recent equity issuance. We measure firm age (AGE) as the number of months before October 1929 since the firm was first listed in the CRSP database; we expect the coefficient on AGE to be negative.21 Assessing future earnings is more difficult when the firm is investing in rapidly changing technological innovations with highly uncertain future payoffs. TECH is coded 1 (0 otherwise) if the firm operated in a technology-based industry; we expect its coefficient to be positive.22 We measure earnings volatility (CVEARN) as the coefficient of variation in net income over the previous five years (or fewer, depending on data available in Moody’s); we expect the coefficient on CVEARN to be positive. We measure equity risk as the beta (BETA) from a firm-specific value-weighted market model, based on all available returns in the CRSP database between December 1925 and September 1929; we expect its coefficient to be positive.23 Managers are more likely to disclose financial information voluntarily when their firms enjoy strong performance (Lang and Lundholm, 1993; Dye, 2001; Miller, 2002). We measure performance based on the firm’s return on equity (ROE), calculated as net income divided by shareholders’ equity; we expect its coefficient to 20Our predictions in this section are couched in terms of our measure of overall reporting quality. The underlying components of QUALITY likely will be associated differently with the independent variables in our reporting choice model. Conceivably, we could lay out predictions for how specific independent variables are expected to affect different components of quality. To keep our discussion clear and to the point, however, we defer discussion of such differences until we perform additional tests using the four components of QUALITY as separate dependent variables in Eq. (1). 21Our inferences remain unchanged when we use as alternative proxies for firm age the natural logarithm of AGE or the number of months since the firm incorporated. 22We define technology firms as those in the following industries: aircraft (3-digit SIC code 372), automotive (371), communications (481, 482, 489), electronics (363, 366, 369), film and entertainment (781, 783, 791), industrial machinery (351–356), office equipment (357), photography (381, 383, 384, 387), and electric utilities (491, 493). Oliver (1956) discusses technological innovations during the 1920s. 23Using the standard deviation of prior returns yields similar results.
- 23. ARTICLE IN PRESS J. Barton, G. Waymire / Journal of Accounting and Economics 38 (2004) 65–116 87 be positive.24 Managers have strong incentives to select higher quality financial reporting to reduce the cost of equity capital when accessing capital markets to finance investments (Frankel et al., 1995; Lang and Lundholm, 2000). We proxy managers’ access to the equity capital markets based on whether they issued stock before October 1929. ISSUE is coded 1 (0 otherwise) if the firm issued common equity (i.e., if shares outstanding increased by more than 5%, after accounting for stock splits and dividends) between October 1927 and September 1929, the two-year period preceding the market crash; we expect the variable’s coefficient to be positive. Corporate governance generates a demand for accounting information (Bushman and Smith, 2001). This demand arises because information can reduce agency costs through private contracting (Jensen and Meckling, 1976; Watts and Zimmerman, 1986) or costs associated with ex post contractual and legal disputes (La Porta et al., 2000). We include four variables that proxy for the agency costs of debt, the potential for ex post disputes among investors over income measurement and distribution, and the extent of control by majority shareholders or management over decision rights within the firm. Managers’ incentives to supply higher quality financial statements increase with the level of shareholder–debtholder agency conflicts. As the agency costs of debt increase, shareholders agree to restrict managers’ actions and to prepare financial statements needed to enforce such restrictions (Watts, 1977; Smith and Warner, 1979). Agency conflicts potentially increase with the amount of leverage in the firm’s capital structure, so we predict that managers of more levered firms will issue higher quality financial reports. We measure leverage (LEVERAGE) as the book value of debt and preferred stock divided by common shareholders’ equity, and expect its coefficient to be positive. Some firms have capital structures that are more likely to lead to disputes over the distribution of income. For instance, the board of a firm with noncumulative preferred stock may have incentives to omit preferred dividends to increase future common dividends. In such a case, higher quality financial reporting would reduce, at the margin, potential conflict over payout policy (Ahmed et al., 2002). We proxy for the presence of income measurement conflicts using a variable (INCCONF) coded 1 (0 otherwise) if the firm has income bonds, noncumulative preferred stock or another stock (either preferred or a second class of common stock) with participation rights. We expect the coefficient on INCCONF to be positive. We include two variables measuring control over decision rights. The first, CONTCONF, measures the potential for control conflicts that could harm minority shareholders. We expect minority shareholders to demand better information when 24This measure is affected by managers’ choice of conservatism. By carrying intangibles at nominal values, owners’ equity is understated. We measure ROE without adjusting the denominator for conservatism because (1) the treatment of intangibles’ costs on income measurement (affecting the numerator of ROE) cannot be disentangled, and (2) by including material intangibles in the asset base, the manager is making an explicit representation that the amounts are for assets that will generate future benefits.
- 24. ARTICLE IN PRESS 88 J. Barton, G. Waymire / Journal of Accounting and Economics 38 (2004) 65–116 they exert as a groupless control over corporate decisions and thus face greater risk of wealth expropriation (La Porta et al., 2000). CONTCONF equals 1 (0 otherwise) if a voting trust or another company controls the firm through majority ownership, the firm has a second class of outstanding voting common stock, or outstanding preferred equity allows unrestricted voting even in the absence of financial distress. We expect the coefficient on CONTCONF to be positive. A second decision-rights control variable captures the firm’s state of incorporation. As in modern times, U.S. corporations in the 1920s were chartered by the states, and the state that granted managers the broadest and most flexible decision rights was Delaware (Berle, 1929). The Delaware charter law in effect in mid-1929 placed few restrictions on managers other than those specifically added to the firm’s charter or the implicit restrictions on self-dealing and other inequitable behavior enforced by the courts. We expect that the value of financial reporting will be higher for firms chartered in Delaware since managers’ broader decision rights should result in more intensive monitoring by shareholders. We include an indicator variable (DELAWARE) coded 1 (0 otherwise) for firms chartered in Delaware and expect its coefficient to be positive. Managers’ choice of financial reporting policies is conditioned on the expected reactions of competitors and regulators to the information disclosed. Firms that are successful in product markets can induce strategic responses such as product price cuts by existing competitors or encourage market entry by potential competitors (Darrough and Stoughton, 1990; Wagenhofer, 1990; Harris, 1998). High profitability also can attract regulatory attention, generating political costs ultimately borne by shareholders (Watts and Zimmerman, 1986, pp. 234–238; Jones, 1991). We expect that shareholders would prefer managers to suppress disclosure of information that would be used adversely by competitors and regulators.25 Thus, we predict a negative relation between competitive and regulatory threats and the quality of financial reporting. One measure of exposure to such threats is the firm’s market share, which is difficult to measure for our sample since many firms do not disclose sales data. Assuming that asset turnover is roughly constant across firms within an industry, we calculate market share (MKTSHR) based on total assets. MKTSHR is defined as the firm’s total assets divided by the sum of total assets of all sample firms in the same 2-digit SIC code; we expect its coefficient to be negative. We also include a measure of the firm’s absolute size to capture political costs (Watts and Zimmerman, 1978). We measure firm size (SIZE) as the natural logarithm of total assets and expect its coefficient to be negative. Finally, external financial reporting will be less useful to shareholders if they have alternative information to value equity claims and monitor management. Because a history of dividend payments (DIVIDEND) is a natural benchmark against which investors can assess equity values, dividends partly substitute for accounting 25All else equal, nondisclosure will be preferred when competitive and political costs exist in an unregulated disclosure setting. Under mandatory disclosure, managers could use conservative income measurement as an alternative means to deflect regulatory attention and related political costs (Sivakumar and Waymire, 2003).
- 25. ARTICLE IN PRESS J. Barton, G. Waymire / Journal of Accounting and Economics 38 (2004) 65–116 89 information.26 DIVIDEND is coded 1 (0 otherwise) if, based on CRSP, the firm paid dividends prior to October 1929; we expect its coefficient to be negative. Shareholders may be less inclined to demand higher quality financial reporting from firms in regulated product markets. That is, the information managers provide to regulatory agencies can substitute for the information they provide directly to shareholders. We measure regulatory disclosure (REGULATED) with an indicator variable coded 1 (0 otherwise) if the firm operated in a regulated industry, and expect its coefficient to be negative.27 In addition, because some sample firms face government-imposed reporting requirements, this variable is a necessary control for identifying the effects of voluntary reporting incentives. We retain regulated firms in our sample because these firms’ governance structures and reporting policies were subject to considerable criticism. For example, utilities typically were organized as holding companies with pyramidal corporate struc-tures and opaque reporting policies (Ripley, 1927, pp. 276–353; Berle and Means, 1932, pp. 71–75, 183–185). Concerns about the structure of utilities also led to passage of the Public Utility Act of 1935 (Parrish, 1970, pp. 145–178). Thus, excluding these firms from the sample would eliminate several companies attracting contemporaneous criticism for poor financial reporting; such firms also would be subject to the effects of weak governance structures described by Johnson et al. (2000). 5.3. Results Table 5 reports descriptive statistics for the independent variables in Eq. (1), our financial reporting choice model. On average, firms were listed on the NYSE for at least 37 months prior to the crash. About 21% of the firms operated in the technology sector. The mean coefficient of variation in earnings is 0.75; the average beta and ROE are 1.04 and 11%. About 39% of the firms issued new equity shares within the two years prior to the 1929 market crash. The average leverage ratio is 0.16, 7% of the firms are classified as having an income measurement conflict, 36% have a potential control conflict and 30% are incorporated in Delaware. Firms had an average market share of 4%; the mean natural logarithm of total assets was 17.2, representing $29.5 million in assets. About 69% of the firms previously paid dividends and 6% were regulated. 26Blanchard and Watson (1982) suggest dividends as one indicator of the extent to which investors’ assessment of value will contain noise. Consistent with this argument, dividends played a central role in equity valuation shortly after 1900 because many firms did not disclose detailed financial reports (Graham and Dodd, 1934, pp. 325–338; Sivakumar and Waymire, 1993). Dividend declarations gain credibility through legal rules that make directors liable when excess dividends impair the firm’s capital (Berle and Means, 1932, pp. 135–136). 27We define regulated firms as those in the following industries: communications (3-digit SIC codes 481, 482, 489), oil and gas (460), nonrail transportation (419, 422, 440, 450, 474), railroad equipment and services (471), electric utilities (491, 493), and gas utilities (492, 499).
- 26. ARTICLE IN PRESS 90 J. Barton, G. Waymire / Journal of Accounting and Economics 38 (2004) 65–116 Table 5 Descriptive statistics of independent variables in Eq. (1) and Pearson correlations with financial reporting quality factor Variable Mean Median Standard deviation Predicted sign Correlation with QUALITY Equity market information costs AGE 37.47 46.00 14.27 0.12*** TECH 0.21 0.00 0.41 + 0.09** CVEARN 0.75 0.36 1.30 + 0.09y BETA 1.04 0.93 0.77 + 0.01 ROE 0.11 0.10 0.12 + 0.07** ISSUE 0.39 0.00 0.49 + 0.08** Contractual and control conflicts LEVERAGE 0.16 0.01 0.28 + 0.01 INCCONF 0.07 0.00 0.26 + 0.01 CONTCONF 0.36 0.00 0.48 + 0.08y DELAWARE 0.30 0.00 0.46 + 0.01 Competitive and political costs MKTSHR 0.04 0.01 0.09 0.11*** SIZE 17.20 17.01 1.28 0.13*** Alternative information DIVIDEND 0.69 1.00 0.46 0.03 REGULATED 0.06 0.00 0.23 0.20** The sample consists of 540 firms listed on the New York Stock Exchange in October 1929, excluding railroads and financial services firms (2-digit SIC codes 40 and 60–67). Financial reporting variables are for the most recent fiscal year ending no later than June 1929. The variables are defined as QUALITY=Score for principal component factor in Table 4, Panel C. AGE=Number of months before October 1929 since the firm was first listed on the CRSP database. TECH=1 if the firm is in one of the following industries: aircraft (3-digit SIC code 372), automotive (371), communications (481, 482, 489), electronics (363, 366, 369), film and entertainment (781, 783, 791), industrial machinery (351–356), office equipment (357), photography (381, 383, 384, 387), or electric utilities (491, 493); 0 otherwise. CVEARN=Coefficient of variation in net income, using all available annual data over the five-year period ending no later than June 1929. BETA=Beta from firm-specific value-weighted market model, based on all available monthly returns on CRSP over December 1925–September 1929. ROE=Net income divided by shareholders’ equity. ISSUE=1 if the firm issued shares within two years before October 1929, 0 otherwise. LEVERAGE=Debt plus preferred stock, divided by common equity. INCCONF=1 if the firm has at least one of the following: income bonds, noncumulative preferred stock or participating preferred stock; 0 otherwise. CONTCONF=1 if the firm has at least one of the following: a voting trust, multiple classes of common shares, or preferred stock with voting rights; 0 otherwise. DELAWARE=1 if the firm was incorporated in Delaware. MKTSHR=Total assets as a percentage of the sum of total assets of all sample firms in the firm’s 2-digit SIC code. SIZE=Natural logarithm of total assets. DIVIDEND=1 if the firm paid ordinary dividends before October 1929, 0 otherwise. REGULATED=1 if the firm is in one of the following industries: communications (3-digit SIC codes 481, 482, 489), oil and gas (460), nonrail transportation (419, 422, 440, 450, 474), railroad equipment and services (471), electric utilities (491, 493), or gas utilities (492, 499); 0 otherwise. *** and ** denote significant at the 0.01 and 0.05 levels based on one-tailed tests. ydenotes significant at the 0.10 level or better, based on two-tailed test, but of opposite sign to that predicted.
- 27. ARTICLE IN PRESS J. Barton, G. Waymire / Journal of Accounting and Economics 38 (2004) 65–116 91 Table 6 Pearson correlations between independent variables in Eq. (1) AGE TECH CVEARN BETA ROE ISSUE LEVERAGE TECH 0.03 CVEARN 0.09** 0.06 BETA 0.09** 0.13*** 0.12*** ROE 0.17*** 0.16*** 0.23*** 0.11*** ISSUE 0.06 0.16*** 0.06 0.09*** 0.14*** LEVERAGE 0.01 0.05 0.07 0.09*** 0.15*** 0.14*** INCCONF 0.07 0.01 0.04 0.06 0.10** 0.01 0.06 CONTCONF 0.13*** 0.02 0.07 0.02 0.09** 0.04 0.11** DELAWARE 0.05 0.05 0.04 0.01 0.03 0.03 0.04 MKTSHR 0.07 0.18*** 0.09** 0.02 0.01 0.07* 0.19*** SIZE 0.19*** 0.03 0.17*** 0.03 0.02 0.16*** 0.28*** DIVIDEND 0.12*** 0.06 0.36*** 0.22*** 0.41*** 0.24*** 0.06 REGULATED 0.02 0.15*** 0.01 0.03 0.08** 0.04 0.35*** INCCONF CONTCONF DELAWARE MKTSHR SIZE DIVIDEND CONTCONF 0.26*** DELAWARE 0.01 0.12*** MKTSHR 0.02 0.11*** 0.02 SIZE 0.01 0.19*** 0.05 0.50*** DIVIDEND 0.05 0.10** 0.08* 0.12*** 0.23*** REGULATED 0.06 0.02 0.04 0.26*** 0.26*** 0.06 The sample consists of 540 firms listed on the New York Stock Exchange in October 1929, excluding railroads and financial services firms (2-digit SIC codes 40 and 60–67). Financial reporting variables are for the most recent fiscal year ending no later than June 1929. All variables are defined in Table 5. ***, ** and * denote significant at the 0.01, 0.05 and 0.10 levels, respectively, based on two-tailed tests. The right-most column in Table 5 shows Pearson correlations between QUALITY and each independent variable. Of the 14 independent variables, seven are correlated with QUALITY in the predicted direction at the 0.05 level or better. Two variables (CVEARN and CONTCONF) are correlated with QUALITY but in the ‘‘wrong’’ direction (two-tailed po0.10), likely reflecting confounding effects—for instance, the correlation matrix for the independent variables in Table 6 shows that some correlations are large. Table 7 reports ordinary least-squares (OLS) estimation results of Eq. (1). The test statistics for all coefficients are based on heteroskedasticity-consistent standard errors. Because the independent variables have different scales, the last column in the table presents the standardized effect on QUALITY of a discrete change in each independent variable, holding all other variables constant. For conti-nuous independent variables, the standardized effect is the predicted change (in standard deviations) in QUALITY given a one-standard-deviation increase in the independent variable; for indicator variables, it is based on a change from 0 to 1. If managers have no incentive to supply higher quality financial reports absent regulation, we would expect financial reporting quality to be unrelated to the
- 28. ARTICLE IN PRESS 92 J. Barton, G. Waymire / Journal of Accounting and Economics 38 (2004) 65–116 Table 7 Regression results for Eq. (1) with QUALITY as the dependent variable Independent variable Predicted sign Coefficient t-statistic Standardized effect Intercept ? 1.746 1.69* Equity market information costs AGE 0.009 1.77** 0.088 TECH + 0.407 2.73*** 0.287 CVEARN + 0.129 2.78y 0.118 BETA + 0.065 0.76 0.035 ROE + 0.306 0.50 0.027 ISSUE + 0.232 1.75** 0.164 Contractual and control conflicts LEVERAGE + 0.589 2.85*** 0.117 INCCONF + 0.153 0.57 0.108 CONTCONF + 0.256 2.06y 0.180 DELAWARE + 0.035 0.28 0.025 Competitive and political costs MKTSHR 0.831 0.85 0.050 SIZE 0.068 1.06 0.061 Alternative information DIVIDEND 0.275 1.72** 0.194 REGULATED 1.380 4.89*** 0.972 R2 0.11 F(14, 525) 4.05*** The sample consists of 540 firms listed on the New York Stock Exchange in October 1929, excluding railroads and financial services firms (2-digit SIC codes 40 and 60–67). Financial reporting variables are for the most recent fiscal year ending no later than June 1929. The regression results are based on ordinary least squares estimation. For continuous independent variables, the standardized effect is the predicted change (in standard deviations) in QUALITY based on a one-standard-deviation increase in the independent variable; for indicator variables, it is based on a change from 0 to 1. All variables are defined in Table 5. ***, ** and * denote significant at the 0.01, 0.05 and 0.10 levels, respectively, based on one-tailed tests for signed predictions and two-tailed tests otherwise. Test statistics are based on heteroskedasticity-consistent standard errors. ydenotes significant at the 0.10 level or better, based on two-tailed test, but of opposite sign to that predicted. variables capturing managers’ reporting incentives. However, we find that these variables explain about 11% of the variation in QUALITY (F(14, 525)=4.05, po0.01).28 28The explanatory power of the regression reported in Table 7 is somewhat weaker than the 18–25% explanatory power reported in prior research on financial reporting choices (e.g., Botosan, 1997; Clarkson et al., 1999). This could reflect measurement error in our independent variables, as well as different research settings and design choices. Including industry indicators in Eq. (1) increases the regression’s explanatory power to 19%, without changing the inferences we draw on the remaining variables.
- 29. ARTICLE IN PRESS J. Barton, G. Waymire / Journal of Accounting and Economics 38 (2004) 65–116 93 Most of the significant univariate results in Table 5 also extend to the regression results. AGE, TECH, ISSUE and REGULATED remain significantly associated with QUALITY at conventional levels. In addition, the coefficients on LEVERAGE and DIVIDEND are both significant (po0.05). Overall, six of the 14 coefficients are significant (po0.10) and in the direction predicted. As with the univariate analyses, the coefficients on CVEARN and CONTCONF remain of sign opposite to our predictions (two-tailed po0.10). Among the continuous independent variables in the regression, CVEARN and LEVERAGE have the strongest (standardized) effects on QUALITY. We interpret the significance of LEVERAGE as consistent with debt contracting strongly influencing corporate financial reporting before the passage of the Securities Acts (Watts, 1977). The significant coefficients on AGE, TECH and, most directly, ISSUE suggest that information costs in equity markets also exerted considerable influence on pre-SEC financial reporting. This evidence is consistent with conjectures that equity market forces encouraged greater disclosure and thus higher quality reporting prior to the Securities Acts (Hawkins, 1963). The significant coefficient on DIVIDEND implies that firms paying dividends (an alternative information source) provided significantly less information via external financial reporting. The negative coefficient on REGULATED is consistent with this interpretation, but also could suggest that product market regulation inhibits external disclosure. Among the indicator variables in our model, REGULATED has the strongest (standardized) effect on QUALITY. Unlike the univariate results in Table 5, the regression results in Table 7 show that MKTSHR and SIZE are not associated with QUALITY at conventional levels, probably reflecting collinearity in the data (in Table 6, the correlation between MKTSHR and SIZE is 0.50). For example, when we omit MKTSHR from the model, the coefficient on SIZE turns statistically significant (b ¼ 0:094; po0.05). We find similar results for the coefficient on MKTSHR when we omit SIZE instead (b ¼ 1:228; po0.10). We interpret this evidence as indicating that competitive and political costs affect reporting choice, but we are unable to discriminate which type of cost is more important. A possible interpretation of the negative coefficient on CVEARN is that earnings variability may reflect managers’ income smoothing actions. Table 6 indicates that the correlation between CVEARN and DIVIDEND is 0.36. Thus, managers might smooth earnings in conjunction with dividend policies. If managers smoothing earnings also select higher quality reporting to communicate information on dividend sustainability, then such effects could result in a negative coefficient on CVEARN. The negative coefficient on CONTCONF is more difficult to rationalize as consistent with managers selecting reporting policies aligned with shareholders’ interests. It could be that other governance arrangements mitigate more effectively the effects of control conflicts, but that interpretation would be consistent with a negative coefficient on CONTCONF only if such arrangements were negatively correlated with managers’ choice of financial reporting quality. One possibility in this regard is that concentrated equity ownershipallows for better monitoring of
- 30. ARTICLE IN PRESS 94 J. Barton, G. Waymire / Journal of Accounting and Economics 38 (2004) 65–116 managers (e.g., through board representation and control of voting). This renders external disclosure less necessary to protect minority shareholders (LaPorta et al., 1998; Shleifer and Vishny, 1997; Bushman et al., 2004b; Lang et al., 2004). Further, this effect can be magnified in settings where owners enjoy rents secured through the political process (Faccio, 2003; Rajan and Zingales, 2003). The negative sign on CONTCONF also may reflect unresolved agency problems. Berle and Means (1932) argue that agency problems were more pronounced for large firms where voting power shielded managers from being held accountable to minority shareholders for the firm’s performance. The correlations in Table 6 provide some modest support for this interpretation—CONTCONF is positively correlated with AGE ðr ¼ 0:13Þ and SIZE ðr ¼ 0:19Þ; and negatively correlated with ROE ðr ¼ 0:09Þ and DIVIDEND ðr ¼ 0:10Þ: Thus, firms with potential control conflicts tend to be larger, older, less profitable and less likely to pay dividends. Table 8 reports estimation results of Eq. (1) when the dependent variable is instead ISTRANSP, BSTRANSP, AUDITOR or CONSERV. These analyses helpus understand the reporting attributes that lie behind the associations documented in Table 7. The results for the ISTRANSP, BSTRANSP and AUDITOR models are based on ordered logit regressions, and those for the CONSERV model are based on a logit regression.29 In the CONSERV model, REGULATED drops out of the regression because it predicts lack of conservatism perfectly; only in estimating this model, we omit the 30 firms with REGULATED coded 1. Several aspects of the results in Table 8 deserve mention. The relation between LEVERAGE and QUALITY shown in Table 7 is robust across three of the four models in Table 8, suggesting that debt contracting is affecting multiple attributes of firms’ reporting policies. The coefficient on ISSUE is positive (po0.10) for the AUDITOR and CONSERV models, but not for the ISTRANSP and BSTRANSP models. One interpretation of this finding is that firms accessing capital markets during our sample period focused their reporting choices on communicating credibly to investors that estimates of income and net assets were not overstated. The results for the CONSERV model also support stories about conservatism offered by Watts (2003). The significant positive relation between CONSERV and LEVERAGE supports his hypothesis that conservatism is related to debt contracting (see also Leftwich, 1982). His hypothesis is further supported by the significant positive coefficient on INCCONF, suggesting that conservative account-ing can reduce the likelihood of disputes arising over excessive payouts to one group of investors relative to another (Ahmed et al., 2002). The significant coefficients on several information cost variables support Watt’s (2003) assertion that ‘‘an information perspective also produces conservatism once relevant information costs are introduced’’ (p. 4).30 Finally, when we reestimate the CONSERV model omitting 29The results are similar when ISTRANSP and BSTRANSP are treated as count variables and we use Poisson or negative binomial regressions. 30The ROE findings in the CONSERV regression are not a mechanical result from including intangibles in the denominator of ROE for nonconservative firms. We replicated our analyses after substituting tangible book value of equity as the denominator of ROE, and found a significant coefficient on ROE (b ¼ 1:184; po 0.05).