SlideShare a Scribd company logo
1 of 7
Download to read offline
Application of the Single-Kernel Characterization System to Durum Wheat 
4 CEREAL CHEMISTRY 
Testing and Quality Prediction 
M. J. Sissons,1–3 B. G. Osborne,4 R. A. Hare,1,2 S.A. Sissons,1,2 and R. Jackson4 
ABSTRACT Cereal Chem. 77(1):4–10 
The Single Kernel Characterization System (SKCS 4100) measures 
single kernel weight, width, moisture content, and hardness in wheat 
grain with greater speed than existing methods and can be calibrated to 
predict flour starch damage and milling yield. The SKCS 4100 is poten-tially 
useful for testing applications in a durum improvement program. 
The mean SKCS 4100 kernel weight and moisture values from the 
analysis of 300 individual kernels gave good correlations with 1,000 
kernel weight (r2 = 0.956) and oven moisture (r2 = 0.987), respectively. 
Although significant correlations were obtained between semolina mill 
yield and SKCS 4100 weight, diameter, and peak force, they were all 
very low and would be of little use for prediction purposes. Similarly, 
although there were significant correlations between some SKCS 4100 
parameters and test weight and farinograph parameters, they too were 
small. The SKCS 4100 has been calibrated using either the single kernel 
hardness index or crush force profile to objectively measure the percen-tage 
vitreous grains in a sample with reasonable accuracy, and it correlates 
well with visual determination. The speed and accuracy of the test would 
be of interest to grain traders. An imprecise but potentially useful cali-bration 
was obtained for the prediction of semolina mill yield using the 
SKCS 4100 measurements on durum wheat. The SKCS 4100 is useful for 
some traits such as hardness, grain size and moisture for early-generation 
(F3) selection in a durum improvement program. 
The evaluation of durum (Triticum turgidum L., ssp. durum 
Desf.) breeding lines for quality in the Australian National Durum 
Wheat Improvement Program, Tamworth, NSW, involves a series 
of tests of varying complexity and expense. It would be desirable 
to develop more rapid and economical methods to predict end-use 
quality. In the program at Tamworth, grain size was measured as 
1,000 kernel weight grain hardness using a pearlograph (Ches-terfield 
1971, Pearson and Wedd 1978), and grain protein and 
moisture content was measured by near-infrared reflectance spectro-scopy 
(NIR). These tests give an estimate of the whole sample but 
do not measure individual kernels and thus do not provide any 
information on sample uniformity. Selection for those crossbreeds 
that give a small range in grain size distribution, for example, 
should produce a more uniform grain size, which millers claim to 
be more acceptable as such lots of wheat condition more evenly 
and mill more efficiently. 
The Single Kernel Characterization System (SKCS) 4100 (Perten 
Instruments North America Inc., Springfield, IL) was developed 
for the measurement of single kernel weight, width (either lateral 
or longitudinal depending on the orientation of the kernel when it 
reaches the crescent), moisture, and hardness in wheat (Martin et 
al 1993). This technology provides the possibility of obtaining 
data on the uniformity of a grain sample with essentially the same 
speed as bulk tests that offer an average value only. The SKCS 
4100 is a potentially useful tool to a plant breeder by maximizing 
the number of tests conducted simultaneously and providing 
useful mean and distribution information on bulk (300 kernel) 
samples. The SKCS 4100 can be used to measure single kernel 
hardness index (SK-HI), single kernel moisture content (SK-MC), 
single kernel weight (SK-WT), and single kernel diameter (SK-DM). 
In the SKCS analysis, a small sample (»20 g) of grain is 
deposited into a hopper where a rotating wheel (with the aid of a 
vacuum) picks up individual kernels and deposits them one at a 
time into a weighing boat. After weighing, the kernel passes down 
an inclined crescent where the diameter is measured and the 
kernel is then crushed between the crescent and a toothed rotor. A 
load cell measures and records the crush force-time profile. A 
sample comprising a preset number of kernels (usually 300) are 
individually analyzed in 3–5 min and the data presented as a 
distribution with mean and standard deviation calculated for each 
of the four measurements. Results of recent work have indicated 
that calibration equations may be derived to predict wheat texture 
(Gaines et al 1996), flour milling yield (Satumbaga et al 1995, 
Osborne et al 1997), and starch damage (Osborne et al 1997) from 
the SKCS 4100 data. 
In durum wheat, the proportion of vitreous durum kernels is an 
important parameter for high semolina milling yield and main-taining 
quality of the derived pasta. Vitreous durum kernels appear 
glassy and translucent due to the compact structure of the protein 
matrix and starch granules. Nonvitreous or starchy kernels are opaque 
due to air spaces between starch granules (Dexter et al 1989). 
When milled, starchy kernels reduce to fines, decreasing semolina 
extraction (Dexter and Matsuo 1981). The estimation of vitreous 
kernel content in durum wheat is an important international grading 
factor and is performed by visual inspection (ICC 1995), which is 
a subjective and tedious procedure. Since the SKCS 4100 provides 
data related to kernel hardness, it should be possible to develop a 
calibration to measure durum vitreousness, a more rapid and objec-tive 
method than visual assessment. 
The aim of this work was to evaluate the utility of the SKCS 
4100 in a durum breeding program and, specifically, to develop new 
calibrations to predict kernel vitreousness and semolina mill yield. 
MATERIALS AND METHODS 
Samples 
Several sample sets were used in this study. Each set was 
selected to enable different issues to be addressed. 
Set 1 (repeatability) assessed the repeatability of each SKCS 
parameter. Six durum crossbred lines grown at two different sites 
were analyzed repeatedly (n = 20) by one operator. 
Set 2 (accuracy) assessed the accuracy of the SKCS weight. A 
subset of 50 samples from Set 5 was used for which 1,000 kernel 
weight data were available. In addition, the distribution in kernel 
weight was obtained from a 300-kernel sample where the weight 
of each kernel was measured on an analytical balance and the SK-WT 
was obtained by the SKCS 4100. The SK-DM measurement 
of 300 individual kernels was compared with manually measured 
diameter of each kernel using digital calipers. To assess the 
accuracy of the SKCS 4100 moisture content measurement a 
sample set of 36 samples was prepared. Each durum wheat sample 
was cleaned using a Carter-Day dockage tester (Simon Carter Co., 
1 Tamworth Centre for Crop Improvement, Tamworth NSW 2340 Australia. 
2 Quality Wheat CRC Ltd., North Ryde NSW 2113 Australia. 
3 Corresponding author. E-mail: mike.sissons@agric.nsw.gov.au Phone: 61 267 
631 119. Fax: 61 267 631 222. 
4 BRI Australia Ltd., North Ryde, NSW 2113 Australia. 
Publication no. C-1999-1203-02R. 
© 2000 American Association of Cereal Chemists, Inc.
Vol. 77, No. 1, 2000 5 
Minneapolis, MN). Grain <6 mm (No. 25 screen) and >2 mm was 
divided into aliquots of 100 g. Samples were either partly dried in 
an oven at 50°C or had water added (1–6% by weight) to achieve 
final moisture percentages of 8–16%. The sample (100 g) was 
sealed in a plastic screw-capped container (11 x 4 cm) and mixed 
by hand by inverting continuously for 5 min to disperse the water 
evenly over the surface of the grain. Four hours later, the container 
was again mixed for 5 min. The tempered wheat was stored over-night 
at room temperature. The moisture content of a subsample 
was determined by oven-drying (Approved Method 44-15A, AACC 
1995); the SK-MC was obtained concurrently on the equilibrated 
samples. For comparing pearlograph hardness to SKCS hardness, 
all 584 lines from Set 4 were evaluated. 
Set 3 (vitreousness) was used to develop a durum vitreousness 
calibration. Two subsets were prepared (one in each of the colla-borating 
laboratories). 
In the first subset, a commercial sample of durum was first 
separated into 100% vitreous and 100% nonvitreous fractions by 
visual identification of individual kernels. From each of these two 
fractions, a calibration set was prepared by mixing vitreous with 
nonvitreous grains to form a 300-kernel samples of 0, 25, 50, 75, 
85, 90, 95, 98, and 100% vitreousness. Each 300-kernel sample 
was analyzed using the SKCS 4100, and the mean SK-HI was 
calculated. The determination of %vitreousness by visual inspec-tion 
was a modification of a method produced by AWB Ltd. 
(Melbourne, Australia). A 300-kernel sample was obtained and 
separated into vitreous, mottled, and bleached fractions. Occasion-ally, 
kernels from the bleached fraction were split lengthwise by a 
scalpel, and any kernel with opaque starchy areas inside was classed 
as mottled. Grain was screened through a 2.0-mm slotted screen, 
and 300 kernels were counted and classified as vitreous or nonvit-reous. 
Vitreous kernels are bright and translucent with a uniform 
amber color. Starchy or nonvitreous kernels have opaque areas with 
a dull yellow appearance. Bleached kernels are dull with a pale 
washed-out appearance. To distinguish starchy from bleached ker-nels, 
it was sometimes necessary to cut the bleached kernels longi-tudinally; 
those with any opaque areas were classed as starchy. The 
%vitreousness was defined as the proportion of vitreous kernels in 
a 300-kernel sample. Another set of samples was obtained to test 
the SKCS vitreous calibration (prediction set) consisting of 22 sam-ples 
of commercial durum (supplied by GrainCorp Operations Ltd., 
Narrabri, NSW) where %vitreous count was determined visually. 
For the second subset, three samples of Australian durum were 
obtained from three different farms in New South Wales. A further 
five samples were obtained from the Cereals Institute, Greece, in 
the course of a ring test on ICC Standard No. 129 (ICC 1995). 
These eight samples were analyzed (five replicates) for %vitreous-ness 
by ICC Standard No. 129. Two of the Australian samples and 
four of the ICC samples were separated into 100% vitreous and 
100% nonvitreous fractions by visual identification of individual 
kernels. Nineteen mixtures of varying %vitreousness (0, 25, 50, 
75, 85, 90, 95, 98, and 100%) were then prepared by counting the 
appropriate proportions of kernels to form a 200-kernel sample for 
analysis by the SKCS 4100 to produce a set of 27 samples in total. 
Set 4 was constructed to relate farinograph data (Approved 
Method 54-21), grain protein, and hL weight to SKCS parameters. 
Of the 584 lines from set 5, only 280 samples were available to 
relate these properties to SKCS parameters. In this set of 280 
samples, there were 32 tetraploid accessions (Sissons et al 1998). 
Set 5 (breeding material) was a calibration sample set used to 
determine whether the SKCS 4100 could be used to predict semo-lina 
mill yield (SY%). This set was made up of 584 crossbreeds at 
an advanced (F5 to F7) stage of breeding over several years 
(1993–1997) and 32 genetically diverse tetraploid wheats (Sissons 
et al 1998). After cleaning on a Carter-Day dockage tester (settings 
as for Set 2), tests included 1,000 grain weight (weight of 250 
kernels × 4), pearlograph grain hardness (Chung et al 1975, 
Kuhlman et al 1979), grain protein by NIR (Approved Method 39- 
10), and hL weight. Grain was milled into semolina using a 
laboratory mill (Buhler MLU 202) (Approved Method 26-41). 
SY% was expressed on a total products basis. 
SKCS 4100 Measurements 
SKCS 4100 measurements were carried out according to the 
operating manual (Perten Instruments 1995), using 300 grains. 
Types of data recorded were: 1) four default measurements (SK-HI, 
SK-MC, SK-WT, SK-DM); 2) raw data used to calculate the 
default measurements (X-array); 3) X-array expanded to 40 
variables with the use of transform functions such as exponentials, 
logarithms, inverse terms and ratios (Big File). 
Sample Sets 1 and 2 were used to assess the precision and 
accuracy of the default measurements and Set 4 was used to 
derive simple correlations between the default measurements and 
grain and semolina quality characteristics. 
Sample Sets 3 and 5 were used to develop new calibrations for 
vitreousness and semolina yield. The latest version of the instru-ment 
software (5.00C) allowed user calibrations to be installed but 
could only accept equations derived directly from the X-Array 
data using multiple linear regression. Therefore, a computer file 
was collected containing the averages of the X-array variables weight 
(mg), peak force (maximum load cell force, A/D counts), conduc-tivity 
(A/D counts), area (area of the crush force profile, A/D 
count-second), GompA (Gompertz function coefficient A, a func-tion 
describing the intercept of the normalized cumulative frequency 
distribution of the first derivative value of the crush force-time 
profile), GompB (Gompertz function coefficient B, a coefficient 
describing the slope of the normalized cumulative frequency 
distribution of the first derivative value of the force-time crush 
profile), length (length of the crush period, number of data points 
in the crush force profile), diameter (mm), (equivalent to the breadth 
of the kernel), crescent temperature (°F), and DyFraction (time 
interval that a kernel exerts force on the crescent). Because the 
TABLE I 
Precision of Single-Kernel Characterization System (SKCS) Parameters for Durum Graina,b 
SK-WT (mg) SK-DM (mm) SK-HI SK-MC (%) 
Sample Mean SD Mean SD Mean SD Mean SD 
1 45.5 0.89 2.98 0.034 87.2 1.03 10.6 0.03 
2 38.1 0.87 2.68 0.036 88.2 1.07 9.5 0.09 
3 51.1 0.79 3.01 0.037 86.9 0.82 10.5 0.04 
4 41.7 1.10 2.76 0.041 92.5 0.91 9.5 0.03 
5 37.9 0.65 2.66 0.030 91.1 0.95 9.5 0.04 
6 48.8 0.85 3.05 0.033 90.7 0.95 10.2 0.02 
Overall mean 43.8 2.87 89.4 10.0 
Pooled SD 0.85 0.034 0.95 0.041 
CV% (range)c 1.54–2.64 1.10–1.54 0.95–1.22 0.22–0.95 
a Six different samples of durum wheat were each analyzed 20 times. Mean and standard deviation (SD) of the n = 20 samples were calculated. 
b SK-WT = single kernel weight; SK-DM = single kernel diameter; SK-HI = single kernel hardness index; SK-MC = single kernel moisture content. 
c Coefficient of variation.
acquisition of the crush force A/D count versus time data is too 
slow relative to the speed of the singulator, only summary data 
(peak force, peak area, GompA, and GompB) are stored in routine 
use. These summary data together with average kernel weight were 
used in multiple regression analysis to predict %vitreousness and 
SY% 
Statistical Analysis 
The X-array data were imported into Excel v7 (Microsoft Corp-oration, 
Redmond, WA) and the resulting Excel spreadsheets were 
imported into Minitab v. 11 (Minitab Inc., State College, PA). 
Simple correlations and multiple linear regression equations were 
calculated using the method of least squares. Where selection of 
terms to be included in the regression equation was indicated, this 
was calculated as the residual sums of squares for all possible 
regressions with one or more terms. Then, using the residual sum 
of squares to compare equations with the same number of terms, 
the best one-term, two-terms, etc., equations were identified. 
RESULTS AND DISCUSSION 
Precision and Accuracy of SKCS 4100 Measurements 
The mean and standard deviation (SD) for each of the six durum 
samples of Set 1 after repeated analysis (n = 20) and the pooled 
SD of repeatability for kernel weight (SK-WT), diameter (SK-DM), 
hardness (SK-HI, and moisture (SK-MC) are given in Table I. 
Fig. 1. Linear regression plot of single-kernel characterization system 
(SKCS) single kernel weight (SK-WT) vs. 1,000 kernel weight. SK-WT = 
2.18 + 0.978 × 1,000 kernel weight; r2 = 0.956, n = 50, relative standard 
deviation = 1.83 g. 
6 CEREAL CHEMISTRY 
When expressed as the coefficient of variation (CV%), the re-peatability 
of all the SKCS parameters is very low (CV% = 0.2– 
2.7%), indicating excellent precision. The precision reported for 
durum is similar to that obtained for bread wheat (Osborne et al 1997). 
The SKCS 4100 is factory-calibrated for common wheat. 
Therefore, it is necessary to verify the accuracy of these calibra-tions 
for each different grain type and to make skew or bias adjust-ments 
if required. Accuracy was determined by comparing the SKCS 
measured data with standard physical testing methods used in the 
Tamworth laboratory from sample Sets 2 and a subset of Set 4. 
The SKCS weigher operates on the principle that a kernel 
dropped into the plastic weighing boat causes the boat to depress, 
and the electrical force required to return the boat to a horizontal 
position is proportional to the mass of the kernel. Therefore, SK-WT 
is a secondary measurement that requires calibration against 
an analytical balance. The distribution in kernel weight obtained 
from two 300-kernel samples measured using an analytical balance 
and the SKCS SK-WT data were compared. Both samples pro-duced 
virtually identical comparisons (data not shown). There was 
an excellent agreement between the two methods with no significant 
difference (P < 0.05) in the means determined by unpaired t-test 
and a small residual standard deviation of the differences. There was 
an excellent correlation (r2 = 0.956) and low residual standard devi-ation 
(RSD) of 1.83 g between SK-WT and 1,000 kernel weight 
(Fig. 1) for durum similar to that reported for bread wheat (Os-borne 
et al 1997). The equation was SK-WT = 2.18 + 0.978 × 
1,000 kernel weight, where the slope and bias are not significantly 
different from a slope of 1.0 and a bias of 0.0 at P < 0.05. 
Fig. 2. Frequency distribution of the diameter of individual durum kernels 
in a sample measured using the single-kernel characterization system (SKCS) 
single kernel diameter (SK-DM) and measured with calipers. 
Fig. 3. Linear regression plot of single-kernel characterization system 
(SKCS) measured SK-HI vs. Pearlograph hardness. r2 = 0.462, n = 584, 
relative standard deviation = 5.97. 
Fig. 4. Crush force profiles for samples of Australian durum (AD) with 
different %vitreousness. Each trace is the average of 200 kernels. Trace 
furthest from x-axis at measurement number 350 is the 100% vitreous sam-ple, 
followed in order moving closer to the x-axis by 68, 40, 30, and 0%.
Mean (n = 280), Standard Deviation (SD), and Range of Single-Kernel 
Characterization System (SKCS), Milling, and Dough Rheology 
Characteristics of Durum Wheat Samplesa,b 
Characteristic Mean SDc Minimum Maximum 
Peak force 1,907.0 271.0 760.0 2,921.0 
SK-WT (mg) 38.2 (10.8) 5.7 25.5 (7.6) 59.2 (16.3) 
SK-DM (mm) 2.6 (0.5) 0.2 2.1 (0.4) 3.4 (0.7) 
SK-HI 96.2 (15.1) 8.2 14.6 (0.5) 111.2 (18.9) 
SK-MC (%) 11.4 (0.3) 0.4 10.1 (0.2) 13.1(0.4) 
HW (kg/hL) 79.1 1.9 72.3 83.9 
Grain protein (%) 14.4 1.2 10.6 18.2 
DDT (min) 3.4 0.7 1.2 5.0 
B10 (BU) 57.4 29.6 20.0 180.0 
FWA (%) 60.6 2.2 55.3 67.8 
Total mill yield (%) 79.7 2.0 64.7 86.6 
SY% 68.2 2.7 43.3 75.6 
a SK-WT = single kernel weight; SK-DM = single kernel diameter; SK-HI = 
single kernel hardness index; SK-MC = single kernel moisture content. HW 
hectoliter weight; DDT = Farinograph dough development time; B10 = break-down 
after 10 min; FWA = farinograph water absorption; SY% = semolina 
mill yield percentage. 
b For each of the 280 samples analyzed, the SKCS gave a mean and standard 
deviation from the analysis of 300 kernels. The average of these 280 standard 
deviation values is shown in parentheses. 
c Standard deviation calculated for the data from the 280 samples. 
Vol. 77, No. 1, 2000 7 
The diameter measurement of the kernel is based on the width 
at the point of first contact in the gap formed between the crescent 
and the rotor arc. This point is determined by the number of data 
scan intervals from contact to exit. A distribution of SK-DM 
obtained from the analysis of »300 kernels was compared to 
manually measuring the diameter of the same 300 kernels using 
digital calipers (Fig. 2). The SKCS 4100 assigned a number of 
kernels to sizes >3.5 mm and <1.8 mm, whereas no kernels were 
>3.8 and <1.8 mm when measured with calipers. Some error 
would arise in the manual measurement because kernels vary in 
shape, and it would not always be possible to obtain an accurate 
measure of diameter. On the other hand, the SKCS diameter 
measurement will be influenced by the orientation of the kernel as 
it enters the crescent. An unpaired t-test revealed a difference in 
the means (P < 0.05) of the two methods of measurement 
reflecting the above differences. 
The SK-MC measure is accurate (r2 = 0.987; RSD = 0.18%) 
over a broad range of moisture values. The equation was SK-MC 
= 1.045 × oven moisture – 0.06, where the slope and bias are not 
significantly different from a slope of 1.0 and a bias of 0.0 at P < 
0.05. 
The SK-HI measure is based on the crescent load cell A/D 
counts measured over a period of 125 msec. The raw data can be 
recorded and plotted as a force-time crush profile. The peak force 
and the area under the curve is a measure of the energy required to 
crush the kernel; the harder the kernel the greater this energy. The 
selection of a numeric scale for SK-HI is used for the purposes of 
classification of wheat kernels into soft and hard and was based 
on the earlier use of an arbitrary scale for wheat hardness by NIR 
(Approved Method 39-70A). The Tamworth laboratory has been 
using a pearlograph to measure grain hardness but this does not 
give a strong correlation (r2 = 0.46) with SK-HI (Fig. 3). The 
graph shows some clusters of anomalous data for which the most 
likely explanation is that the two methods measure different 
aspects of grain hardness (i.e., the pearlograph measures the 
kernel’s resistance to abrasion, whereas the SKCS 4100 measures 
the force deformation profile during the crushing of the kernel). 
Furthermore, the SKCS 4100 was optimized to detect mixed hard 
and soft common wheat; durum was not included in the original 
Fig. 5. Linear regression between average weight and average Gompertz 
B of 27 different mixtures of durum grain. %Vitreousness = –3841 – 2.6 
Avgwt + 4262 AvggB; r2 = 0.993, n = 27, relative standard deviation = 2.953. 
TABLE II 
TABLE III 
Visual vs. Single-Kernel Characterization System (SKCS) Methods to Measure Durum Vitreousnessa 
Sample SKCS Classification into Gradeb 
No. Visual (%) M1 (%) M2 (%) Visual M1 M2 
13 60 92 78 Unclassified ADR1 ADR3 
20 66 69 74 Unclassified ADR3 ADR3 
3 75 74 92 ADR3 ADR3 ADR1 
21 76 81 89 ADR3 ADR2 ADR2 
9 77 76 98 ADR3 ADR3 ADR1 
15 84 100 87 ADR2 ADR1 ADR2 
22 84 93 97 ADR2 ADR1 ADR1 
2 86 97 100 ADR2 ADR1 ADR1 
6 89 99 88 ADR2 ADR1 ADR2 
8 89 88 100 ADR2 ADR2 ADR1 
11 89 89 100 ADR2 ADR2 ADR1 
17 90 98 92 ADR1 ADR1 ADR1 
18 90 92 99 ADR1 ADR1 ADR1 
1 92 95 100 ADR1 ADR1 ADR1 
19 92 100 90 ADR1 ADR1 ADR1 
5 93 91 100 ADR1 ADR1 ADR1 
14 94 94 98 ADR1 ADR1 ADR1 
4 95 94 100 ADR1 ADR1 ADR1 
12 97 92 94 ADR1 ADR1 ADR1 
7 98 92 100 ADR1 ADR1 ADR1 
10 98 96 100 ADR1 ADR1 ADR1 
16 98 90 93 ADR1 ADR1 ADR1 
a Predicted % vitreous kernels using SKCS hardness index calibration equation M1 or X-array data equation M2. 
b Classification based on Australian durum grading system ADR1 ³ 90%; ADR2 80–89%; ADR3 75–79%; no classification <75%.
calibration. A Tamworth-specific method was used in this study 
due to the lack of a fundamental reference method. However, a 
more suitable physical test for accuracy comparison would be PSI 
because a good correlation was found between PSI and SK-HI in 
bread wheats (Osborne et al 1997, Williams et al 1998). 
In summary, the SKCS 4100 provides accurate and reliable data 
on durum grain, weight, and moisture from as little as 300 grains 
and can be used to replace the more time-consuming methods 
previously used in a durum quality testing laboratory. Its 
implementation would reduce the time required for analysis. It is 
not possible to comment on the accuracy of the SKCS 4100 for 
diameter and hardness due to lack of fundamental reference methods. 
Prediction of Durum Vitreousness Using the SKCS 4100 
Vitreousness in durum is an important international grading 
factor and a high percentage of vitreous kernels (>90%) is desired. 
The system used in Australia has three grades: ADR1 (Australian 
Durum Grade 1) ³90%, ADR2 80–89%, ADR3 <79% (AWB 
Ltd., Australia). Starchy durum tends to be lower in protein 
content than vitreous durum wheat (Dexter et al 1988), imparting 
poor cooking quality to pasta (Matsuo and Dexter 1980, Dexter 
and Matsuo 1981). Several studies have shown that starchy durum 
wheat is softer than vitreous durum wheat (Matsuo and Dexter 
1980, Dexter and Matsuo 1981, Dexter et al 1988), so rapid 
methods to measure grain hardness would be a useful alternative 
to the visual assessment of vitreous kernels. 
Using sample Set 3 (subset 1), vitreousness was measured at 0, 
25, 50, 75, 85, 90, 95, 98, and 100%, with hardness varying from 
95–52 SK-HI index units. Of particular interest is whether the 
SKCS 4100 can discriminate samples within the range of vitreous-ness 
of the commercially useful range of 75–90% to classify grain 
lots into one of the three grades. The calibration set gave an excellent 
correlation was obtained (r2 = 0.993) (Eq. M1: %Vitreousness = 0.395 
SK-HI + 54.667) between SK-HI and %vitreous durum kernels. 
Using sample Set 3 (subset 2), crush force profiles plotted as 
load cell A/D counts versus measurement number (Fig. 4) con-firmed 
that a greater force is required to crush the vitreous kernels 
than with the nonvitreous kernels. There was also a systematic 
relationship between %vitreous kernels in a sample and the shape 
of the crush force profile. X-Array data were used to construct a 
multiple regression equation to predict vitreousness. Examination 
8 CEREAL CHEMISTRY 
of all possible combinations of terms produced a two-term 
equation (Eq. M2, Fig. 5): % = –3841 – 2.6 AvgWt + 4262 
AvggB, r2 = 0.993, RSD = 2.953, P < 0.001, where AvgWt is 
average grain weight; AvggB is average Gompertz function coeffi-cient 
B performed as well as the equation containing all five X-array 
terms describing the kernel weight and crush force profile. 
Weight is required in the prediction to correct for the fact that 
larger kernels require a greater force to crush them, but only one 
of the functions that describe the force crush profile was required 
as these were all very highly intercorrelated (r > 0.97). 
To evaluate both equations M1 and M2, a prediction set of 22 
samples of commercial durum (Set 3) with starchy kernels present 
was assessed visually for %vitreous kernels and analyzed by the 
SKCS 4100. This sample set exhibited a visual percentage 
vitreousness count of 60–98% (Table II). Using %vitreous kernel 
ranges applicable to marketing (samples 13 and 20 were exclu-ded), 
the two SKCS calibrations were compared with the visual 
method. There was a 25% error rate of prediction using equation 
M1 and a 35% error rate for M2. Equation M1 gave a lower error 
than M2 in this limited sample set and would be a better choice as 
a calibration method. A possible explanation for these discrep-ancies 
is that with the visual method, kernels are classified as starchy 
even when a small portion of the kernel is affected. However, to 
the SKCS 4100, this type of kernels has hardness similar to 
vitreous kernels and therefore the SKCS 4100 would give a higher 
%vitreousness estimation. From a breeder’s viewpoint, this is 
preferable to rejecting vitreous lines, but not from a marketer’s per-spective. 
It should be noted that the classification system between 
the three grades is rigid in that a vitreousness of 89 vs. 90% gives 
a different grading. Whether there is any difference in quality 
between a value of 90 vs. 89% is not known, but it would seem 
unlikely. It would be more reasonable to have a range of overlap. 
The preliminary results show that the SKCS 4100 could be used 
to measure %vitreousness in a sample of durum, but the calibra-tion 
needs to be further assessed with a larger prediction set. The 
SKCS 4100 would be a more reliable and objective method 
compared to the visual approach. 
Relationships Among Single Kernel Characteristics with 
Wheat and Semolina Parameters 
Advanced durum breeding lines and a diverse set of tetraploid 
accessions (Set 4) (n = 280 samples) were evaluated for hL weight 
(HLW), grain protein (NIR), total mill yield, and SY%, Farino-graph 
dough development time (DDT), breakdown after 10 min 
(B10), water absorption (FWA), and the five SKCS mean 
Fig. 6. Plot of fitted semolina mill yield predicted from analysis of single-kernel 
characterization system (SKCS) low-level machine data vs. semolina 
mill yield % measured by a laboratory mill. 
TABLE IV 
Simple Correlation Coefficients Among Single-Kernel Characterization 
System (SKCS) Measurements (n = 280)a 
Peak Force SK-WT SK-DM 
SK-WT (mg) 0.88**b 1.00 
SK-DM (mm) 0.84** 0.96** 1.00 
SK-HI 0.18** –0.24** –0.19** 
a SK-WT = single kernel weight; SK-DM = single kernel diameter. 
b * and ** = Correlation coefficients significant at P < 0.05 and 0.01, respectively. 
TABLE V 
Linear Correlation Coefficients (n = 280) Between Standard Quality 
Tests and Single Kernel Parametersa 
Single Kernel Parameters 
Characteristic Peak Force SK-WT (mg) SK-DM (mm) 
HW (kg/hL) nsb 0.20** 0.27** 
SY% 0.54** 0.37** 0.36** 
DDT (min) –0.28** –0.31** –0.26** 
B10 (BU) 0.35** 0.38** 0.34** 
FWA (%) 0.50** 0.43** 0.38** 
a HW = hectoliter weight; SK-WT = single kernel weight; SK-DM = single 
kernel diameter; DDT = farinograph dough development time; B10 = 
breakdown after 10 min; FWA = farinograph water absorption, 11% 
moisture basis; SY% = semolina mill yield percentage. 
b ** = significant at P < 0.01; ns = not significant.
Vol. 77, No. 1, 2000 9 
parameters (SK-PF, SK-WT, SK-DM, SK-HI, and SK-MC). The 
means and ranges of these physical and chemical characteristics 
are summarized in Table III. It should be noted that the very low 
hardness values found for some samples were from species other 
than T. turgidum. The presence of the 32 diverse tetraploid species 
in the 280 samples extended the range in all parameters measured 
over that obtained from the breeding population. The SD values of 
SKCS parameters were calculated by the instrument software for 
each sample, and this gave an indication of the variation in the 
sample. Simple linear correlation coefficients among the SKCS 
parameters (Table IV) show that peak force had a significant 
positive correlation with SK-WT (r2 = 0.77), SK-DM (r2 = 0.71), 
because larger kernels require a greater force to crush, but a low 
correlation with SK-HI (r2 = 0.03). The weight and size of the 
kernels were highly correlated, as would be expected. SK-HI was 
only weakly negatively correlated with SK-WT and SK-DM, and 
although the correlations were significant, grain size or weight 
explains very little of the variation in grain hardness. The corre-lations 
were improved by removing data for the tetraploid set 
(SK-HI vs. SK-WT, r2 = 0.20 and SK-HI vs. SK-DM, r2 = 0.19) 
but they were still very low. In hexaploid wheats, smaller kernels 
have been reported to be softer (Gaines et al 1996). 
The simple linear correlation coefficients among wheat and 
semolina properties are shown in Table V. Although HLW was 
correlated with grain weight (SK-WT) and diameter (SK-DM), 
the r2 values were very small. These results are in contrast to a 
study relating SKCS parameters to hard winter wheats (Ohm et al 
1998). Also in a recent report (Troccoli and di Fonzo 1999), the 
test weight of 16 durum cultivars was not correlated with the 
mean individual kernel weights and kernel width. 
Grain protein was not correlated with any of the SKCS 
parameters, and SK-HI was only weakly correlated with SY%. 
Significant correlations were obtained between peak force, SK-WT 
and SK-DM, and the three farinograph parameters, but again 
the r2 values were only 0.25–0.07. Semolina mill yield was posi-tively 
correlated with peak force, SK-WT, SK-DM, and SK-HI. 
Peak force gave the highest correlation coefficient with SY% but 
still explains <30% of the variation in SY%. A similar observation 
was found in a study of 12 hard winter wheats grown at six 
locations in Kansas (Ohm et al 1998). Employing a multiple linear 
regression model to predict SY% from peak force, SK-WT, SK-DM, 
and SK-HI, a significant but low correlation (r2 = 0.08) was 
obtained that would not have practical use in predicting SY%. The 
results show that the SKCS durum parameters are related to 
conventional quality characteristics, but because of the low r2 
values, they would not be adequate for prediction purposes. 
Selection for a smaller range (lower SD) or uniformity for grain 
size, weight, and hardness could be useful when breeding for 
grain with more uniformity. This may improve the consistency of 
quality across different growing environments. 
Prediction of Semolina Milling Yield 
There is potential to develop a calibration for predicting SY% 
using the SKCS because a calibration to predict flour yield has 
already been reported (Osborne et al 1997). A calibration set (Set 
5) of 584 durum breeding lines, for which SY% data were 
available, was used. The four parameters that define the crush 
force profile (area, peak force, Gompertz function A, Gompertz 
function B), together with the kernel weight, were applied to a 
multiple linear regression equation. Given the large number of 
calibration samples, all five terms were included in the regression. 
The fitted versus actual yield had a significant but low correlation 
(r2 = 0.25) with a residual standard deviation (RSD) of 1.5%. 
Figure 6 shows the corresponding scatter plot that exhibits a 
considerable amount of scatter about the fitted line. The repeata-bility 
of Buhler test milling (RSD 0.59%) when measuring SY% 
is better than the prediction model. The 99% confidence range for 
Buhler semolina milling is 1.77, and the range typically found for 
milling durum in the Tamworth breeding program is 66.4–71.9%. 
Therefore, the error in the milling method represents about one 
third of the total variation in actual yields. The criteria for the 
usefulness of the SKCS SY% prediction in a breeding program 
depends on the percentage of incorrectly discarded or retained 
samples. Examination of the scatter diagram indicates that the 
application of a conservative cut-off value of 67.0% for SY% 
using the SKCS fitted yield data would have resulted in a total of 
33 lines being discarded, of which 13 had actual yields >67% and 
would therefore have been incorrectly discarded. Conversely, 551 
lines would be accepted and of these, 61 would have actual yields 
of <67% (11% poor yield lines accepted). The objective in 
breeding for improved grain quality is to move the population 
mean in the required direction, higher in the case of SY%. Despite 
the poor predictive ability, the SKCS method appears to have the 
potential to achieve this. 
One of the main difficulties in predicting SY% in a breeding 
program at the early generation stage is the effect of environment 
on mill extraction. A cultivar or breeding line can display a wide 
range in mill yield across environments (Fig. 7). Some lines 
displayed a narrow range in SY% but others had quite a wide 
range, and on the basis of a causal relationship, they seemed to be 
related to the range in grain weight in these lines (30–57 mg in 
some cases). Because there is a positive correlation between SK-WT 
and SY% (Table V), this would account for some of the 
variation observed. Therefore, even if a line were tested by the SKCS 
4100 at an early generation and predicted to have a low yield, that 
line progressing through the various generations could display a 
wide range in mill performance reflected in between-site and 
seasonal variation. Some lines may have a narrow range in SY% 
across environments, so these would be easier to predict. Attempts 
were made to obtain a prediction of SY% of advanced generation 
lines by analyzing the F3 seed from which these lines were 
derived. Although there was a significant correlation between 
predicted SY% on F3 lines and the Buhler SY% averaged across 
sites for F3-derived advanced lines (r2 = 0.18, P < 0.01), the 
utility of that prediction is questionable. For example, if all lines 
below a SY% of 68 were rejected, many lines that performed 
above this SY% at some sites would also have been rejected. This 
is because some advanced lines varied considerably in their SY% 
across environments (by as much as 7.5% in one case) (Fig. 7). 
The environmental effect on SY% makes prediction in early 
generations uncertain. Further research will be conducted in an 
attempt to improve the value of the SKCS 4100 in the prediction 
of SY% for early generation screening. 
Fig. 7. Plot of single-kernel characterization system (SKCS) predicted 
semolina mill yield (SY%) by analysis of F3 parents against actual labor-atory 
milled % semolina yield of advanced lines grown at various sites.
CONCLUSIONS 
The application of the SKCS 4100 to the analysis of durum wheat 
in a breeding program has been studied. The instrument provides 
accurate and reliable data after adjustment of the factory-installed 
common wheat calibrations and replaces the more time-consuming 
1,000 kernel weight and pearlograph hardness measurements 
previously used in the program. The SKCS 4100 generates infor-mation 
on sample uniformity that has yet to find use in a breeding 
program. The raw SKCS data can be used to develop a calibration 
for semolina mill yield, which could be useful for breeders to move 
the population mean to a higher semolina mill yield by screening 
out a proportion of the poorer lines. A calibration for durum vitreous-ness 
provides a more rapid and objective method than the visual 
inspection method. 
ACKNOWLEDGMENTS 
We thank the Quality Wheat CRC Ltd. and the Grains Research and 
Development Corporation (Project BRI 66) for investing in this research. 
We also thank the Prime Wheat Division of GrainCorp, Narrabri, for 
provision of mottled durum samples, the technical expertise of Narelle 
Egan and Sue Balfe for durum quality analyses and to J. Ronalds and J. 
Oliver for critically reviewing the manuscript. 
LITERATURE CITED 
American Association of Cereal Chemists. 1995. Approved Methods of 
the AACC, 9th ed. Method 26-41, Method 39-10, Method 39-70A, 
Method 44-15A, Method 54-21, The Association: St. Paul, MN. 
Chesterfield, R. S. 1971. A modified barley pearler for measuring 
hardness of Australian wheat. J. Aust. Inst. Agric. Sci. 37:148-151. 
Chung, C. J., Clark, S. J., Lindholm, J. C., McGinty, R. J., and Watson, 
C. A. 1975. The pearlograph technique for measuring wheat hardness. 
Trans. ASAE 18:185-189, 193. 
Dexter, J. E., and Matsuo, R. R. 1981. Effect of starchy kernels, imma-turity 
and shrunken kernels on durum wheat quality. Cereal Chem. 
58:395-400. 
Dexter, J. E., Williams, P. C., Edwards, N. M., and Martin, D. G. 1988. 
10 CEREAL CHEMISTRY 
The relationships between durum wheat vitreousness, kernel hardness 
and processing quality. J. Cereal Sci. 7:169-181. 
Dexter, J. E., Marchylo, B. A., MacGregor, A. W., and Tkachuk, R. 1989. 
The structure and protein composition of vitreous, piebald and starchy 
durum wheat kernels. J. Cereal Sci. 10:19-32. 
Fearn, T 1998. Which way round? Classical and inverse calibration. NIR 
News 9(4):9. 
Gaines, C. S., Finney, P. F., Fleege, L. M., and Andrews, L. C. 1996. 
Predicting a hardness measurement using the single-kernel charac-terization 
system. Cereal Chem. 73:278-283. 
ICC. 1995. Standard Methods of the ICC: Standard No. 129. Method for 
the determination of the vitreousness of durum wheat. ICC: Vienna. 
Kuhlman, D. K., Chung, D. S., McGinty, R., and Watson, C. A. 1979. Modi-fication 
of the pearler for wheat-hardness tests. Trans. ASAE 22:881-885. 
Martin, C. R., Rousser, R., and Brabec, D. L. 1993. Development of a 
single-kernel wheat characterization system. Trans. ASAE 36:1399-1404. 
Matsuo, R. R., and Dexter, J. E. 1980. Relationship between some durum 
wheat physical characteristics and semolina milling properties. Can. J. 
Plant Sci. 60:49-53. 
Ohm, J. B., Chung, O. K., and Deyoe, C. W. 1998. Single-kernel char-acteristics 
of hard winter wheats in relation to milling and baking 
quality. Cereal Chem. 75:156-161. 
Osborne, B. G., Kotwal, Z., Blakeney, A. B., O’Brien, L., Shah, S., and 
Fearn, T. 1997. Application of the single-kernel characterization system to 
wheat receival testing and quality prediction. Cereal Chem. 74:467-470. 
Pearson, J. G., and Wedd, S. 1978. Technical Report 78/4. Ag. Engi-neering 
Centre, Dept of Agriculture NSW: Glenfield, NSW. 
Satumbaga, R., Martin, C., Eustace, D., and Deyoe, C. W., 1995. Rela-tionship 
of physical and milling properties of hard red winter wheat 
using the single kernel wheat characterization system. Assoc. Operative 
Tech. Bull. January 6487-6496. 
Sissons, M. J., Batey, I. L., Hare, R. A., and Egan, N. 1998. Tetraploid 
wheat—A potentially useful resource for the genetic improvement of 
durum wheat. Pages 145-149 in: Cereals 98. Proc. 48th Australian 
Cereal Chemistry Conf. RACI: North Melbourne, Australia. 
Troccoli, A., and di Fonzo, N. 1999. Relationship between kernel size 
features and test weight in Triticum durum. Cereal Chem. 76:45-49. 
Williams, P. C., Sobering. D., Knight, J., and Psotka, J. 1998. Application 
of the Perten SKCS-4100 single kernel characterization system to 
predict kernel texture on the basis of particle size index. Cereal Foods 
World 43:550. 
[Received April 20, 1999. Accepted September 21, 1999.]

More Related Content

Viewers also liked

TrustPort – antivirus, antispyware, antispam, firewall – data protection, net...
TrustPort – antivirus, antispyware, antispam, firewall – data protection, net...TrustPort – antivirus, antispyware, antispam, firewall – data protection, net...
TrustPort – antivirus, antispyware, antispam, firewall – data protection, net...internetsecuritytutorial
 
Наша Молодежь и Кадры для ОПК России
Наша Молодежь и Кадры для ОПК РоссииНаша Молодежь и Кадры для ОПК России
Наша Молодежь и Кадры для ОПК РоссииДмитрий Дружинин
 
Equipment and human resource management in construction project
Equipment and human resource management in construction projectEquipment and human resource management in construction project
Equipment and human resource management in construction projectBabak Farahmand Shad
 
Hr Policy Of Aditya Birla Group
Hr Policy Of Aditya Birla GroupHr Policy Of Aditya Birla Group
Hr Policy Of Aditya Birla GroupAmruta Newalkar
 
Questionnaire version finale
Questionnaire version finaleQuestionnaire version finale
Questionnaire version finaleHenrik Ørvad
 

Viewers also liked (10)

TrustPort – antivirus, antispyware, antispam, firewall – data protection, net...
TrustPort – antivirus, antispyware, antispam, firewall – data protection, net...TrustPort – antivirus, antispyware, antispam, firewall – data protection, net...
TrustPort – antivirus, antispyware, antispam, firewall – data protection, net...
 
[123doc.vn] bai-tap-on-tap-chuong-thong-ke
[123doc.vn]   bai-tap-on-tap-chuong-thong-ke[123doc.vn]   bai-tap-on-tap-chuong-thong-ke
[123doc.vn] bai-tap-on-tap-chuong-thong-ke
 
Наша Молодежь и Кадры для ОПК России
Наша Молодежь и Кадры для ОПК РоссииНаша Молодежь и Кадры для ОПК России
Наша Молодежь и Кадры для ОПК России
 
Resistor
ResistorResistor
Resistor
 
Capital market in india
Capital market in indiaCapital market in india
Capital market in india
 
Equipment and human resource management in construction project
Equipment and human resource management in construction projectEquipment and human resource management in construction project
Equipment and human resource management in construction project
 
nationality
nationalitynationality
nationality
 
Hr Policy Of Aditya Birla Group
Hr Policy Of Aditya Birla GroupHr Policy Of Aditya Birla Group
Hr Policy Of Aditya Birla Group
 
MemoireYS
MemoireYSMemoireYS
MemoireYS
 
Questionnaire version finale
Questionnaire version finaleQuestionnaire version finale
Questionnaire version finale
 

Similar to 0deec51c93c5359681000000

Charles and Gampala_et_al-2008-Starch in Processed Cheese
Charles and Gampala_et_al-2008-Starch in Processed CheeseCharles and Gampala_et_al-2008-Starch in Processed Cheese
Charles and Gampala_et_al-2008-Starch in Processed CheesePradyumna Gampala
 
Pozzolanic Activity of Sugarcane Bagasse Ash Concrete
Pozzolanic Activity of Sugarcane Bagasse Ash ConcretePozzolanic Activity of Sugarcane Bagasse Ash Concrete
Pozzolanic Activity of Sugarcane Bagasse Ash Concretepaperpublications3
 
Cheddar whey processing and source I. Effect oncompositio.docx
Cheddar whey processing and source I. Effect oncompositio.docxCheddar whey processing and source I. Effect oncompositio.docx
Cheddar whey processing and source I. Effect oncompositio.docxchristinemaritza
 
Evaluation of some physicochemical and pasting properties of three improved c...
Evaluation of some physicochemical and pasting properties of three improved c...Evaluation of some physicochemical and pasting properties of three improved c...
Evaluation of some physicochemical and pasting properties of three improved c...Adindu Linus-Chibuezeh
 
IRJET- Cassava Starch Supplementation Modulates Behavioural Characteristi...
IRJET-  	  Cassava Starch Supplementation Modulates Behavioural Characteristi...IRJET-  	  Cassava Starch Supplementation Modulates Behavioural Characteristi...
IRJET- Cassava Starch Supplementation Modulates Behavioural Characteristi...IRJET Journal
 
Nigeria food industry introduction
Nigeria food industry introductionNigeria food industry introduction
Nigeria food industry introductionAlexander Decker
 
J0333050055
J0333050055J0333050055
J0333050055theijes
 
Soil Image Processing to Extract SCN eggs.pdf
Soil Image Processing to Extract SCN eggs.pdfSoil Image Processing to Extract SCN eggs.pdf
Soil Image Processing to Extract SCN eggs.pdfIowa State University
 
Development and Characterization of Adsorbent from Rice Husk Ash to Bleach Ve...
Development and Characterization of Adsorbent from Rice Husk Ash to Bleach Ve...Development and Characterization of Adsorbent from Rice Husk Ash to Bleach Ve...
Development and Characterization of Adsorbent from Rice Husk Ash to Bleach Ve...IOSR Journals
 
New methods of removing soil debris, separating worm eggs, and counting them ...
New methods of removing soil debris, separating worm eggs, and counting them ...New methods of removing soil debris, separating worm eggs, and counting them ...
New methods of removing soil debris, separating worm eggs, and counting them ...Iowa State University
 
Extracting and counting of parasite eggs from soil
Extracting and counting of parasite eggs from soilExtracting and counting of parasite eggs from soil
Extracting and counting of parasite eggs from soilIowa State University
 
The potential of corn cobs as source of fertilizer for white corn production ...
The potential of corn cobs as source of fertilizer for white corn production ...The potential of corn cobs as source of fertilizer for white corn production ...
The potential of corn cobs as source of fertilizer for white corn production ...Bureau of Agricultural Research
 

Similar to 0deec51c93c5359681000000 (20)

Charles and Gampala_et_al-2008-Starch in Processed Cheese
Charles and Gampala_et_al-2008-Starch in Processed CheeseCharles and Gampala_et_al-2008-Starch in Processed Cheese
Charles and Gampala_et_al-2008-Starch in Processed Cheese
 
Pozzolanic Activity of Sugarcane Bagasse Ash Concrete
Pozzolanic Activity of Sugarcane Bagasse Ash ConcretePozzolanic Activity of Sugarcane Bagasse Ash Concrete
Pozzolanic Activity of Sugarcane Bagasse Ash Concrete
 
Cheddar whey processing and source I. Effect oncompositio.docx
Cheddar whey processing and source I. Effect oncompositio.docxCheddar whey processing and source I. Effect oncompositio.docx
Cheddar whey processing and source I. Effect oncompositio.docx
 
Evaluation of some physicochemical and pasting properties of three improved c...
Evaluation of some physicochemical and pasting properties of three improved c...Evaluation of some physicochemical and pasting properties of three improved c...
Evaluation of some physicochemical and pasting properties of three improved c...
 
IRJET- Cassava Starch Supplementation Modulates Behavioural Characteristi...
IRJET-  	  Cassava Starch Supplementation Modulates Behavioural Characteristi...IRJET-  	  Cassava Starch Supplementation Modulates Behavioural Characteristi...
IRJET- Cassava Starch Supplementation Modulates Behavioural Characteristi...
 
Nigeria food industry introduction
Nigeria food industry introductionNigeria food industry introduction
Nigeria food industry introduction
 
poster-linked
poster-linkedposter-linked
poster-linked
 
J0333050055
J0333050055J0333050055
J0333050055
 
Soil Image Processing to Extract SCN eggs.pdf
Soil Image Processing to Extract SCN eggs.pdfSoil Image Processing to Extract SCN eggs.pdf
Soil Image Processing to Extract SCN eggs.pdf
 
AUTEX published paper
AUTEX published paperAUTEX published paper
AUTEX published paper
 
Correlation between milling and baking parameters
Correlation between milling and baking parametersCorrelation between milling and baking parameters
Correlation between milling and baking parameters
 
Fj349961003
Fj349961003Fj349961003
Fj349961003
 
JUST HATCHED
 JUST HATCHED JUST HATCHED
JUST HATCHED
 
Development and Characterization of Adsorbent from Rice Husk Ash to Bleach Ve...
Development and Characterization of Adsorbent from Rice Husk Ash to Bleach Ve...Development and Characterization of Adsorbent from Rice Husk Ash to Bleach Ve...
Development and Characterization of Adsorbent from Rice Husk Ash to Bleach Ve...
 
G0424249
G0424249G0424249
G0424249
 
New methods of removing soil debris, separating worm eggs, and counting them ...
New methods of removing soil debris, separating worm eggs, and counting them ...New methods of removing soil debris, separating worm eggs, and counting them ...
New methods of removing soil debris, separating worm eggs, and counting them ...
 
Extracting and counting of parasite eggs from soil
Extracting and counting of parasite eggs from soilExtracting and counting of parasite eggs from soil
Extracting and counting of parasite eggs from soil
 
The potential of corn cobs as source of fertilizer for white corn production ...
The potential of corn cobs as source of fertilizer for white corn production ...The potential of corn cobs as source of fertilizer for white corn production ...
The potential of corn cobs as source of fertilizer for white corn production ...
 
Sieving Final Report
Sieving Final ReportSieving Final Report
Sieving Final Report
 
mc
mcmc
mc
 

0deec51c93c5359681000000

  • 1. Application of the Single-Kernel Characterization System to Durum Wheat 4 CEREAL CHEMISTRY Testing and Quality Prediction M. J. Sissons,1–3 B. G. Osborne,4 R. A. Hare,1,2 S.A. Sissons,1,2 and R. Jackson4 ABSTRACT Cereal Chem. 77(1):4–10 The Single Kernel Characterization System (SKCS 4100) measures single kernel weight, width, moisture content, and hardness in wheat grain with greater speed than existing methods and can be calibrated to predict flour starch damage and milling yield. The SKCS 4100 is poten-tially useful for testing applications in a durum improvement program. The mean SKCS 4100 kernel weight and moisture values from the analysis of 300 individual kernels gave good correlations with 1,000 kernel weight (r2 = 0.956) and oven moisture (r2 = 0.987), respectively. Although significant correlations were obtained between semolina mill yield and SKCS 4100 weight, diameter, and peak force, they were all very low and would be of little use for prediction purposes. Similarly, although there were significant correlations between some SKCS 4100 parameters and test weight and farinograph parameters, they too were small. The SKCS 4100 has been calibrated using either the single kernel hardness index or crush force profile to objectively measure the percen-tage vitreous grains in a sample with reasonable accuracy, and it correlates well with visual determination. The speed and accuracy of the test would be of interest to grain traders. An imprecise but potentially useful cali-bration was obtained for the prediction of semolina mill yield using the SKCS 4100 measurements on durum wheat. The SKCS 4100 is useful for some traits such as hardness, grain size and moisture for early-generation (F3) selection in a durum improvement program. The evaluation of durum (Triticum turgidum L., ssp. durum Desf.) breeding lines for quality in the Australian National Durum Wheat Improvement Program, Tamworth, NSW, involves a series of tests of varying complexity and expense. It would be desirable to develop more rapid and economical methods to predict end-use quality. In the program at Tamworth, grain size was measured as 1,000 kernel weight grain hardness using a pearlograph (Ches-terfield 1971, Pearson and Wedd 1978), and grain protein and moisture content was measured by near-infrared reflectance spectro-scopy (NIR). These tests give an estimate of the whole sample but do not measure individual kernels and thus do not provide any information on sample uniformity. Selection for those crossbreeds that give a small range in grain size distribution, for example, should produce a more uniform grain size, which millers claim to be more acceptable as such lots of wheat condition more evenly and mill more efficiently. The Single Kernel Characterization System (SKCS) 4100 (Perten Instruments North America Inc., Springfield, IL) was developed for the measurement of single kernel weight, width (either lateral or longitudinal depending on the orientation of the kernel when it reaches the crescent), moisture, and hardness in wheat (Martin et al 1993). This technology provides the possibility of obtaining data on the uniformity of a grain sample with essentially the same speed as bulk tests that offer an average value only. The SKCS 4100 is a potentially useful tool to a plant breeder by maximizing the number of tests conducted simultaneously and providing useful mean and distribution information on bulk (300 kernel) samples. The SKCS 4100 can be used to measure single kernel hardness index (SK-HI), single kernel moisture content (SK-MC), single kernel weight (SK-WT), and single kernel diameter (SK-DM). In the SKCS analysis, a small sample (»20 g) of grain is deposited into a hopper where a rotating wheel (with the aid of a vacuum) picks up individual kernels and deposits them one at a time into a weighing boat. After weighing, the kernel passes down an inclined crescent where the diameter is measured and the kernel is then crushed between the crescent and a toothed rotor. A load cell measures and records the crush force-time profile. A sample comprising a preset number of kernels (usually 300) are individually analyzed in 3–5 min and the data presented as a distribution with mean and standard deviation calculated for each of the four measurements. Results of recent work have indicated that calibration equations may be derived to predict wheat texture (Gaines et al 1996), flour milling yield (Satumbaga et al 1995, Osborne et al 1997), and starch damage (Osborne et al 1997) from the SKCS 4100 data. In durum wheat, the proportion of vitreous durum kernels is an important parameter for high semolina milling yield and main-taining quality of the derived pasta. Vitreous durum kernels appear glassy and translucent due to the compact structure of the protein matrix and starch granules. Nonvitreous or starchy kernels are opaque due to air spaces between starch granules (Dexter et al 1989). When milled, starchy kernels reduce to fines, decreasing semolina extraction (Dexter and Matsuo 1981). The estimation of vitreous kernel content in durum wheat is an important international grading factor and is performed by visual inspection (ICC 1995), which is a subjective and tedious procedure. Since the SKCS 4100 provides data related to kernel hardness, it should be possible to develop a calibration to measure durum vitreousness, a more rapid and objec-tive method than visual assessment. The aim of this work was to evaluate the utility of the SKCS 4100 in a durum breeding program and, specifically, to develop new calibrations to predict kernel vitreousness and semolina mill yield. MATERIALS AND METHODS Samples Several sample sets were used in this study. Each set was selected to enable different issues to be addressed. Set 1 (repeatability) assessed the repeatability of each SKCS parameter. Six durum crossbred lines grown at two different sites were analyzed repeatedly (n = 20) by one operator. Set 2 (accuracy) assessed the accuracy of the SKCS weight. A subset of 50 samples from Set 5 was used for which 1,000 kernel weight data were available. In addition, the distribution in kernel weight was obtained from a 300-kernel sample where the weight of each kernel was measured on an analytical balance and the SK-WT was obtained by the SKCS 4100. The SK-DM measurement of 300 individual kernels was compared with manually measured diameter of each kernel using digital calipers. To assess the accuracy of the SKCS 4100 moisture content measurement a sample set of 36 samples was prepared. Each durum wheat sample was cleaned using a Carter-Day dockage tester (Simon Carter Co., 1 Tamworth Centre for Crop Improvement, Tamworth NSW 2340 Australia. 2 Quality Wheat CRC Ltd., North Ryde NSW 2113 Australia. 3 Corresponding author. E-mail: mike.sissons@agric.nsw.gov.au Phone: 61 267 631 119. Fax: 61 267 631 222. 4 BRI Australia Ltd., North Ryde, NSW 2113 Australia. Publication no. C-1999-1203-02R. © 2000 American Association of Cereal Chemists, Inc.
  • 2. Vol. 77, No. 1, 2000 5 Minneapolis, MN). Grain <6 mm (No. 25 screen) and >2 mm was divided into aliquots of 100 g. Samples were either partly dried in an oven at 50°C or had water added (1–6% by weight) to achieve final moisture percentages of 8–16%. The sample (100 g) was sealed in a plastic screw-capped container (11 x 4 cm) and mixed by hand by inverting continuously for 5 min to disperse the water evenly over the surface of the grain. Four hours later, the container was again mixed for 5 min. The tempered wheat was stored over-night at room temperature. The moisture content of a subsample was determined by oven-drying (Approved Method 44-15A, AACC 1995); the SK-MC was obtained concurrently on the equilibrated samples. For comparing pearlograph hardness to SKCS hardness, all 584 lines from Set 4 were evaluated. Set 3 (vitreousness) was used to develop a durum vitreousness calibration. Two subsets were prepared (one in each of the colla-borating laboratories). In the first subset, a commercial sample of durum was first separated into 100% vitreous and 100% nonvitreous fractions by visual identification of individual kernels. From each of these two fractions, a calibration set was prepared by mixing vitreous with nonvitreous grains to form a 300-kernel samples of 0, 25, 50, 75, 85, 90, 95, 98, and 100% vitreousness. Each 300-kernel sample was analyzed using the SKCS 4100, and the mean SK-HI was calculated. The determination of %vitreousness by visual inspec-tion was a modification of a method produced by AWB Ltd. (Melbourne, Australia). A 300-kernel sample was obtained and separated into vitreous, mottled, and bleached fractions. Occasion-ally, kernels from the bleached fraction were split lengthwise by a scalpel, and any kernel with opaque starchy areas inside was classed as mottled. Grain was screened through a 2.0-mm slotted screen, and 300 kernels were counted and classified as vitreous or nonvit-reous. Vitreous kernels are bright and translucent with a uniform amber color. Starchy or nonvitreous kernels have opaque areas with a dull yellow appearance. Bleached kernels are dull with a pale washed-out appearance. To distinguish starchy from bleached ker-nels, it was sometimes necessary to cut the bleached kernels longi-tudinally; those with any opaque areas were classed as starchy. The %vitreousness was defined as the proportion of vitreous kernels in a 300-kernel sample. Another set of samples was obtained to test the SKCS vitreous calibration (prediction set) consisting of 22 sam-ples of commercial durum (supplied by GrainCorp Operations Ltd., Narrabri, NSW) where %vitreous count was determined visually. For the second subset, three samples of Australian durum were obtained from three different farms in New South Wales. A further five samples were obtained from the Cereals Institute, Greece, in the course of a ring test on ICC Standard No. 129 (ICC 1995). These eight samples were analyzed (five replicates) for %vitreous-ness by ICC Standard No. 129. Two of the Australian samples and four of the ICC samples were separated into 100% vitreous and 100% nonvitreous fractions by visual identification of individual kernels. Nineteen mixtures of varying %vitreousness (0, 25, 50, 75, 85, 90, 95, 98, and 100%) were then prepared by counting the appropriate proportions of kernels to form a 200-kernel sample for analysis by the SKCS 4100 to produce a set of 27 samples in total. Set 4 was constructed to relate farinograph data (Approved Method 54-21), grain protein, and hL weight to SKCS parameters. Of the 584 lines from set 5, only 280 samples were available to relate these properties to SKCS parameters. In this set of 280 samples, there were 32 tetraploid accessions (Sissons et al 1998). Set 5 (breeding material) was a calibration sample set used to determine whether the SKCS 4100 could be used to predict semo-lina mill yield (SY%). This set was made up of 584 crossbreeds at an advanced (F5 to F7) stage of breeding over several years (1993–1997) and 32 genetically diverse tetraploid wheats (Sissons et al 1998). After cleaning on a Carter-Day dockage tester (settings as for Set 2), tests included 1,000 grain weight (weight of 250 kernels × 4), pearlograph grain hardness (Chung et al 1975, Kuhlman et al 1979), grain protein by NIR (Approved Method 39- 10), and hL weight. Grain was milled into semolina using a laboratory mill (Buhler MLU 202) (Approved Method 26-41). SY% was expressed on a total products basis. SKCS 4100 Measurements SKCS 4100 measurements were carried out according to the operating manual (Perten Instruments 1995), using 300 grains. Types of data recorded were: 1) four default measurements (SK-HI, SK-MC, SK-WT, SK-DM); 2) raw data used to calculate the default measurements (X-array); 3) X-array expanded to 40 variables with the use of transform functions such as exponentials, logarithms, inverse terms and ratios (Big File). Sample Sets 1 and 2 were used to assess the precision and accuracy of the default measurements and Set 4 was used to derive simple correlations between the default measurements and grain and semolina quality characteristics. Sample Sets 3 and 5 were used to develop new calibrations for vitreousness and semolina yield. The latest version of the instru-ment software (5.00C) allowed user calibrations to be installed but could only accept equations derived directly from the X-Array data using multiple linear regression. Therefore, a computer file was collected containing the averages of the X-array variables weight (mg), peak force (maximum load cell force, A/D counts), conduc-tivity (A/D counts), area (area of the crush force profile, A/D count-second), GompA (Gompertz function coefficient A, a func-tion describing the intercept of the normalized cumulative frequency distribution of the first derivative value of the crush force-time profile), GompB (Gompertz function coefficient B, a coefficient describing the slope of the normalized cumulative frequency distribution of the first derivative value of the force-time crush profile), length (length of the crush period, number of data points in the crush force profile), diameter (mm), (equivalent to the breadth of the kernel), crescent temperature (°F), and DyFraction (time interval that a kernel exerts force on the crescent). Because the TABLE I Precision of Single-Kernel Characterization System (SKCS) Parameters for Durum Graina,b SK-WT (mg) SK-DM (mm) SK-HI SK-MC (%) Sample Mean SD Mean SD Mean SD Mean SD 1 45.5 0.89 2.98 0.034 87.2 1.03 10.6 0.03 2 38.1 0.87 2.68 0.036 88.2 1.07 9.5 0.09 3 51.1 0.79 3.01 0.037 86.9 0.82 10.5 0.04 4 41.7 1.10 2.76 0.041 92.5 0.91 9.5 0.03 5 37.9 0.65 2.66 0.030 91.1 0.95 9.5 0.04 6 48.8 0.85 3.05 0.033 90.7 0.95 10.2 0.02 Overall mean 43.8 2.87 89.4 10.0 Pooled SD 0.85 0.034 0.95 0.041 CV% (range)c 1.54–2.64 1.10–1.54 0.95–1.22 0.22–0.95 a Six different samples of durum wheat were each analyzed 20 times. Mean and standard deviation (SD) of the n = 20 samples were calculated. b SK-WT = single kernel weight; SK-DM = single kernel diameter; SK-HI = single kernel hardness index; SK-MC = single kernel moisture content. c Coefficient of variation.
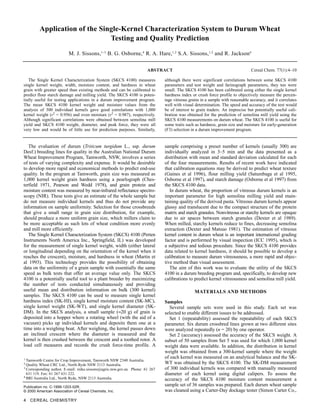
  • 3. acquisition of the crush force A/D count versus time data is too slow relative to the speed of the singulator, only summary data (peak force, peak area, GompA, and GompB) are stored in routine use. These summary data together with average kernel weight were used in multiple regression analysis to predict %vitreousness and SY% Statistical Analysis The X-array data were imported into Excel v7 (Microsoft Corp-oration, Redmond, WA) and the resulting Excel spreadsheets were imported into Minitab v. 11 (Minitab Inc., State College, PA). Simple correlations and multiple linear regression equations were calculated using the method of least squares. Where selection of terms to be included in the regression equation was indicated, this was calculated as the residual sums of squares for all possible regressions with one or more terms. Then, using the residual sum of squares to compare equations with the same number of terms, the best one-term, two-terms, etc., equations were identified. RESULTS AND DISCUSSION Precision and Accuracy of SKCS 4100 Measurements The mean and standard deviation (SD) for each of the six durum samples of Set 1 after repeated analysis (n = 20) and the pooled SD of repeatability for kernel weight (SK-WT), diameter (SK-DM), hardness (SK-HI, and moisture (SK-MC) are given in Table I. Fig. 1. Linear regression plot of single-kernel characterization system (SKCS) single kernel weight (SK-WT) vs. 1,000 kernel weight. SK-WT = 2.18 + 0.978 × 1,000 kernel weight; r2 = 0.956, n = 50, relative standard deviation = 1.83 g. 6 CEREAL CHEMISTRY When expressed as the coefficient of variation (CV%), the re-peatability of all the SKCS parameters is very low (CV% = 0.2– 2.7%), indicating excellent precision. The precision reported for durum is similar to that obtained for bread wheat (Osborne et al 1997). The SKCS 4100 is factory-calibrated for common wheat. Therefore, it is necessary to verify the accuracy of these calibra-tions for each different grain type and to make skew or bias adjust-ments if required. Accuracy was determined by comparing the SKCS measured data with standard physical testing methods used in the Tamworth laboratory from sample Sets 2 and a subset of Set 4. The SKCS weigher operates on the principle that a kernel dropped into the plastic weighing boat causes the boat to depress, and the electrical force required to return the boat to a horizontal position is proportional to the mass of the kernel. Therefore, SK-WT is a secondary measurement that requires calibration against an analytical balance. The distribution in kernel weight obtained from two 300-kernel samples measured using an analytical balance and the SKCS SK-WT data were compared. Both samples pro-duced virtually identical comparisons (data not shown). There was an excellent agreement between the two methods with no significant difference (P < 0.05) in the means determined by unpaired t-test and a small residual standard deviation of the differences. There was an excellent correlation (r2 = 0.956) and low residual standard devi-ation (RSD) of 1.83 g between SK-WT and 1,000 kernel weight (Fig. 1) for durum similar to that reported for bread wheat (Os-borne et al 1997). The equation was SK-WT = 2.18 + 0.978 × 1,000 kernel weight, where the slope and bias are not significantly different from a slope of 1.0 and a bias of 0.0 at P < 0.05. Fig. 2. Frequency distribution of the diameter of individual durum kernels in a sample measured using the single-kernel characterization system (SKCS) single kernel diameter (SK-DM) and measured with calipers. Fig. 3. Linear regression plot of single-kernel characterization system (SKCS) measured SK-HI vs. Pearlograph hardness. r2 = 0.462, n = 584, relative standard deviation = 5.97. Fig. 4. Crush force profiles for samples of Australian durum (AD) with different %vitreousness. Each trace is the average of 200 kernels. Trace furthest from x-axis at measurement number 350 is the 100% vitreous sam-ple, followed in order moving closer to the x-axis by 68, 40, 30, and 0%.
  • 4. Mean (n = 280), Standard Deviation (SD), and Range of Single-Kernel Characterization System (SKCS), Milling, and Dough Rheology Characteristics of Durum Wheat Samplesa,b Characteristic Mean SDc Minimum Maximum Peak force 1,907.0 271.0 760.0 2,921.0 SK-WT (mg) 38.2 (10.8) 5.7 25.5 (7.6) 59.2 (16.3) SK-DM (mm) 2.6 (0.5) 0.2 2.1 (0.4) 3.4 (0.7) SK-HI 96.2 (15.1) 8.2 14.6 (0.5) 111.2 (18.9) SK-MC (%) 11.4 (0.3) 0.4 10.1 (0.2) 13.1(0.4) HW (kg/hL) 79.1 1.9 72.3 83.9 Grain protein (%) 14.4 1.2 10.6 18.2 DDT (min) 3.4 0.7 1.2 5.0 B10 (BU) 57.4 29.6 20.0 180.0 FWA (%) 60.6 2.2 55.3 67.8 Total mill yield (%) 79.7 2.0 64.7 86.6 SY% 68.2 2.7 43.3 75.6 a SK-WT = single kernel weight; SK-DM = single kernel diameter; SK-HI = single kernel hardness index; SK-MC = single kernel moisture content. HW hectoliter weight; DDT = Farinograph dough development time; B10 = break-down after 10 min; FWA = farinograph water absorption; SY% = semolina mill yield percentage. b For each of the 280 samples analyzed, the SKCS gave a mean and standard deviation from the analysis of 300 kernels. The average of these 280 standard deviation values is shown in parentheses. c Standard deviation calculated for the data from the 280 samples. Vol. 77, No. 1, 2000 7 The diameter measurement of the kernel is based on the width at the point of first contact in the gap formed between the crescent and the rotor arc. This point is determined by the number of data scan intervals from contact to exit. A distribution of SK-DM obtained from the analysis of »300 kernels was compared to manually measuring the diameter of the same 300 kernels using digital calipers (Fig. 2). The SKCS 4100 assigned a number of kernels to sizes >3.5 mm and <1.8 mm, whereas no kernels were >3.8 and <1.8 mm when measured with calipers. Some error would arise in the manual measurement because kernels vary in shape, and it would not always be possible to obtain an accurate measure of diameter. On the other hand, the SKCS diameter measurement will be influenced by the orientation of the kernel as it enters the crescent. An unpaired t-test revealed a difference in the means (P < 0.05) of the two methods of measurement reflecting the above differences. The SK-MC measure is accurate (r2 = 0.987; RSD = 0.18%) over a broad range of moisture values. The equation was SK-MC = 1.045 × oven moisture – 0.06, where the slope and bias are not significantly different from a slope of 1.0 and a bias of 0.0 at P < 0.05. The SK-HI measure is based on the crescent load cell A/D counts measured over a period of 125 msec. The raw data can be recorded and plotted as a force-time crush profile. The peak force and the area under the curve is a measure of the energy required to crush the kernel; the harder the kernel the greater this energy. The selection of a numeric scale for SK-HI is used for the purposes of classification of wheat kernels into soft and hard and was based on the earlier use of an arbitrary scale for wheat hardness by NIR (Approved Method 39-70A). The Tamworth laboratory has been using a pearlograph to measure grain hardness but this does not give a strong correlation (r2 = 0.46) with SK-HI (Fig. 3). The graph shows some clusters of anomalous data for which the most likely explanation is that the two methods measure different aspects of grain hardness (i.e., the pearlograph measures the kernel’s resistance to abrasion, whereas the SKCS 4100 measures the force deformation profile during the crushing of the kernel). Furthermore, the SKCS 4100 was optimized to detect mixed hard and soft common wheat; durum was not included in the original Fig. 5. Linear regression between average weight and average Gompertz B of 27 different mixtures of durum grain. %Vitreousness = –3841 – 2.6 Avgwt + 4262 AvggB; r2 = 0.993, n = 27, relative standard deviation = 2.953. TABLE II TABLE III Visual vs. Single-Kernel Characterization System (SKCS) Methods to Measure Durum Vitreousnessa Sample SKCS Classification into Gradeb No. Visual (%) M1 (%) M2 (%) Visual M1 M2 13 60 92 78 Unclassified ADR1 ADR3 20 66 69 74 Unclassified ADR3 ADR3 3 75 74 92 ADR3 ADR3 ADR1 21 76 81 89 ADR3 ADR2 ADR2 9 77 76 98 ADR3 ADR3 ADR1 15 84 100 87 ADR2 ADR1 ADR2 22 84 93 97 ADR2 ADR1 ADR1 2 86 97 100 ADR2 ADR1 ADR1 6 89 99 88 ADR2 ADR1 ADR2 8 89 88 100 ADR2 ADR2 ADR1 11 89 89 100 ADR2 ADR2 ADR1 17 90 98 92 ADR1 ADR1 ADR1 18 90 92 99 ADR1 ADR1 ADR1 1 92 95 100 ADR1 ADR1 ADR1 19 92 100 90 ADR1 ADR1 ADR1 5 93 91 100 ADR1 ADR1 ADR1 14 94 94 98 ADR1 ADR1 ADR1 4 95 94 100 ADR1 ADR1 ADR1 12 97 92 94 ADR1 ADR1 ADR1 7 98 92 100 ADR1 ADR1 ADR1 10 98 96 100 ADR1 ADR1 ADR1 16 98 90 93 ADR1 ADR1 ADR1 a Predicted % vitreous kernels using SKCS hardness index calibration equation M1 or X-array data equation M2. b Classification based on Australian durum grading system ADR1 ³ 90%; ADR2 80–89%; ADR3 75–79%; no classification <75%.
  • 5. calibration. A Tamworth-specific method was used in this study due to the lack of a fundamental reference method. However, a more suitable physical test for accuracy comparison would be PSI because a good correlation was found between PSI and SK-HI in bread wheats (Osborne et al 1997, Williams et al 1998). In summary, the SKCS 4100 provides accurate and reliable data on durum grain, weight, and moisture from as little as 300 grains and can be used to replace the more time-consuming methods previously used in a durum quality testing laboratory. Its implementation would reduce the time required for analysis. It is not possible to comment on the accuracy of the SKCS 4100 for diameter and hardness due to lack of fundamental reference methods. Prediction of Durum Vitreousness Using the SKCS 4100 Vitreousness in durum is an important international grading factor and a high percentage of vitreous kernels (>90%) is desired. The system used in Australia has three grades: ADR1 (Australian Durum Grade 1) ³90%, ADR2 80–89%, ADR3 <79% (AWB Ltd., Australia). Starchy durum tends to be lower in protein content than vitreous durum wheat (Dexter et al 1988), imparting poor cooking quality to pasta (Matsuo and Dexter 1980, Dexter and Matsuo 1981). Several studies have shown that starchy durum wheat is softer than vitreous durum wheat (Matsuo and Dexter 1980, Dexter and Matsuo 1981, Dexter et al 1988), so rapid methods to measure grain hardness would be a useful alternative to the visual assessment of vitreous kernels. Using sample Set 3 (subset 1), vitreousness was measured at 0, 25, 50, 75, 85, 90, 95, 98, and 100%, with hardness varying from 95–52 SK-HI index units. Of particular interest is whether the SKCS 4100 can discriminate samples within the range of vitreous-ness of the commercially useful range of 75–90% to classify grain lots into one of the three grades. The calibration set gave an excellent correlation was obtained (r2 = 0.993) (Eq. M1: %Vitreousness = 0.395 SK-HI + 54.667) between SK-HI and %vitreous durum kernels. Using sample Set 3 (subset 2), crush force profiles plotted as load cell A/D counts versus measurement number (Fig. 4) con-firmed that a greater force is required to crush the vitreous kernels than with the nonvitreous kernels. There was also a systematic relationship between %vitreous kernels in a sample and the shape of the crush force profile. X-Array data were used to construct a multiple regression equation to predict vitreousness. Examination 8 CEREAL CHEMISTRY of all possible combinations of terms produced a two-term equation (Eq. M2, Fig. 5): % = –3841 – 2.6 AvgWt + 4262 AvggB, r2 = 0.993, RSD = 2.953, P < 0.001, where AvgWt is average grain weight; AvggB is average Gompertz function coeffi-cient B performed as well as the equation containing all five X-array terms describing the kernel weight and crush force profile. Weight is required in the prediction to correct for the fact that larger kernels require a greater force to crush them, but only one of the functions that describe the force crush profile was required as these were all very highly intercorrelated (r > 0.97). To evaluate both equations M1 and M2, a prediction set of 22 samples of commercial durum (Set 3) with starchy kernels present was assessed visually for %vitreous kernels and analyzed by the SKCS 4100. This sample set exhibited a visual percentage vitreousness count of 60–98% (Table II). Using %vitreous kernel ranges applicable to marketing (samples 13 and 20 were exclu-ded), the two SKCS calibrations were compared with the visual method. There was a 25% error rate of prediction using equation M1 and a 35% error rate for M2. Equation M1 gave a lower error than M2 in this limited sample set and would be a better choice as a calibration method. A possible explanation for these discrep-ancies is that with the visual method, kernels are classified as starchy even when a small portion of the kernel is affected. However, to the SKCS 4100, this type of kernels has hardness similar to vitreous kernels and therefore the SKCS 4100 would give a higher %vitreousness estimation. From a breeder’s viewpoint, this is preferable to rejecting vitreous lines, but not from a marketer’s per-spective. It should be noted that the classification system between the three grades is rigid in that a vitreousness of 89 vs. 90% gives a different grading. Whether there is any difference in quality between a value of 90 vs. 89% is not known, but it would seem unlikely. It would be more reasonable to have a range of overlap. The preliminary results show that the SKCS 4100 could be used to measure %vitreousness in a sample of durum, but the calibra-tion needs to be further assessed with a larger prediction set. The SKCS 4100 would be a more reliable and objective method compared to the visual approach. Relationships Among Single Kernel Characteristics with Wheat and Semolina Parameters Advanced durum breeding lines and a diverse set of tetraploid accessions (Set 4) (n = 280 samples) were evaluated for hL weight (HLW), grain protein (NIR), total mill yield, and SY%, Farino-graph dough development time (DDT), breakdown after 10 min (B10), water absorption (FWA), and the five SKCS mean Fig. 6. Plot of fitted semolina mill yield predicted from analysis of single-kernel characterization system (SKCS) low-level machine data vs. semolina mill yield % measured by a laboratory mill. TABLE IV Simple Correlation Coefficients Among Single-Kernel Characterization System (SKCS) Measurements (n = 280)a Peak Force SK-WT SK-DM SK-WT (mg) 0.88**b 1.00 SK-DM (mm) 0.84** 0.96** 1.00 SK-HI 0.18** –0.24** –0.19** a SK-WT = single kernel weight; SK-DM = single kernel diameter. b * and ** = Correlation coefficients significant at P < 0.05 and 0.01, respectively. TABLE V Linear Correlation Coefficients (n = 280) Between Standard Quality Tests and Single Kernel Parametersa Single Kernel Parameters Characteristic Peak Force SK-WT (mg) SK-DM (mm) HW (kg/hL) nsb 0.20** 0.27** SY% 0.54** 0.37** 0.36** DDT (min) –0.28** –0.31** –0.26** B10 (BU) 0.35** 0.38** 0.34** FWA (%) 0.50** 0.43** 0.38** a HW = hectoliter weight; SK-WT = single kernel weight; SK-DM = single kernel diameter; DDT = farinograph dough development time; B10 = breakdown after 10 min; FWA = farinograph water absorption, 11% moisture basis; SY% = semolina mill yield percentage. b ** = significant at P < 0.01; ns = not significant.
  • 6. Vol. 77, No. 1, 2000 9 parameters (SK-PF, SK-WT, SK-DM, SK-HI, and SK-MC). The means and ranges of these physical and chemical characteristics are summarized in Table III. It should be noted that the very low hardness values found for some samples were from species other than T. turgidum. The presence of the 32 diverse tetraploid species in the 280 samples extended the range in all parameters measured over that obtained from the breeding population. The SD values of SKCS parameters were calculated by the instrument software for each sample, and this gave an indication of the variation in the sample. Simple linear correlation coefficients among the SKCS parameters (Table IV) show that peak force had a significant positive correlation with SK-WT (r2 = 0.77), SK-DM (r2 = 0.71), because larger kernels require a greater force to crush, but a low correlation with SK-HI (r2 = 0.03). The weight and size of the kernels were highly correlated, as would be expected. SK-HI was only weakly negatively correlated with SK-WT and SK-DM, and although the correlations were significant, grain size or weight explains very little of the variation in grain hardness. The corre-lations were improved by removing data for the tetraploid set (SK-HI vs. SK-WT, r2 = 0.20 and SK-HI vs. SK-DM, r2 = 0.19) but they were still very low. In hexaploid wheats, smaller kernels have been reported to be softer (Gaines et al 1996). The simple linear correlation coefficients among wheat and semolina properties are shown in Table V. Although HLW was correlated with grain weight (SK-WT) and diameter (SK-DM), the r2 values were very small. These results are in contrast to a study relating SKCS parameters to hard winter wheats (Ohm et al 1998). Also in a recent report (Troccoli and di Fonzo 1999), the test weight of 16 durum cultivars was not correlated with the mean individual kernel weights and kernel width. Grain protein was not correlated with any of the SKCS parameters, and SK-HI was only weakly correlated with SY%. Significant correlations were obtained between peak force, SK-WT and SK-DM, and the three farinograph parameters, but again the r2 values were only 0.25–0.07. Semolina mill yield was posi-tively correlated with peak force, SK-WT, SK-DM, and SK-HI. Peak force gave the highest correlation coefficient with SY% but still explains <30% of the variation in SY%. A similar observation was found in a study of 12 hard winter wheats grown at six locations in Kansas (Ohm et al 1998). Employing a multiple linear regression model to predict SY% from peak force, SK-WT, SK-DM, and SK-HI, a significant but low correlation (r2 = 0.08) was obtained that would not have practical use in predicting SY%. The results show that the SKCS durum parameters are related to conventional quality characteristics, but because of the low r2 values, they would not be adequate for prediction purposes. Selection for a smaller range (lower SD) or uniformity for grain size, weight, and hardness could be useful when breeding for grain with more uniformity. This may improve the consistency of quality across different growing environments. Prediction of Semolina Milling Yield There is potential to develop a calibration for predicting SY% using the SKCS because a calibration to predict flour yield has already been reported (Osborne et al 1997). A calibration set (Set 5) of 584 durum breeding lines, for which SY% data were available, was used. The four parameters that define the crush force profile (area, peak force, Gompertz function A, Gompertz function B), together with the kernel weight, were applied to a multiple linear regression equation. Given the large number of calibration samples, all five terms were included in the regression. The fitted versus actual yield had a significant but low correlation (r2 = 0.25) with a residual standard deviation (RSD) of 1.5%. Figure 6 shows the corresponding scatter plot that exhibits a considerable amount of scatter about the fitted line. The repeata-bility of Buhler test milling (RSD 0.59%) when measuring SY% is better than the prediction model. The 99% confidence range for Buhler semolina milling is 1.77, and the range typically found for milling durum in the Tamworth breeding program is 66.4–71.9%. Therefore, the error in the milling method represents about one third of the total variation in actual yields. The criteria for the usefulness of the SKCS SY% prediction in a breeding program depends on the percentage of incorrectly discarded or retained samples. Examination of the scatter diagram indicates that the application of a conservative cut-off value of 67.0% for SY% using the SKCS fitted yield data would have resulted in a total of 33 lines being discarded, of which 13 had actual yields >67% and would therefore have been incorrectly discarded. Conversely, 551 lines would be accepted and of these, 61 would have actual yields of <67% (11% poor yield lines accepted). The objective in breeding for improved grain quality is to move the population mean in the required direction, higher in the case of SY%. Despite the poor predictive ability, the SKCS method appears to have the potential to achieve this. One of the main difficulties in predicting SY% in a breeding program at the early generation stage is the effect of environment on mill extraction. A cultivar or breeding line can display a wide range in mill yield across environments (Fig. 7). Some lines displayed a narrow range in SY% but others had quite a wide range, and on the basis of a causal relationship, they seemed to be related to the range in grain weight in these lines (30–57 mg in some cases). Because there is a positive correlation between SK-WT and SY% (Table V), this would account for some of the variation observed. Therefore, even if a line were tested by the SKCS 4100 at an early generation and predicted to have a low yield, that line progressing through the various generations could display a wide range in mill performance reflected in between-site and seasonal variation. Some lines may have a narrow range in SY% across environments, so these would be easier to predict. Attempts were made to obtain a prediction of SY% of advanced generation lines by analyzing the F3 seed from which these lines were derived. Although there was a significant correlation between predicted SY% on F3 lines and the Buhler SY% averaged across sites for F3-derived advanced lines (r2 = 0.18, P < 0.01), the utility of that prediction is questionable. For example, if all lines below a SY% of 68 were rejected, many lines that performed above this SY% at some sites would also have been rejected. This is because some advanced lines varied considerably in their SY% across environments (by as much as 7.5% in one case) (Fig. 7). The environmental effect on SY% makes prediction in early generations uncertain. Further research will be conducted in an attempt to improve the value of the SKCS 4100 in the prediction of SY% for early generation screening. Fig. 7. Plot of single-kernel characterization system (SKCS) predicted semolina mill yield (SY%) by analysis of F3 parents against actual labor-atory milled % semolina yield of advanced lines grown at various sites.
  • 7. CONCLUSIONS The application of the SKCS 4100 to the analysis of durum wheat in a breeding program has been studied. The instrument provides accurate and reliable data after adjustment of the factory-installed common wheat calibrations and replaces the more time-consuming 1,000 kernel weight and pearlograph hardness measurements previously used in the program. The SKCS 4100 generates infor-mation on sample uniformity that has yet to find use in a breeding program. The raw SKCS data can be used to develop a calibration for semolina mill yield, which could be useful for breeders to move the population mean to a higher semolina mill yield by screening out a proportion of the poorer lines. A calibration for durum vitreous-ness provides a more rapid and objective method than the visual inspection method. ACKNOWLEDGMENTS We thank the Quality Wheat CRC Ltd. and the Grains Research and Development Corporation (Project BRI 66) for investing in this research. We also thank the Prime Wheat Division of GrainCorp, Narrabri, for provision of mottled durum samples, the technical expertise of Narelle Egan and Sue Balfe for durum quality analyses and to J. Ronalds and J. Oliver for critically reviewing the manuscript. LITERATURE CITED American Association of Cereal Chemists. 1995. Approved Methods of the AACC, 9th ed. Method 26-41, Method 39-10, Method 39-70A, Method 44-15A, Method 54-21, The Association: St. Paul, MN. Chesterfield, R. S. 1971. A modified barley pearler for measuring hardness of Australian wheat. J. Aust. Inst. Agric. Sci. 37:148-151. Chung, C. J., Clark, S. J., Lindholm, J. C., McGinty, R. J., and Watson, C. A. 1975. The pearlograph technique for measuring wheat hardness. Trans. ASAE 18:185-189, 193. Dexter, J. E., and Matsuo, R. R. 1981. Effect of starchy kernels, imma-turity and shrunken kernels on durum wheat quality. Cereal Chem. 58:395-400. Dexter, J. E., Williams, P. C., Edwards, N. M., and Martin, D. G. 1988. 10 CEREAL CHEMISTRY The relationships between durum wheat vitreousness, kernel hardness and processing quality. J. Cereal Sci. 7:169-181. Dexter, J. E., Marchylo, B. A., MacGregor, A. W., and Tkachuk, R. 1989. The structure and protein composition of vitreous, piebald and starchy durum wheat kernels. J. Cereal Sci. 10:19-32. Fearn, T 1998. Which way round? Classical and inverse calibration. NIR News 9(4):9. Gaines, C. S., Finney, P. F., Fleege, L. M., and Andrews, L. C. 1996. Predicting a hardness measurement using the single-kernel charac-terization system. Cereal Chem. 73:278-283. ICC. 1995. Standard Methods of the ICC: Standard No. 129. Method for the determination of the vitreousness of durum wheat. ICC: Vienna. Kuhlman, D. K., Chung, D. S., McGinty, R., and Watson, C. A. 1979. Modi-fication of the pearler for wheat-hardness tests. Trans. ASAE 22:881-885. Martin, C. R., Rousser, R., and Brabec, D. L. 1993. Development of a single-kernel wheat characterization system. Trans. ASAE 36:1399-1404. Matsuo, R. R., and Dexter, J. E. 1980. Relationship between some durum wheat physical characteristics and semolina milling properties. Can. J. Plant Sci. 60:49-53. Ohm, J. B., Chung, O. K., and Deyoe, C. W. 1998. Single-kernel char-acteristics of hard winter wheats in relation to milling and baking quality. Cereal Chem. 75:156-161. Osborne, B. G., Kotwal, Z., Blakeney, A. B., O’Brien, L., Shah, S., and Fearn, T. 1997. Application of the single-kernel characterization system to wheat receival testing and quality prediction. Cereal Chem. 74:467-470. Pearson, J. G., and Wedd, S. 1978. Technical Report 78/4. Ag. Engi-neering Centre, Dept of Agriculture NSW: Glenfield, NSW. Satumbaga, R., Martin, C., Eustace, D., and Deyoe, C. W., 1995. Rela-tionship of physical and milling properties of hard red winter wheat using the single kernel wheat characterization system. Assoc. Operative Tech. Bull. January 6487-6496. Sissons, M. J., Batey, I. L., Hare, R. A., and Egan, N. 1998. Tetraploid wheat—A potentially useful resource for the genetic improvement of durum wheat. Pages 145-149 in: Cereals 98. Proc. 48th Australian Cereal Chemistry Conf. RACI: North Melbourne, Australia. Troccoli, A., and di Fonzo, N. 1999. Relationship between kernel size features and test weight in Triticum durum. Cereal Chem. 76:45-49. Williams, P. C., Sobering. D., Knight, J., and Psotka, J. 1998. Application of the Perten SKCS-4100 single kernel characterization system to predict kernel texture on the basis of particle size index. Cereal Foods World 43:550. [Received April 20, 1999. Accepted September 21, 1999.]