How to Invest in Municipalities to Increase Recycling in the US: the Case of the Closed Loop Fund
•
0 likes•79 views

09.15 10.15 - 1 - bridget croke with panel - slides - how to invest

Recommended
Recommended
More Related Content
Viewers also liked
Viewers also liked (13)
More from Sustainable Brands
More from Sustainable Brands (20)
Recently uploaded
Recently uploaded (20)
How to Invest in Municipalities to Increase Recycling in the US: the Case of the Closed Loop Fund
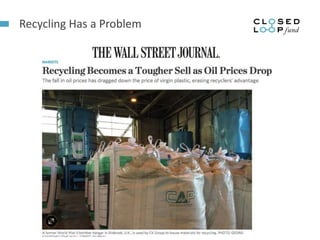
- 1. Recycling Has a Problem
- 2. The Real Problem 3 Year Market Average % Weight $ Value Glass 18.0% ($50) Cardboard 27.0% $125 Paper 32.0% $85 Aluminum 2.0% $1,400 PET 4.0% $375 HDPE 4.0% $525 Plastic Film/Flexible (1) 1.5% ($50) Rigid Plastics (1) 1.5% $50 Other 10.0% ($50) Revenue/Ton 100.0% $111 (-) Operating Cost/Ton ($75) Profit/Ton $36 The Economics of Material Recovery Facilities
- 3. CLOSED LOOP FUND | PAGE 3 TOTAL: $11,402,020,357 Source: See Appendix 1 for methodology and plastic material definitions. STEEL: $285,000,000 PET: $2,917,345,309 PVC: $136,000,000 PP: $1,273,600,000 GLASS: $97,325,060 ALUMINUM: $1,446,228,571 HDPE: $2,854,896,000 LDPE/LLDPE: $726,000,000 PS: $371,000,000 PAPER: $1,294,625,417 End Markets Exist
- 4. Investing in Recycling Infrastructure
- 5. TOWARD A RECYCLE K-Cup® pod 3-part strategy
- 6. 6
Editor's Notes
- You may have heard about this story in the WSJ. In the news – this is the problem
- This is the real problem
- How can you as a company get the internal YES on scaled initiatives like this? Example: Why did P&G, Pepsico Why? Walmart effect Sometimes it needs to be big enough Focus Clear financial return
- Purpose: Support Keurig in meeting its goal of 100% recyclability for K-Cups in 2020 Scope: Conduct testing in 3 Materials Recovery Facilities (MRFs) to learn how various cups/formats would flow in current MRF sorting equipment Desired Outcomes: Inform design, material selection, marketing, labeling, and other decisions that influence recyclability Identify points of inquiry and possible intervention in the recycling industry that could enable K-Cup recycling