
![[예정 매입 금액] 임의 작성
알기컨 >
tacac.co.kr
공지사항
-0% 14%
-31%
-6%
18%
-10% -16%
52%
20%
-261%
-3% 6%
22%
-5%
-46%
-300%
-250%
-200%
-150%
-100%
-50%
0%
50%
100%
2019.09.26 2019.10.28 2019.11.25 2019.12.23 2020.01.23
주가 상승 확률 증가율
A 섹터
B 섹터
최종평균
49점 49점
57점
43점 41점
50점
27점 24점
21점
43점
54점
15점
38점 37점 39점
50점 48점
33점
0점
10점
20점
30점
40점
50점
60점
2019.08.27 2019.09.26 2019.10.28 2019.11.25 2019.12.23 2020.01.23
주가 상승 확률 점수
A 섹터
B 섹터
최종평균
중앙백신
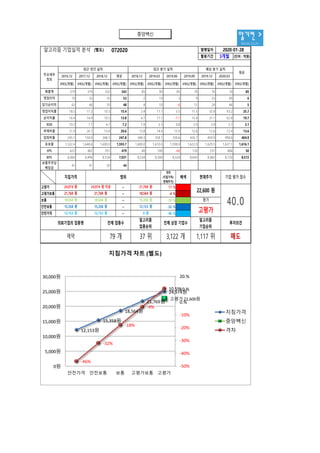
알고리즘 주식매매 전략서 (별도) 072020 발행일자
활용기간
격차
(지침가격/
현재주가)
배색
240,895 원 20 주안전가격 12,153 원 12,153 원 ~ 0 원 -46 %
안전보통 15,358 원 15,358 원 ~ 12,153 원 -32 % 166,984 원 11 주
보통 18,564 원 18,564 원 ~ 15,358 원 -18 % 93,073 원 5 주
21,769 원 11 % -54,748 원 -2 주
고평가보통 21,769 원 21,769 원 ~ 18,564 원 -4 % 19,163 원 1 주
22,600 원 고평가
현재주가 평가 주가 상승 확률 점수 투자의견 예정 매입 금액
47.5 매도 2,500,000 원
추천 매입 금액 521,128 원 추천 매입 주식수 23 주
지침가격 범위 매수 / 매도 매수 / 매도 주식수
고평가 24,974 원 24,974 원 이상 ~
2020-01-28
3개월
주가 상승 확률 점수
A 섹터 48.9 점 48.9 점 56.9 점 43.3 점 40.9 점
B 섹터 26.7 점 24.2 점 43.3 점 43.3 점 54.2 점 15.0 점
2019.08.27 2019.09.26 2019.10.28 2019.11.25 2019.12.23 2020.01.23
50.2 점
47.5
최종 평균 37.8 점 36.5 점 38.8 점 50.0 점 47.6 점 32.6 점
최종 증가율2020.01.232019.12.232019.11.252019.10.282019.09.26
-10 %B 섹터
44.7-5 %
18 %-6 %-31 %14 %-0 %A 섹터
최종 평균 -3 % 6 % 22 % -5 % -46 %
-16 % 52 % 20 % -261 %
최종 점수](data:image/gif;base64,R0lGODlhAQABAIAAAAAAAP///yH5BAEAAAAALAAAAAABAAEAAAIBRAA7)
More Related Content
What's hot
What's hot (20)
Similar to 중앙백신 072020 알고리즘 기업분석 보고서
Similar to 중앙백신 072020 알고리즘 기업분석 보고서 (20)
More from 알고리즘 기업분석 컨설팅-알기컨,algikeon
More from 알고리즘 기업분석 컨설팅-알기컨,algikeon (20)
중앙백신 072020 알고리즘 기업분석 보고서
- 1. 알기컨 > tacac.co.kr 중앙백신 (별도) 072020 발행일자 활용기간 3개월 (단위 : 억원) 2016.12 2017.12 2018.12 평균 2018.12 2019.03 2019.06 2019.09 2019.12 2020.03 IFRS(개별) IFRS(개별) IFRS(개별) IFRS(개별) IFRS(개별) IFRS(개별) IFRS(개별) IFRS(개별) IFRS(개별) IFRS(개별) IFRS(개별) 매출액 379 319 332 343 85 90 85 78 76 74 85 영업이익 70 55 35 53 2 10 3 9 25 69 6 당기순이익 62 46 35 48 4 10 -6 12 24 46 5 영업이익률 18.5 17.2 10.5 15.4 2.4 11.1 3.5 11.5 32.8 93.2 25.7 순이익률 16.4 14.4 10.5 13.8 4.7 11.1 -7.1 15.4 31.1 62.8 19.7 ROE 10.3 7.1 4.1 7.2 1.9 3.3 0.8 2.9 3.9 5.7 3.1 부채비율 21.9 26.1 13.8 20.6 13.8 14.4 15.9 12.8 12.6 12.4 13.6 당좌비율 245.1 150.0 348.3 247.8 348.3 358.1 338.6 426.7 459.9 498.0 404.9 유보율 1,532.4 1,648.6 1,600.0 1,593.7 1,600.0 1,610.0 1,598.0 1,622.0 1,629.5 1,637.1 1,616.1 EPS 622 462 351 479 40 100 -60 120 237 466 50 BPS 6,064 6,496 8,534 7,031 8,534 8,584 8,524 8,645 8,682 8,720 8,572 보통주주당 배당금 41 41 50 44 최근 분기 실적 예상 분기 실적최근 연간 실적 평균 주요재무 정보 알고리즘 기업실적 분석 2020-01-28 12,153원 15,358원 18,564원 21,769원 24,974원 고평가 22,600원 -46% -32% -18% -4% 10.5% -50% -40% -30% -20% -10% 0.% 10.% 20.% 0원 5,000원 10,000원 15,000원 20,000원 25,000원 30,000원 안전가격 안전보통 보통 고평가보통 고평가 지침가격 차트 (별도) 지침가격 중앙백신 격차 격차 (지침가격/ 현재주가) 배색 고평가 ~ 11 % 고평가보통 ~ -4 % 보통 ~ -18 % 안전보통 ~ -32 % 안전가격 ~ -46 % 18,564 원 지침가격 24,974 원 21,769 원 범위 24,974 원 이상 21,769 원 21,769 원 현재주가 22,600 원 12,153 원 0 원 18,564 원 15,358 원 18,564 원 15,358 원 고평가 15,358 원 12,153 원 평가 매도제약 79 개 37 위 3,122 개 1,117 위 의뢰기업의 업종명 전체 업종수 알고리즘 업종순위 전체 상장 기업수 알고리즘 기업순위 투자의견 기업 평가 점수 40.0 12,153 원
- 2. [예정 매입 금액] 임의 작성 알기컨 > tacac.co.kr 공지사항 -0% 14% -31% -6% 18% -10% -16% 52% 20% -261% -3% 6% 22% -5% -46% -300% -250% -200% -150% -100% -50% 0% 50% 100% 2019.09.26 2019.10.28 2019.11.25 2019.12.23 2020.01.23 주가 상승 확률 증가율 A 섹터 B 섹터 최종평균 49점 49점 57점 43점 41점 50점 27점 24점 21점 43점 54점 15점 38점 37점 39점 50점 48점 33점 0점 10점 20점 30점 40점 50점 60점 2019.08.27 2019.09.26 2019.10.28 2019.11.25 2019.12.23 2020.01.23 주가 상승 확률 점수 A 섹터 B 섹터 최종평균 중앙백신 알고리즘 주식매매 전략서 (별도) 072020 발행일자 활용기간 격차 (지침가격/ 현재주가) 배색 240,895 원 20 주안전가격 12,153 원 12,153 원 ~ 0 원 -46 % 안전보통 15,358 원 15,358 원 ~ 12,153 원 -32 % 166,984 원 11 주 보통 18,564 원 18,564 원 ~ 15,358 원 -18 % 93,073 원 5 주 21,769 원 11 % -54,748 원 -2 주 고평가보통 21,769 원 21,769 원 ~ 18,564 원 -4 % 19,163 원 1 주 22,600 원 고평가 현재주가 평가 주가 상승 확률 점수 투자의견 예정 매입 금액 47.5 매도 2,500,000 원 추천 매입 금액 521,128 원 추천 매입 주식수 23 주 지침가격 범위 매수 / 매도 매수 / 매도 주식수 고평가 24,974 원 24,974 원 이상 ~ 2020-01-28 3개월 주가 상승 확률 점수 A 섹터 48.9 점 48.9 점 56.9 점 43.3 점 40.9 점 B 섹터 26.7 점 24.2 점 43.3 점 43.3 점 54.2 점 15.0 점 2019.08.27 2019.09.26 2019.10.28 2019.11.25 2019.12.23 2020.01.23 50.2 점 47.5 최종 평균 37.8 점 36.5 점 38.8 점 50.0 점 47.6 점 32.6 점 최종 증가율2020.01.232019.12.232019.11.252019.10.282019.09.26 -10 %B 섹터 44.7-5 % 18 %-6 %-31 %14 %-0 %A 섹터 최종 평균 -3 % 6 % 22 % -5 % -46 % -16 % 52 % 20 % -261 % 최종 점수
- 3. 알기컨 > tacac.co.kr공지사항 (compliance notice) ① 알고리즘 기업분석 컨설팅에서 제공하는 정보는 신뢰할 만한 자료 및 정보 와 알고리즘 기업분석 프로그램(TACAP)을 통해 얻어진 것이나 그 정확성이나 완전성을 보장 할 수 없으며, 시간이 경과함에 따라 변경될 수 있습니다. 따라 서 정보의 오류,누락에 대하여 알고리즘 기업분석 컨설팅에서 제공하는 자료 의 대한 결과에 대해 법적인 책임을 지지 않습니다. ② 알고리즘 기업분석 컨설팅 및 본 사이트에서 제공하는 모든 정보는 투자판 단의 참고자료이며, 투자의 최종 책임은 본 정보를 이용하시는 이용자에게 있 습니다. ③ 알고리즘 기업분석 컨설팅 및 본 사이트에서는 일임매매 등 관련법규에 위 배되는 행위는 일체 하지 않습니다. ④ 이용자는 알고리즘 기업분석 컨설팅 및 본 사이트에서 제공한 정보를 무단 으로 재배포 및 재활용 할 수 없습니다. ⑤ 알고리즘 기업분석 보고서의 정확성을 높이기 위해 활용기간을 필히 숙지 하시길 바랍니다. ① Consulting is ob The Algorithm C accuracy or com may change ove for the results o Analysis Consul ② information prov investment decis up ③ do anything tha transaction. ④ by information prov ⑤ analysis report i Tel : 070 - 4667 - 5009 Email : tacac@tacac.co.kr Homepage : tacac.co.kr Blog : tacac.blog.me SERVICES M&A,IPO,리커버,구조조정,기술경영,경영전략,가족기업 컨설팅신청 : http://tacac.co.kr/?page_id=1374