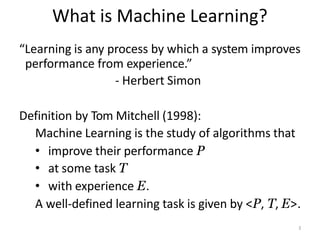
What is MachineLearning?
“Learning is any process by which a system improves
performance from experience.”
- Herbert Simon
Definition by Tom Mitchell (1998):
Machine Learning is the study of algorithms that
• improve their performance P
• at some task T
• with experience E.
A well-defined learning task is given by <P, T, E>.
3
7
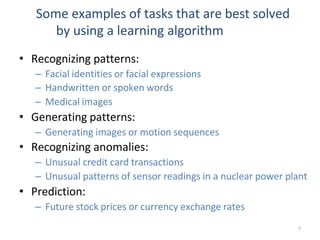
Some examples oftasks that are best solved
by using a learning algorithm
• Recognizing patterns:
– Facial identities or facial expressions
– Handwritten or spoken words
– Medical images
• Generating patterns:
– Generating images or motion sequences
• Recognizing anomalies:
– Unusual credit card transactions
– Unusual patterns of sensor readings in a nuclear power plant
• Prediction:
– Future stock prices or currency exchange rates
9.
State of theArt Applications of
Machine Learning
11
10.
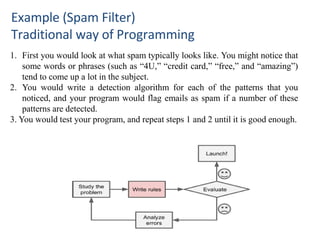
Example (Spam Filter)
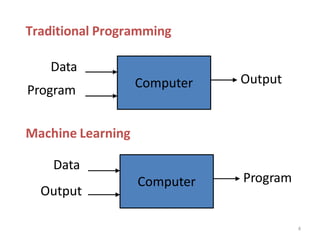
Traditionalway of Programming
1. First you would look at what spam typically looks like. You might notice that
some words or phrases (such as “4U,” “credit card,” “free,” and “amazing”)
tend to come up a lot in the subject.
2. You would write a detection algorithm for each of the patterns that you
noticed, and your program would flag emails as spam if a number of these
patterns are detected.
3. You would test your program, and repeat steps 1 and 2 until it is good enough.
11.
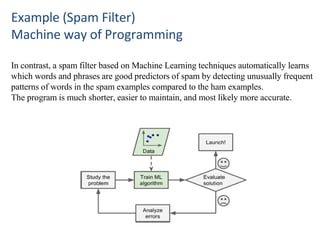
Example (Spam Filter)
Machineway of Programming
In contrast, a spam filter based on Machine Learning techniques automatically learns
which words and phrases are good predictors of spam by detecting unusually frequent
patterns of words in the spam examples compared to the ham examples.
The program is much shorter, easier to maintain, and most likely more accurate.
12.
Example (Spam Filter)
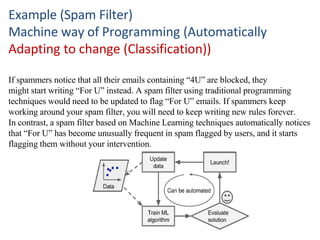
Machineway of Programming (Automatically
Adapting to change (Classification))
If spammers notice that all their emails containing “4U” are blocked, they
might start writing “For U” instead. A spam filter using traditional programming
techniques would need to be updated to flag “For U” emails. If spammers keep
working around your spam filter, you will need to keep writing new rules forever.
In contrast, a spam filter based on Machine Learning techniques automatically notices
that “For U” has become unusually frequent in spam flagged by users, and it starts
flagging them without your intervention.
13.
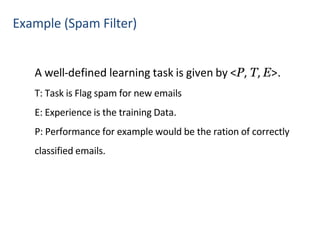
Example (Spam Filter)
Awell-defined learning task is given by <P, T, E>.
T: Task is Flag spam for new emails
E: Experience is the training Data.
P: Performance for example would be the ration of correctly
classified emails.
14.
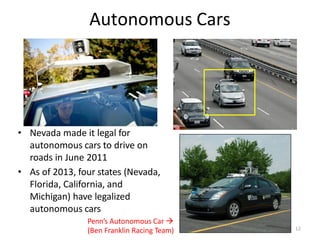
Autonomous Cars
• Nevadamade it legal for
autonomous cars to drive on
roads in June 2011
• As of 2013, four states (Nevada,
Florida, California, and
Michigan) have legalized
autonomous cars
Penn’s Autonomous Car
(Ben Franklin Racing Team) 12
Machine Learning in
AutomaticSpeech Recognition
A Typical Speech Recognition System
ML used to predict of phone states from the sound spectrogram
Deep learning has state-of-the-art results
# Hidden Layers 1 2 4 8 10 12
Word Error Rate % 16.0 12.8 11.4 10.9 11.0 11.1
Baseline GMM performance = 15.4%
[Zeiler et al. “On rectified linear units for speech
recognition” ICASSP 2013]
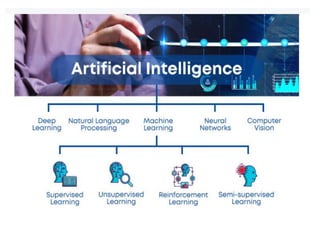
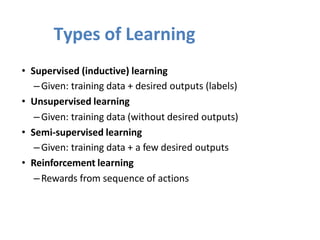
Types of Learning
•Supervised (inductive) learning
–Given: training data + desired outputs (labels)
• Unsupervised learning
–Given: training data (without desired outputs)
• Semi-supervised learning
–Given: training data + a few desired outputs
• Reinforcement learning
–Rewards from sequence of actions
19.
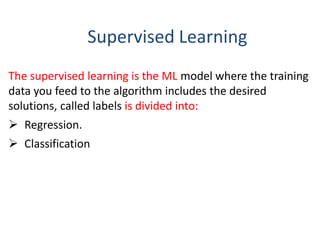
Supervised Learning
The supervisedlearning is the ML model where the training
data you feed to the algorithm includes the desired
solutions, called labels is divided into:
Regression.
Classification
20.
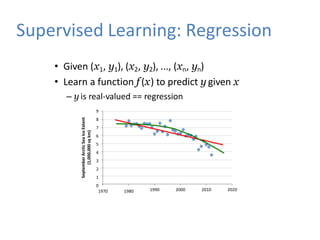
Supervised Learning: Regression
•Given (x1, y1), (x2, y2), ..., (xn, yn)
• Learn a function f (x) to predict y given x
– y is real-valued == regression
9
8
7
6
5
4
3
2
1
0
1970 1980 1990 2000 2010 2020
September
Arctic
Sea
Ice
Extent
(1,000,000
sq
km)
21.
Supervised Learning
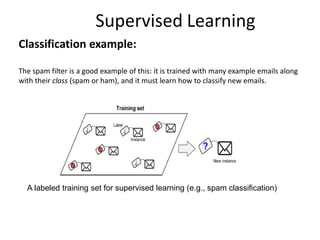
Classification example:
Thespam filter is a good example of this: it is trained with many example emails along
with their class (spam or ham), and it must learn how to classify new emails.
A labeled training set for supervised learning (e.g., spam classification)
22.
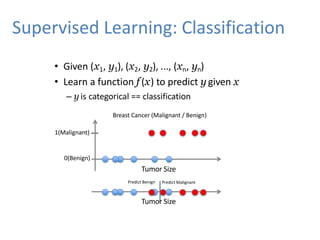
Supervised Learning: Classification
•Given (x1, y1), (x2, y2), ..., (xn, yn)
• Learn a function f (x) to predict y given x
– y is categorical == classification
Breast Cancer (Malignant / Benign)
1(Malignant)
0(Benign)
Tumor Size
Predict Benign Predict Malignant
Tumor Size
23.
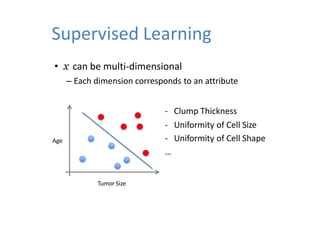
Supervised Learning
Tumor Size
Age
-Clump Thickness
- Uniformity of Cell Size
- Uniformity of Cell Shape
…
• x can be multi-dimensional
– Each dimension corresponds to an attribute
24.
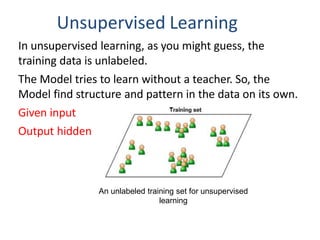
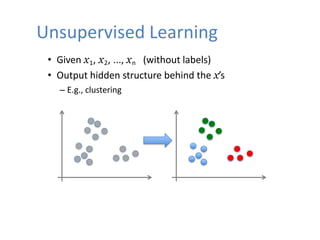
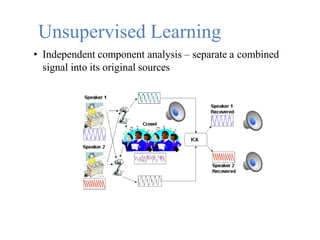
Unsupervised Learning
In unsupervisedlearning, as you might guess, the
training data is unlabeled.
The Model tries to learn without a teacher. So, the
Model find structure and pattern in the data on its own.
Given input
Output hidden
An unlabeled training set for unsupervised
learning
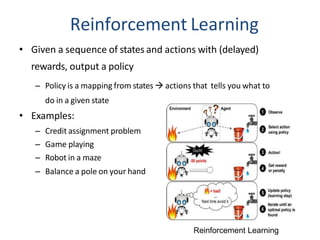
Reinforcement Learning
• Givena sequence of states and actions with (delayed)
rewards, output a policy
– Policy is a mapping from states actions that tells you what to
do in a given state
• Examples:
– Credit assignment problem
– Game playing
– Robot in a maze
– Balance a pole on your hand
Reinforcement Learning
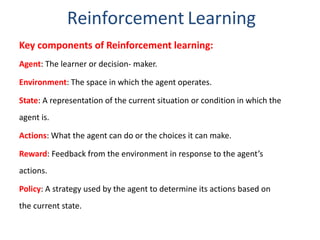
28.
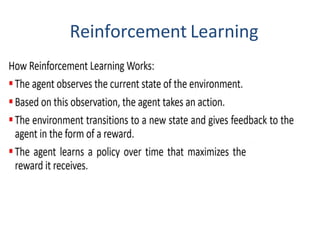
Reinforcement Learning
Key componentsof Reinforcement learning:
Agent: The learner or decision- maker.
Environment: The space in which the agent operates.
State: A representation of the current situation or condition in which the
agent is.
Actions: What the agent can do or the choices it can make.
Reward: Feedback from the environment in response to the agent’s
actions.
Policy: A strategy used by the agent to determine its actions based on
the current state.
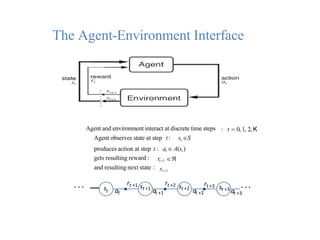
The Agent-Environment Interface
Agentand environment interact at discrete time steps
Agent observes state at step t: st S
: t 0, 1, 2, K
produces action at step t : at A(st )
gets resulting reward :
and resulting next state :
rt1
st1
. . . st at
rt +1 st +1
at +1
rt +2 st +2
at +2
rt +3 st +3
. . .
at +3
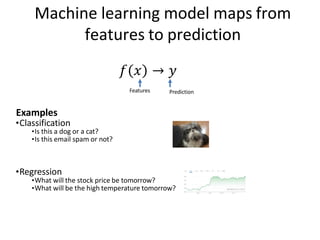
Machine learning modelmaps from
features to prediction
Examples
•Classification
•Is this a dog or a cat?
•Is this email spam or not?
•Regression
•What will the stock price be tomorrow?
•What will be the high temperature tomorrow?
𝑓 𝑥
Features
→ 𝑦
Prediction
33.
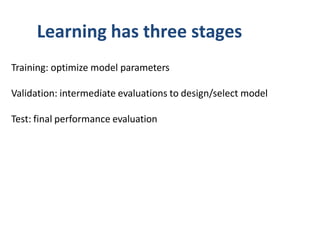
Learning has threestages
Training: optimize model parameters
Validation: intermediate evaluations to design/select model
Test: final performance evaluation
34.
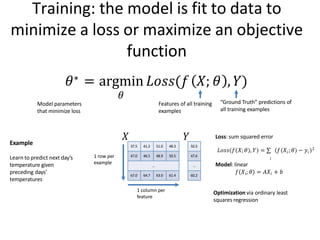
Training: the modelis fit to data to
minimize a loss or maximize an objective
function
𝜃∗ = argmin 𝐿𝑜𝑠𝑠(𝑓 𝑋; 𝜃 , 𝑌)
𝜃
Model parameters
that minimize loss
Features of all training
examples
“Ground Truth” predictions of
all training examples
37.5 41.2 51.0 48.3 50.5
47.0 46.5 48.9 50.5 47.6
… …
67.0 64.7 63.0 61.4 60.2
𝑋 𝑌
1 row per
example
1 column per
feature
Example
Learn to predict next day’s
temperature given
preceding days’
temperatures
𝑖
𝑖
𝐿𝑜𝑠𝑠 𝑓 𝑋;𝜃 , 𝑌 = ∑ 𝑓 𝑋 ;𝜃 − 𝑦𝑖
2
Model: linear
𝑓(𝑋𝑖; 𝜃) = 𝐴𝑋𝑖 + 𝑏
Optimization via ordinary least
squares regression
Loss: sum squared error
35.
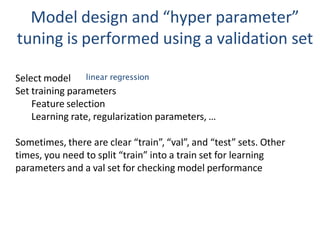
Model design and“hyper parameter”
tuning is performed using a validation set
Select model
Set training parameters
Feature selection
Learning rate, regularization parameters, …
Sometimes, there are clear “train”, “val”, and “test” sets. Other
times, you need to split “train” into a train set for learning
parameters and a val set for checking model performance
linear regression
36.
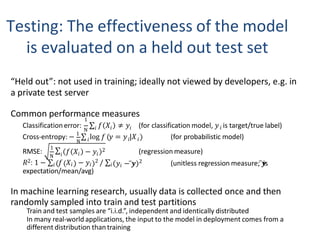
Testing: The effectivenessof the model
is evaluated on a held out test set
“Held out”: not used in training; ideally not viewed by developers, e.g. in
a private test server
Common performance measures
N 𝑖 𝑖 𝑖
1
Classificationerror: ∑ 𝑓 𝑋 ≠ 𝑦 (for classification model, 𝑦 is target/true label)
N 𝑖
Cross-entropy: − 1
∑ log 𝑓 𝑦 = 𝑦 |𝑋
𝑖 𝑖
𝑖
(for probabilistic model)
RMSE:
N
1
∑𝑖 𝑓 𝑋 − 𝑦
𝑖 𝑖
2 (regression measure)
𝑦𝑖 − 𝒚
̅
𝑅2: 1 − ∑𝑖 𝑓 𝑋𝑖 − 𝑦𝑖
2 / ∑𝑖
expectation/mean/avg)
2 (unitless regression measure; 𝒚
̅ is
In machine learning research, usually data is collected once and then
randomly sampled into train and test partitions
Train and test samples are “i.i.d.”, independent and identically distributed
In many real-world applications, the input to the model in deployment comes from a
different distribution than training
37.
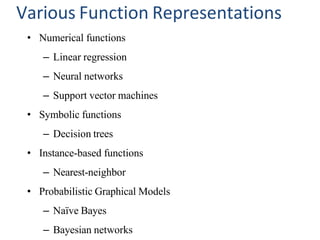
Various Function Representations
•Numerical functions
– Linear regression
– Neural networks
– Support vector machines
• Symbolic functions
– Decision trees
• Instance-based functions
– Nearest-neighbor
• Probabilistic Graphical Models
– Naïve Bayes
– Bayesian networks
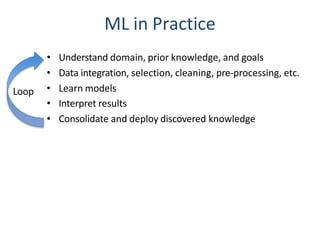
ML in Practice
•Understand domain, prior knowledge, and goals
• Data integration, selection, cleaning, pre-processing, etc.
• Learn models
• Interpret results
• Consolidate and deploy discovered knowledge
Loop
40.
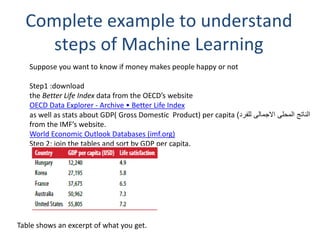
Complete example tounderstand
steps of Machine Learning
Suppose you want to know if money makes people happy or not
Step1 :download
the Better Life Index data from the OECD’s website
OECD Data Explorer - Archive • Better Life Index
as well as stats about GDP( Gross Domestic Product) per capita الناتج
للفرد االجمالى المحلى
)
from the IMF’s website.
World Economic Outlook Databases (imf.org)
Step 2: join the tables and sort by GDP per capita.
Table shows an excerpt of what you get.
41.
Complete example tounderstand
steps of Machine Learning
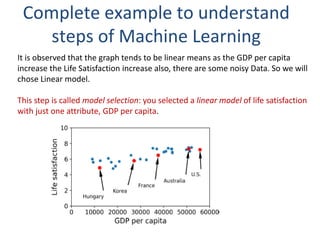
It is observed that the graph tends to be linear means as the GDP per capita
increase the Life Satisfaction increase also, there are some noisy Data. So we will
chose Linear model.
This step is called model selection: you selected a linear model of life satisfaction
with just one attribute, GDP per capita.
42.
Complete example tounderstand
steps of Machine Learning
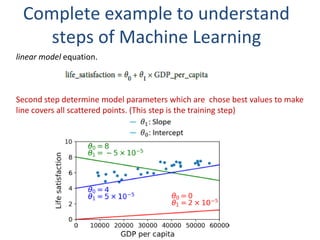
linear model equation.
Second step determine model parameters which are chose best values to make
line covers all scattered points. (This step is the training step)
43.
Complete example tounderstand
steps of Machine Learning
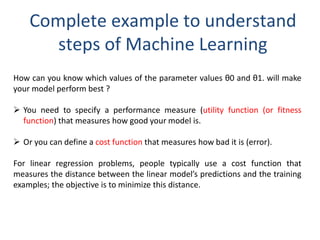
How can you know which values of the parameter values θ0 and θ1. will make
your model perform best ?
You need to specify a performance measure (utility function (or fitness
function) that measures how good your model is.
Or you can define a cost function that measures how bad it is (error).
For linear regression problems, people typically use a cost function that
measures the distance between the linear model’s predictions and the training
examples; the objective is to minimize this distance.
44.
Complete example tounderstand
steps of Machine Learning
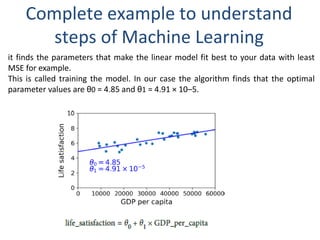
it finds the parameters that make the linear model fit best to your data with least
MSE for example.
This is called training the model. In our case the algorithm finds that the optimal
parameter values are θ0 = 4.85 and θ1 = 4.91 × 10⁻⁵.
45.
Complete example tounderstand
steps of Machine Learning
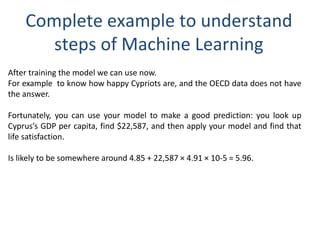
After training the model we can use now.
For example to know how happy Cypriots are, and the OECD data does not have
the answer.
Fortunately, you can use your model to make a good prediction: you look up
Cyprus’s GDP per capita, find $22,587, and then apply your model and find that
life satisfaction.
Is likely to be somewhere around 4.85 + 22,587 × 4.91 × 10-5 = 5.96.
46.
Complete example tounderstand
steps of Machine Learning
Python code that loads the data, prepares it, creates a scatterplot for visualization, and
then trains a linear model and makes a prediction.
import matplotlib.pyplot as plt
import numpy as np
import pandas as pd
import sklearn.linear_model
# Load the data
oecd_bli = pd.read_csv("oecd_bli_2015.csv", thousands=',')
gdp_per_capita = pd.read_csv("gdp_per_capita.csv",thousands=',',delimiter='t',
encoding='latin1', na_values="n/a")
# Prepare the data
country_stats = prepare_country_stats(oecd_bli, gdp_per_capita)
X = np.c_[country_stats["GDP per capita"]]
y = np.c_[country_stats["Life satisfaction"]]
# Visualize the data
country_stats.plot(kind='scatter', x="GDP per capita", y='Life satisfaction')
plt.show()
# Select a linear model
model = sklearn.linear_model.LinearRegression()
# Train the model
model.fit(X, y)
# Make a prediction for Cyprus
X_new = [[22587]] # Cyprus' GDP per capita
print(model.predict(X_new)) # outputs [[ 5.96242338]]
47.
Complete example tounderstand
steps of Machine Learning
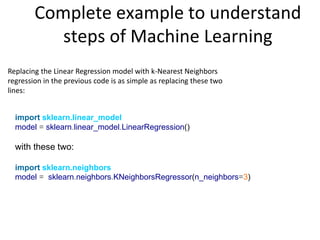
Replacing the Linear Regression model with k-Nearest Neighbors
regression in the previous code is as simple as replacing these two
lines:
import sklearn.linear_model
model = sklearn.linear_model.LinearRegression()
with these two:
import sklearn.neighbors
model = sklearn.neighbors.KNeighborsRegressor(n_neighbors=3)
48.
Complete example tounderstand
steps of Machine Learning
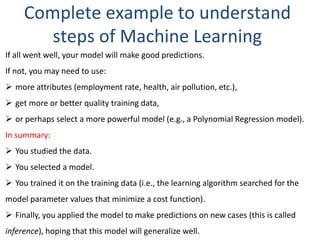
If all went well, your model will make good predictions.
If not, you may need to use:
more attributes (employment rate, health, air pollution, etc.),
get more or better quality training data,
or perhaps select a more powerful model (e.g., a Polynomial Regression model).
In summary:
You studied the data.
You selected a model.
You trained it on the training data (i.e., the learning algorithm searched for the
model parameter values that minimize a cost function).
Finally, you applied the model to make predictions on new cases (this is called
inference), hoping that this model will generalize well.
49.
Another Complete exampleto understand
steps of Machine Learning (Heart attack)
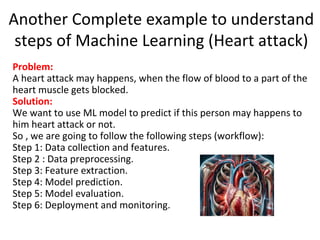
Problem:
A heart attack may happens, when the flow of blood to a part of the
heart muscle gets blocked.
Solution:
We want to use ML model to predict if this person may happens to
him heart attack or not.
So , we are going to follow the following steps (workflow):
Step 1: Data collection and features.
Step 2 : Data preprocessing.
Step 3: Feature extraction.
Step 4: Model prediction.
Step 5: Model evaluation.
Step 6: Deployment and monitoring.
50.
Another Complete exampleto
understand steps of Machine
Learning (Heart attack)
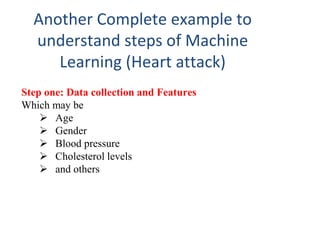
Step one: Data collection and Features
Which may be
Age
Gender
Blood pressure
Cholesterol levels
and others
51.
Another Complete exampleto
understand steps of Machine Learning
(Heart attack)
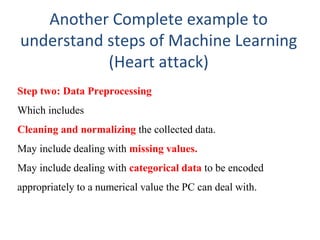
Step two: Data Preprocessing
Which includes
Cleaning and normalizing the collected data.
May include dealing with missing values.
May include dealing with categorical data to be encoded
appropriately to a numerical value the PC can deal with.
52.
Another Complete exampleto
understand steps of Machine Learning
(Heart attack)
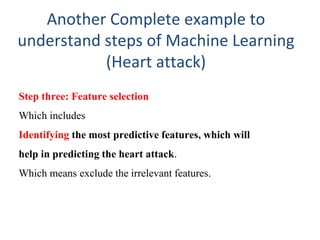
Step three: Feature selection
Which includes
Identifying the most predictive features, which will
help in predicting the heart attack.
Which means exclude the irrelevant features.
53.
Another Complete exampleto understand
steps of Machine Learning (Heart attack)
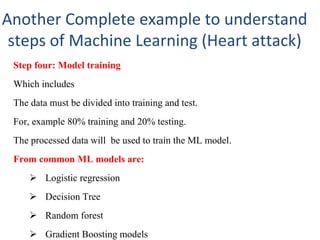
Step four: Model training
Which includes
The data must be divided into training and test.
For, example 80% training and 20% testing.
The processed data will be used to train the ML model.
From common ML models are:
Logistic regression
Decision Tree
Random forest
Gradient Boosting models
54.
Another Complete exampleto understand
steps of Machine Learning (Heart attack)
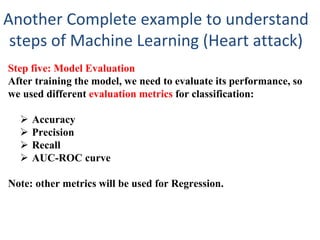
Step five: Model Evaluation
After training the model, we need to evaluate its performance, so
we used different evaluation metrics for classification:
Accuracy
Precision
Recall
AUC-ROC curve
Note: other metrics will be used for Regression.
55.
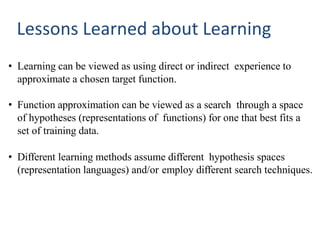
Lessons Learned aboutLearning
• Learning can be viewed as using direct or indirect experience to
approximate a chosen target function.
• Function approximation can be viewed as a search through a space
of hypotheses (representations of functions) for one that best fits a
set of training data.
• Different learning methods assume different hypothesis spaces
(representation languages) and/or employ different search techniques.
![Machine Learning in
Automatic Speech Recognition
A Typical Speech Recognition System
ML used to predict of phone states from the sound spectrogram
Deep learning has state-of-the-art results
# Hidden Layers 1 2 4 8 10 12
Word Error Rate % 16.0 12.8 11.4 10.9 11.0 11.1
Baseline GMM performance = 15.4%
[Zeiler et al. “On rectified linear units for speech
recognition” ICASSP 2013]](https://image.slidesharecdn.com/01introduction-1-251206184628-c027c13a/85/01_introduction_Machine-learning-course-pdf-16-320.jpg)
![Complete example to understand
steps of Machine Learning
Python code that loads the data, prepares it, creates a scatterplot for visualization, and
then trains a linear model and makes a prediction.
import matplotlib.pyplot as plt
import numpy as np
import pandas as pd
import sklearn.linear_model
# Load the data
oecd_bli = pd.read_csv("oecd_bli_2015.csv", thousands=',')
gdp_per_capita = pd.read_csv("gdp_per_capita.csv",thousands=',',delimiter='t',
encoding='latin1', na_values="n/a")
# Prepare the data
country_stats = prepare_country_stats(oecd_bli, gdp_per_capita)
X = np.c_[country_stats["GDP per capita"]]
y = np.c_[country_stats["Life satisfaction"]]
# Visualize the data
country_stats.plot(kind='scatter', x="GDP per capita", y='Life satisfaction')
plt.show()
# Select a linear model
model = sklearn.linear_model.LinearRegression()
# Train the model
model.fit(X, y)
# Make a prediction for Cyprus
X_new = [[22587]] # Cyprus' GDP per capita
print(model.predict(X_new)) # outputs [[ 5.96242338]]](https://image.slidesharecdn.com/01introduction-1-251206184628-c027c13a/85/01_introduction_Machine-learning-course-pdf-46-320.jpg)


![1_Introduction to Machine Learning [Autosaved].pptx](https://cdn.slidesharecdn.com/ss_thumbnails/1introductiontomachinelearningautosaved-250910004933-3913b711-thumbnail.jpg?width=640&height=640&fit=bounds)