More Related Content
Similar to Assignment 101
Similar to Assignment 101 (20)
Assignment 101
- 1. ASSIGNMENT - 101
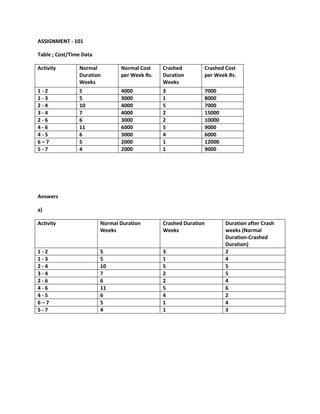
Table ; Cost/Time Data
Activity Normal
Duration
Weeks
Normal Cost
per Week Rs.
Crashed
Duration
Weeks
Crashed Cost
per Week Rs.
1 - 2 5 4000 3 7000
1 - 3 5 3000 1 8000
2 - 4 10 4000 5 7000
3 - 4 7 4000 2 15000
2 - 6 6 3000 2 10000
4 - 6 11 6000 5 9000
4 - 5 6 3000 4 6000
6 – 7 5 2000 1 12000
5 - 7 4 2000 1 9000
Answers
a)
Activity Normal Duration
Weeks
Crashed Duration
Weeks
Duration after Crash
weeks (Normal
Duration-Crashed
Duration)
1 - 2 5 3 2
1 - 3 5 1 4
2 - 4 10 5 5
3 - 4 7 2 5
2 - 6 6 2 4
4 - 6 11 5 6
4 - 5 6 4 2
6 – 7 5 1 4
5 - 7 4 1 3
- 2. Net work Diagram for crashed case scenarios
EF=2 ES=2 4 EF=6 ES=15 4 EF=19
LF=19
2 5 EF=7 6 ES=9 3
4 ES=4 2
ES=0 5 EF=9 ES=9 ES=11
Net work Diagram for normal case scenarios
ES=5 6 EF=11 ES=26 5 EF=31
LF=31
5 10 EF=15 11ES=15
4
5 ES=5 ES=15 6
ES=0 7 EF=12 ES=21
Answer ( b) crashed case scenarios
Activity Duration ES EF(ES+Du) LS(LF-Du) LF TF(LF-ES-D) FF
1 - 2 2 0 2 2 4 2 0
1 - 3 4 0 4 0 4 0 0
2 - 4 5 2 7 4 9 2 2
3 - 4 5 4 9 4 9 0 0
2 - 6 4 2 6 11 15 7 9
4 - 6 6 9 15 9 15 0 0
4 - 5 2 9 11 14 16 5 0
6 – 7 4 15 19 15 19 0 0
5 - 7 3 11 14 16 19 5 5
1
2
3
4
6
5
7
1
2
3
4
6
5
7
- 3. 2 Answer ( b) Normal case scenarios
Activity Duration ES EF(ES+Du) LS(LF-Du) LF TF(LF-ES-D) FF
1 - 2 5 0 5 0 5 0 0
1 - 3 5 0 5 3 8 3 0
2 - 4 10 5 15 5 15 0 0
3 - 4 7 4 11 8 15 4 3
2 - 6 6 5 11 20 26 15 15
4 - 6 11 15 26 15 26 0 0
4 - 5 6 15 21 21 27 6 0
6 – 7 5 26 31 26 31 0 0
5 - 7 4 21 25 10 31 6 6
Answer ( c)
Project Cost
crashed case scenarios
Activity Duration
Weeks
(After
crashed)
Normal
Cost per
Week Rs.
Normal
cost
Crashed
Duration
Weeks
Crashed
Cost per
Week Rs.
Crashed cost
1 - 2 2 4000 8000 3 7000 21000
1 - 3 4 3000 12000 1 8000 8000
2 - 4 5 4000 20000 5 7000 35000
3 - 4 5 4000 20000 2 15000 30000
2 - 6 4 3000 12000 2 10000 20000
4 - 6 6 6000 36000 5 9000 45000
4 - 5 2 3000 6000 4 6000 24000
6 – 7 4 2000 8000 1 12000 12000
5 - 7 3 2000 6000 1 9000 9000
Total 128,000.00 204,000.00
Total Project Cost = Normal cost +Crashed cost
= 128,000.00 + 204,000.00
= 332,000.00
- 4. Normal Case scenarios
Activity Normal
Duration
Weeks
Normal Cost
per Week Rs.
Normal cost
1 - 2 5 4000 20,000.00
1 - 3 5 3000 15,000.00
2 - 4 10 4000 40,000.00
3 - 4 7 4000 28,000.00
2 - 6 6 3000 18,000.00
4 - 6 11 6000 66,000.00
4 - 5 6 3000 18,000.00
6 – 7 5 2000 10,000.00
5 - 7 4 2000 8,000.00
Total =223,000.00
Total Project Cost = Normal cost
= 223,000.00
Answer d) Least cost scenario
By considering Net work Diagram for crashed case scenarios
EF=2 ES=2 4 EF=6 ES=15 4 EF=19
LF=19
2 5 EF=7 6 ES=9 3
4 ES=4 2
ES=0 5 EF=9 ES=9 ES=11
Critical Path
Without affecting critical path ,the activity 1 -2 can be done less crashed duration (1 week)
,the following activities can be done without crashed
Activity 2 -6 = 6 Weeks , 4 -5 =6 Weeks , 5 – 7 = 4 weeks
1
2
3
4
6
5
7
1 3 4 6 7
- 5. Least Cost Calculation
Activity Duration
Weeks
(After
crashed)
Normal
Cost per
Week Rs.
Normal
cost Rs
Crashed
Duration
Weeks
Crashed
Cost per
Week Rs.
Crashed cost Rs
1 - 2 4 4000 16000 1 7000 7000
1 - 3 4 3000 12000 1 8000 8000
2 - 4 5 4000 20000 5 7000 35000
3 - 4 5 4000 20000 2 15000 30000
2 - 6 6 3000 18000 - - -
4 - 6 6 6000 36000 5 9000 45000
4 - 5 6 3000 18000
6 – 7 4 2000 8000 1 12000 12000
5 - 7 4 2000 8000
Total = 156,000.00 137,000.00
Total Project Cost = Normal cost +Crashed cost
= 156,000.00 + 137,000.00
= 293,000.00
Method of Duration Total no of weeks Project Cost
Normal 31 223,000.00
Crashed 19 332,000.00
Normal + Crashed 19 293,000.00
By considering above option 3 is considered as least cost scenarios because It is within crashed
duration period less cost .
Total Project least Cost = 293,000.00
Answer e)
Activity Duration ES EF(ES+Du) LS(LF-Du) LF TF(LF-ES-D) FF
1 - 2 4 0 4 0 4 0 0
1 - 3 4 0 4 0 4 0 0
2 - 4 5 4 9 4 9 0 0
3 - 4 5 4 9 4 9 0 0
2 - 6 6 4 10 9 15 5 5
4 - 6 6 9 15 9 15 0 0
4 - 5 6 9 15 9 15 0 0
6 – 7 4 15 19 15 19 0 0
5 - 7 4 15 19 15 19 0 0