Market returns over time
•
0 likes•134 views

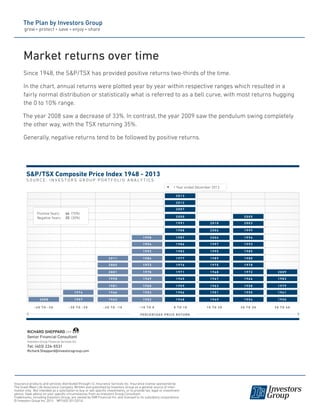
Since 1948, the S&P / TSX has provided positive returns two-thirds of the time. In the chart, annual returns were plotted year by year within respective ranges which resulted in a fairly normal distribution or statistically what is referred to as a bell curve, with most returns hugging the 0 to 10% range. The year 2008 saw a decrease of 33%. in contrast, the year 2009 saw the pendulum swing completely the other way, with the TSX returning 35%. Generally, negative returns tend to be followed by positive returns.
Recommended

Recommended
More Related Content
Similar to Market returns over time
Similar to Market returns over time (20)
More from Richard Sheppard
Recently uploaded
Recently uploaded (20)
Market returns over time
- 1. S&P/TSX Composite Price Index 1948 - 2013 S o u r c e : i n v e s t o r s g r o u p p o r t f o l i o a n a l y t i c s -30 TO -20-40 TO -30 -20 TO -10 -10 to 0 0 to 10 10 to 20 20 to 30 30 to 40 1974 1966 1953 1956 1951 1955 1961 1990 1969 1965 1967 1964 1983 2002 1973 1994 1986 1991 2007 2003 19931997 2006 1976 1975 1978 2011 1984 1998 1987 2000 2012 2005 19962004 2010 1977 1989 1980 1957 1962 1952 1948 1949 1954 1950 1981 1960 1959 1963 1958 1979 2001 1970 1992 1982 1988 1999 19851995 1971 1968 1972 2009 2008 Market returns over time Since 1948, the S&P/TSX has provided positive returns two-thirds of the time. In the chart, annual returns were plotted year by year within respective ranges which resulted in a fairly normal distribution or statistically what is referred to as a bell curve, with most returns hugging the 0 to 10% range. The year 2008 saw a decrease of 33%. In contrast, the year 2009 saw the pendulum swing completely the other way, with the TSX returning 35%. Generally, negative returns tend to be followed by positive returns. percentage price return Positive Years: 46 (70%) Negative Years: 20 (30%) 5 1 Year ended December 2013 Insurance products and services distributed through I.G. Insurance Services Inc. Insurance license sponsored by The Great-West Life Assurance Company. Written and published by Investors Group as a general source of infor- mation only. Not intended as a solicitation to buy or sell specific investments, or to provide tax, legal or investment advice. Seek advice on your specific circumstances from an Investors Group Consultant. Trademarks, including Investors Group, are owned by IGM Financial Inc. and licensed to its subsidiary corporations. © Investors Group Inc. 2014 MP1602 (01/2014) RICHARD SHEPPARD CFP Senior Financial Consultant Investors Group Financial Services Inc. Tel: (403) 226-5531 Richard.Sheppard@investorsgroup.com 2013