
Downloaded 10 times

![Thanks!
Credits: Lisa Zorn, Billy Charlton, Matt Paul
elizabeth [at] sfcta [dot] org
www.sfcta.org/modeling
www.sfcta.org/cycletracks
http://github.com/sfcta
SAN FRANCISCO COUNTY TRANSPORTATION AUTHORITY](https://image.slidesharecdn.com/trb2013buildingthetechnologypot-130118122807-phpapp02/85/Stone-Soup-Data-Collection-w-CycleTracks-30-320.jpg)
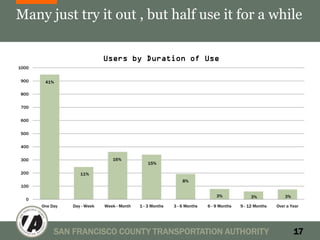
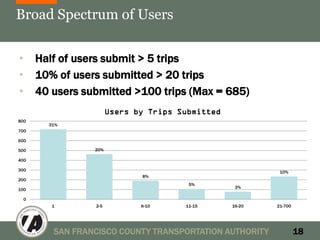
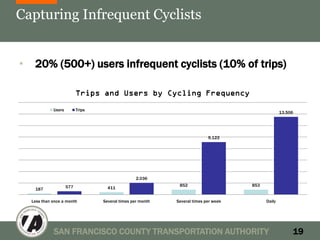
The document discusses the development of CycleTracks, an app created by the San Francisco County Transportation Authority to collect cycling data amid resource constraints. It highlights the app's scalability, user statistics, biases in data collection, and the benefits of open-source technology. Key lessons learned include the importance of effective publicity, community engagement, and maintaining the app for continuous data gathering.


