SlideShare a Scribd company logo
1 of 26
Predicting the Effects of Climate
Change on Soil Loss
You will learn how
multiple factors
contribute to soil erosion.
You will analyze how
climate change will impact
soil sustainability.
You will consider how
natural process and humans
influence soil sustainability.
The RUSLE has multiple factors that allow scientists
to estimate annual soil loss for a particular site.
Your job:
 Compare answers from your homework
 Prepare to explain your factor to the class
 List any unanswered questions your group has
about your factor
The RUSLE has multiple factors that allow scientists
to estimate annual soil loss for a particular site.
• R = rainfall and runoff erosivity
• K = soil erodibility
• LS = length slope (landscape)
• CP = cover management and support practices
Estimated average soil loss =
R*K*LS*C*P
The RUSLE equation can be used as a framework
for considering how different factors work
together.
© Copyright Andy Beecroft
Estimated average soil loss =
R*K*LS*C*P
The RUSLE equation can be used as a framework
for considering how different factors work
together.
© Copyright Andy Beecroft
Keeping all other factors the same, if a farmer changes
crop rotations such that contribution of the C factor
decreases by one third, what would that do to the
erosion rate (average soil loss)?
Estimated average soil loss =
R*K*LS*C*P
The RUSLE equation can be used as a framework
for considering how different factors work
together.
© Copyright Andy Beecroft
If soil organic matter decreases such that K doubles,
what could be done (besides adding more organic
matter) to keep the erosion rate the same?
Activity: Human activity vs. natural processes
• Which of these two factors do you think has
the most influence over…
– Support practices
– Soil porosity
– Slope steepness
– Surface cover
– Rainfall intensity
Climate change also influences agriculture.
• Go to video
Climate change is predicted to impact precipitation during the
summer growing season.
What are the
predicted changes for
your region?
Image source: Kenneth Kunkel, NOAA NCDC / Cooperative Institute for Climate and Satellites - NC
The relationship between precipitation and soil erosion is a
complex system.
Estimated average soil loss =
R*K*LS*C*P
?
The relationship between precipitation and soil erosion is a
complex system.
This diagram illustrates relationships between factors that
influence erosion in agricultural systems.
Modified from: Pruski, F. F., and M. A. Nearing, 2002, Climate-induced changes in erosion during the 21st century for eight
U.S. locations, Water Resour. Res., 38(12), 1298, doi:10.1029/2001WR000493.
+
-
-
+
+
The direction of the arrows indicates cause and effect
relationships.
(diagram modified from Pruski and Nearing, 2002)
For example, this arrow tells us that changes in precipitation
cause changes in runoff.
(diagram modified from Pruski and Nearing, 2002)
If it were pointing the other way, that would mean that changes
in runoff cause changes in precipitation. This doesn’t make
much sense!
(diagram modified from Pruski and Nearing, 2002)
X
But, the direction of the arrows doesn’t tell us how a factor
impacts other factors.
(diagram modified from Pruski and Nearing, 2002)
The + and – signs indicate what type of relationship exists
between the factors.
(diagram modified from Pruski and Nearing, 2002)
+
-
-
+
+
+ = positive relationship
- = negative relationship
A positive relationship means that a change in one factor causes
an effect on another factor in the same direction.
(diagram modified from Pruski and Nearing, 2002)
+ +
+
For example, this arrow indicates that…
an increase in precipitation causes an increase in runoff
AND
a decrease in precipitation causes a decrease in runoff
(diagram modified from Pruski and Nearing, 2002)
+
(diagram modified from Pruski and Nearing, 2002)
-
-
A negative relationship means that a change in one factor
causes an effect on another factor in the opposite direction.
(diagram modified from Pruski and Nearing, 2002)
-
For example, this arrow indicates that…
an increase in crop yield causes a decrease in erosion
AND
a decrease in crop yield causes an increase in erosion
So, we can use this diagram to describe relationships between
factors that influence erosion in agricultural systems and predict
how changes in one factor will influence other factors.
(diagram modified from Pruski and Nearing, 2002)
+
-
-
+
+
Models for Syracuse, Nebraska, predict that precipitation will
decrease overall for the region. Erosion is also expected to
decrease for wheat.
Which pathway is most likely to be dominant for wheat?
(diagram modified from Pruski and Nearing, 2002)
+
-
-
+
+
The same models predict that, while precipitation decreases
overall for the region, erosion is expected to increase for
cornfields.
Which pathway is most likely to be dominant for corn?
(diagram modified from Pruski and Nearing, 2002)
+
-
-
+
+
Based on these pathways, which crop do you think is more
severely impacted by the decrease in precipitation?
(diagram modified from Pruski and Nearing, 2002)
+
-
-
+
+
In agricultural systems, humans also make decisions that can
have big impacts.
What are some ways in
which humans influence
agriculture?

More Related Content

What's hot

Communicating Arctic climate change through data-driven stories
Communicating Arctic climate change through data-driven storiesCommunicating Arctic climate change through data-driven stories
Communicating Arctic climate change through data-driven storiesZachary Labe
 
Observations and climate model projections of Arctic climate change
Observations and climate model projections of Arctic climate changeObservations and climate model projections of Arctic climate change
Observations and climate model projections of Arctic climate changeZachary Labe
 
Are you rotating or revolving
Are you rotating or revolvingAre you rotating or revolving
Are you rotating or revolvinge045911
 
Improving science (communication) through data visualization
Improving science (communication) through data visualizationImproving science (communication) through data visualization
Improving science (communication) through data visualizationZachary Labe
 
Arc map poster on lake mead, nevada
Arc map poster on lake mead, nevadaArc map poster on lake mead, nevada
Arc map poster on lake mead, nevadaTomAdamson7
 
Refining projections of the 'warm Arctic, cold Siberia' pattern in climate mo...
Refining projections of the 'warm Arctic, cold Siberia' pattern in climate mo...Refining projections of the 'warm Arctic, cold Siberia' pattern in climate mo...
Refining projections of the 'warm Arctic, cold Siberia' pattern in climate mo...Zachary Labe
 
Trends and regional variability of observed Arctic sea-ice thickness
Trends and regional variability of observed Arctic sea-ice thicknessTrends and regional variability of observed Arctic sea-ice thickness
Trends and regional variability of observed Arctic sea-ice thicknessZachary Labe
 
7. Climate science as institutions
7. Climate science as institutions7. Climate science as institutions
7. Climate science as institutionsAdam Briggle
 
Linking the Quasi-Biennial Oscillation and Projected Arctic Sea-Ice Loss to S...
Linking the Quasi-Biennial Oscillation and Projected Arctic Sea-Ice Loss to S...Linking the Quasi-Biennial Oscillation and Projected Arctic Sea-Ice Loss to S...
Linking the Quasi-Biennial Oscillation and Projected Arctic Sea-Ice Loss to S...Zachary Labe
 

What's hot (15)

Communicating Arctic climate change through data-driven stories
Communicating Arctic climate change through data-driven storiesCommunicating Arctic climate change through data-driven stories
Communicating Arctic climate change through data-driven stories
 
brauckmann_project
brauckmann_projectbrauckmann_project
brauckmann_project
 
Lyons_AAG_16
Lyons_AAG_16Lyons_AAG_16
Lyons_AAG_16
 
Hamlet south sound_symp_oct_2010
Hamlet south sound_symp_oct_2010Hamlet south sound_symp_oct_2010
Hamlet south sound_symp_oct_2010
 
Presentation Boers - Trends in Cloudiness
Presentation Boers - Trends in CloudinessPresentation Boers - Trends in Cloudiness
Presentation Boers - Trends in Cloudiness
 
Observations and climate model projections of Arctic climate change
Observations and climate model projections of Arctic climate changeObservations and climate model projections of Arctic climate change
Observations and climate model projections of Arctic climate change
 
Are you rotating or revolving
Are you rotating or revolvingAre you rotating or revolving
Are you rotating or revolving
 
Improving science (communication) through data visualization
Improving science (communication) through data visualizationImproving science (communication) through data visualization
Improving science (communication) through data visualization
 
Exploring_GIS_in_Glaciology
Exploring_GIS_in_GlaciologyExploring_GIS_in_Glaciology
Exploring_GIS_in_Glaciology
 
Arc map poster on lake mead, nevada
Arc map poster on lake mead, nevadaArc map poster on lake mead, nevada
Arc map poster on lake mead, nevada
 
Refining projections of the 'warm Arctic, cold Siberia' pattern in climate mo...
Refining projections of the 'warm Arctic, cold Siberia' pattern in climate mo...Refining projections of the 'warm Arctic, cold Siberia' pattern in climate mo...
Refining projections of the 'warm Arctic, cold Siberia' pattern in climate mo...
 
Trends and regional variability of observed Arctic sea-ice thickness
Trends and regional variability of observed Arctic sea-ice thicknessTrends and regional variability of observed Arctic sea-ice thickness
Trends and regional variability of observed Arctic sea-ice thickness
 
7. Climate science as institutions
7. Climate science as institutions7. Climate science as institutions
7. Climate science as institutions
 
Linking the Quasi-Biennial Oscillation and Projected Arctic Sea-Ice Loss to S...
Linking the Quasi-Biennial Oscillation and Projected Arctic Sea-Ice Loss to S...Linking the Quasi-Biennial Oscillation and Projected Arctic Sea-Ice Loss to S...
Linking the Quasi-Biennial Oscillation and Projected Arctic Sea-Ice Loss to S...
 
STARPoster_Lykens
STARPoster_LykensSTARPoster_Lykens
STARPoster_Lykens
 

Similar to Powerpoint for Guided Lecture

soil erosion modelling by RUSLE
soil erosion modelling by RUSLEsoil erosion modelling by RUSLE
soil erosion modelling by RUSLEkaushal gadariya
 
Estimation Of Soil Erosion In Andhale Watershed Using USLE And GIS
Estimation Of Soil Erosion In Andhale Watershed Using USLE And GISEstimation Of Soil Erosion In Andhale Watershed Using USLE And GIS
Estimation Of Soil Erosion In Andhale Watershed Using USLE And GISIRJET Journal
 
ESTIMATION OF SOIL LOSS (USLE).pptx
ESTIMATION OF SOIL LOSS (USLE).pptxESTIMATION OF SOIL LOSS (USLE).pptx
ESTIMATION OF SOIL LOSS (USLE).pptxsushreepratikshya
 
StreamFlow Variability of 21 Watersheds, Oregon
StreamFlow Variability of 21 Watersheds, OregonStreamFlow Variability of 21 Watersheds, Oregon
StreamFlow Variability of 21 Watersheds, OregonDonnych Diaz
 
The global impact of soil
The global impact of soilThe global impact of soil
The global impact of soilLandDegradation
 
Oregon; Neighborhood Level Analysis Of Rainwater Catchment In Portland
Oregon;  Neighborhood Level Analysis Of Rainwater Catchment In PortlandOregon;  Neighborhood Level Analysis Of Rainwater Catchment In Portland
Oregon; Neighborhood Level Analysis Of Rainwater Catchment In PortlandV9X
 
A review of the Application of the Revised Universal Soil Loss Equation for e...
A review of the Application of the Revised Universal Soil Loss Equation for e...A review of the Application of the Revised Universal Soil Loss Equation for e...
A review of the Application of the Revised Universal Soil Loss Equation for e...IRJET Journal
 
porosity model evaluation pressured by void ratio on homogenous compression
porosity model evaluation pressured by void ratio on homogenous compressionporosity model evaluation pressured by void ratio on homogenous compression
porosity model evaluation pressured by void ratio on homogenous compressionIJCMESJOURNAL
 
climate_change_impacts_on_agriculture.pptx
climate_change_impacts_on_agriculture.pptxclimate_change_impacts_on_agriculture.pptx
climate_change_impacts_on_agriculture.pptxAnwaar Ahmed
 
Marcellus Shale Wildlife/Nature Impacts Research Study from Nature Conservancy
Marcellus Shale Wildlife/Nature Impacts Research Study from Nature ConservancyMarcellus Shale Wildlife/Nature Impacts Research Study from Nature Conservancy
Marcellus Shale Wildlife/Nature Impacts Research Study from Nature ConservancyMarcellus Drilling News
 
Watershed Anylsis for Sevenmile Creek
Watershed Anylsis for Sevenmile CreekWatershed Anylsis for Sevenmile Creek
Watershed Anylsis for Sevenmile CreekAaron King
 
Romero ruiz-et-al
Romero ruiz-et-alRomero ruiz-et-al
Romero ruiz-et-alSSSB
 
Soil Dynamics - Local Site Effects - Ground response - Geotechnical Earthquak...
Soil Dynamics - Local Site Effects - Ground response - Geotechnical Earthquak...Soil Dynamics - Local Site Effects - Ground response - Geotechnical Earthquak...
Soil Dynamics - Local Site Effects - Ground response - Geotechnical Earthquak...Cristian Soriano-Camelo
 

Similar to Powerpoint for Guided Lecture (20)

05Soil_Erosion.pdf
05Soil_Erosion.pdf05Soil_Erosion.pdf
05Soil_Erosion.pdf
 
USLE
USLEUSLE
USLE
 
soil erosion modelling by RUSLE
soil erosion modelling by RUSLEsoil erosion modelling by RUSLE
soil erosion modelling by RUSLE
 
Estimation Of Soil Erosion In Andhale Watershed Using USLE And GIS
Estimation Of Soil Erosion In Andhale Watershed Using USLE And GISEstimation Of Soil Erosion In Andhale Watershed Using USLE And GIS
Estimation Of Soil Erosion In Andhale Watershed Using USLE And GIS
 
ESTIMATION OF SOIL LOSS (USLE).pptx
ESTIMATION OF SOIL LOSS (USLE).pptxESTIMATION OF SOIL LOSS (USLE).pptx
ESTIMATION OF SOIL LOSS (USLE).pptx
 
StreamFlow Variability of 21 Watersheds, Oregon
StreamFlow Variability of 21 Watersheds, OregonStreamFlow Variability of 21 Watersheds, Oregon
StreamFlow Variability of 21 Watersheds, Oregon
 
Goiul.ppt
Goiul.pptGoiul.ppt
Goiul.ppt
 
The global impact of soil
The global impact of soilThe global impact of soil
The global impact of soil
 
finalturnin
finalturninfinalturnin
finalturnin
 
Oregon; Neighborhood Level Analysis Of Rainwater Catchment In Portland
Oregon;  Neighborhood Level Analysis Of Rainwater Catchment In PortlandOregon;  Neighborhood Level Analysis Of Rainwater Catchment In Portland
Oregon; Neighborhood Level Analysis Of Rainwater Catchment In Portland
 
A review of the Application of the Revised Universal Soil Loss Equation for e...
A review of the Application of the Revised Universal Soil Loss Equation for e...A review of the Application of the Revised Universal Soil Loss Equation for e...
A review of the Application of the Revised Universal Soil Loss Equation for e...
 
porosity model evaluation pressured by void ratio on homogenous compression
porosity model evaluation pressured by void ratio on homogenous compressionporosity model evaluation pressured by void ratio on homogenous compression
porosity model evaluation pressured by void ratio on homogenous compression
 
climate_change_impacts_on_agriculture.pptx
climate_change_impacts_on_agriculture.pptxclimate_change_impacts_on_agriculture.pptx
climate_change_impacts_on_agriculture.pptx
 
Marcellus Shale Wildlife/Nature Impacts Research Study from Nature Conservancy
Marcellus Shale Wildlife/Nature Impacts Research Study from Nature ConservancyMarcellus Shale Wildlife/Nature Impacts Research Study from Nature Conservancy
Marcellus Shale Wildlife/Nature Impacts Research Study from Nature Conservancy
 
Poster Presentations
Poster PresentationsPoster Presentations
Poster Presentations
 
Lulc dynamics
Lulc dynamicsLulc dynamics
Lulc dynamics
 
Report Argonne
Report ArgonneReport Argonne
Report Argonne
 
Watershed Anylsis for Sevenmile Creek
Watershed Anylsis for Sevenmile CreekWatershed Anylsis for Sevenmile Creek
Watershed Anylsis for Sevenmile Creek
 
Romero ruiz-et-al
Romero ruiz-et-alRomero ruiz-et-al
Romero ruiz-et-al
 
Soil Dynamics - Local Site Effects - Ground response - Geotechnical Earthquak...
Soil Dynamics - Local Site Effects - Ground response - Geotechnical Earthquak...Soil Dynamics - Local Site Effects - Ground response - Geotechnical Earthquak...
Soil Dynamics - Local Site Effects - Ground response - Geotechnical Earthquak...
 

More from SERC at Carleton College

StatVignette03_Sig.Figs_v04_07_15_2020.pptx
StatVignette03_Sig.Figs_v04_07_15_2020.pptxStatVignette03_Sig.Figs_v04_07_15_2020.pptx
StatVignette03_Sig.Figs_v04_07_15_2020.pptxSERC at Carleton College
 
Cretaceous Coatlines and Modern Voting Patterns Presentation
Cretaceous Coatlines and Modern Voting Patterns PresentationCretaceous Coatlines and Modern Voting Patterns Presentation
Cretaceous Coatlines and Modern Voting Patterns PresentationSERC at Carleton College
 
Presentation: Unit 1 Introduction to the hydrological cycle
Presentation: Unit 1 Introduction to the hydrological cyclePresentation: Unit 1 Introduction to the hydrological cycle
Presentation: Unit 1 Introduction to the hydrological cycleSERC at Carleton College
 
KSKL_Chapter 4_ Chem Properties of Soils.pptx
KSKL_Chapter 4_ Chem Properties of Soils.pptxKSKL_Chapter 4_ Chem Properties of Soils.pptx
KSKL_Chapter 4_ Chem Properties of Soils.pptxSERC at Carleton College
 
Presentation: Unit 3 background information
Presentation: Unit 3 background informationPresentation: Unit 3 background information
Presentation: Unit 3 background informationSERC at Carleton College
 
Presentation: Unit 2 Measuring Groundwater Background Information
Presentation: Unit 2 Measuring Groundwater Background InformationPresentation: Unit 2 Measuring Groundwater Background Information
Presentation: Unit 2 Measuring Groundwater Background InformationSERC at Carleton College
 

More from SERC at Carleton College (20)

StatVignette03_Sig.Figs_v04_07_15_2020.pptx
StatVignette03_Sig.Figs_v04_07_15_2020.pptxStatVignette03_Sig.Figs_v04_07_15_2020.pptx
StatVignette03_Sig.Figs_v04_07_15_2020.pptx
 
StatVignette06_HypTesting.pptx
StatVignette06_HypTesting.pptxStatVignette06_HypTesting.pptx
StatVignette06_HypTesting.pptx
 
Unit 1 (optional slides)
Unit 1 (optional slides)Unit 1 (optional slides)
Unit 1 (optional slides)
 
Cretaceous Coatlines and Modern Voting Patterns Presentation
Cretaceous Coatlines and Modern Voting Patterns PresentationCretaceous Coatlines and Modern Voting Patterns Presentation
Cretaceous Coatlines and Modern Voting Patterns Presentation
 
Climate and Biomes PPT 2
Climate and Biomes PPT 2Climate and Biomes PPT 2
Climate and Biomes PPT 2
 
weather tracking ppt
weather tracking pptweather tracking ppt
weather tracking ppt
 
Presentation: Unit 1 Introduction to the hydrological cycle
Presentation: Unit 1 Introduction to the hydrological cyclePresentation: Unit 1 Introduction to the hydrological cycle
Presentation: Unit 1 Introduction to the hydrological cycle
 
StatVignette05_M3_v02_10_21_2020.pptx
StatVignette05_M3_v02_10_21_2020.pptxStatVignette05_M3_v02_10_21_2020.pptx
StatVignette05_M3_v02_10_21_2020.pptx
 
KSKL chapter 8 PPT
KSKL chapter 8 PPTKSKL chapter 8 PPT
KSKL chapter 8 PPT
 
KSKL chap 5 PPT
KSKL chap 5 PPTKSKL chap 5 PPT
KSKL chap 5 PPT
 
KSKL_Chapter 4_ Chem Properties of Soils.pptx
KSKL_Chapter 4_ Chem Properties of Soils.pptxKSKL_Chapter 4_ Chem Properties of Soils.pptx
KSKL_Chapter 4_ Chem Properties of Soils.pptx
 
Degraded Soil Images.pptx
Degraded Soil Images.pptxDegraded Soil Images.pptx
Degraded Soil Images.pptx
 
Educators PPT file chapter 7
Educators PPT file chapter 7Educators PPT file chapter 7
Educators PPT file chapter 7
 
Educators PPT file chapter 2
Educators PPT file chapter 2Educators PPT file chapter 2
Educators PPT file chapter 2
 
Educators PPT file chapter 6
Educators PPT file chapter 6Educators PPT file chapter 6
Educators PPT file chapter 6
 
Educators PPT chapter 3
Educators PPT chapter 3Educators PPT chapter 3
Educators PPT chapter 3
 
Unit 4 background presentation
Unit 4 background presentationUnit 4 background presentation
Unit 4 background presentation
 
Presentation: Unit 3 background information
Presentation: Unit 3 background informationPresentation: Unit 3 background information
Presentation: Unit 3 background information
 
Presentation: Unit 2 Measuring Groundwater Background Information
Presentation: Unit 2 Measuring Groundwater Background InformationPresentation: Unit 2 Measuring Groundwater Background Information
Presentation: Unit 2 Measuring Groundwater Background Information
 
Introduction to GPS presentation
Introduction to GPS presentationIntroduction to GPS presentation
Introduction to GPS presentation
 

Powerpoint for Guided Lecture

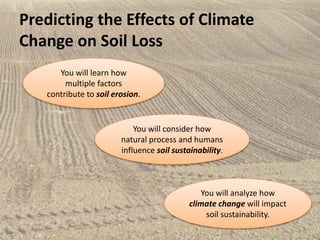
  • 1. Predicting the Effects of Climate Change on Soil Loss You will learn how multiple factors contribute to soil erosion. You will analyze how climate change will impact soil sustainability. You will consider how natural process and humans influence soil sustainability.
  • 2. The RUSLE has multiple factors that allow scientists to estimate annual soil loss for a particular site. Your job:  Compare answers from your homework  Prepare to explain your factor to the class  List any unanswered questions your group has about your factor
  • 3. The RUSLE has multiple factors that allow scientists to estimate annual soil loss for a particular site. • R = rainfall and runoff erosivity • K = soil erodibility • LS = length slope (landscape) • CP = cover management and support practices
  • 4. Estimated average soil loss = R*K*LS*C*P The RUSLE equation can be used as a framework for considering how different factors work together. © Copyright Andy Beecroft
  • 5. Estimated average soil loss = R*K*LS*C*P The RUSLE equation can be used as a framework for considering how different factors work together. © Copyright Andy Beecroft Keeping all other factors the same, if a farmer changes crop rotations such that contribution of the C factor decreases by one third, what would that do to the erosion rate (average soil loss)?
  • 6. Estimated average soil loss = R*K*LS*C*P The RUSLE equation can be used as a framework for considering how different factors work together. © Copyright Andy Beecroft If soil organic matter decreases such that K doubles, what could be done (besides adding more organic matter) to keep the erosion rate the same?
  • 7. Activity: Human activity vs. natural processes • Which of these two factors do you think has the most influence over… – Support practices – Soil porosity – Slope steepness – Surface cover – Rainfall intensity
  • 8. Climate change also influences agriculture. • Go to video
  • 9. Climate change is predicted to impact precipitation during the summer growing season. What are the predicted changes for your region? Image source: Kenneth Kunkel, NOAA NCDC / Cooperative Institute for Climate and Satellites - NC
  • 10. The relationship between precipitation and soil erosion is a complex system. Estimated average soil loss = R*K*LS*C*P
  • 11. ? The relationship between precipitation and soil erosion is a complex system.
  • 12. This diagram illustrates relationships between factors that influence erosion in agricultural systems. Modified from: Pruski, F. F., and M. A. Nearing, 2002, Climate-induced changes in erosion during the 21st century for eight U.S. locations, Water Resour. Res., 38(12), 1298, doi:10.1029/2001WR000493. + - - + +
  • 13. The direction of the arrows indicates cause and effect relationships. (diagram modified from Pruski and Nearing, 2002)
  • 14. For example, this arrow tells us that changes in precipitation cause changes in runoff. (diagram modified from Pruski and Nearing, 2002)
  • 15. If it were pointing the other way, that would mean that changes in runoff cause changes in precipitation. This doesn’t make much sense! (diagram modified from Pruski and Nearing, 2002) X
  • 16. But, the direction of the arrows doesn’t tell us how a factor impacts other factors. (diagram modified from Pruski and Nearing, 2002)
  • 17. The + and – signs indicate what type of relationship exists between the factors. (diagram modified from Pruski and Nearing, 2002) + - - + + + = positive relationship - = negative relationship
  • 18. A positive relationship means that a change in one factor causes an effect on another factor in the same direction. (diagram modified from Pruski and Nearing, 2002) + + +
  • 19. For example, this arrow indicates that… an increase in precipitation causes an increase in runoff AND a decrease in precipitation causes a decrease in runoff (diagram modified from Pruski and Nearing, 2002) +
  • 20. (diagram modified from Pruski and Nearing, 2002) - - A negative relationship means that a change in one factor causes an effect on another factor in the opposite direction.
  • 21. (diagram modified from Pruski and Nearing, 2002) - For example, this arrow indicates that… an increase in crop yield causes a decrease in erosion AND a decrease in crop yield causes an increase in erosion
  • 22. So, we can use this diagram to describe relationships between factors that influence erosion in agricultural systems and predict how changes in one factor will influence other factors. (diagram modified from Pruski and Nearing, 2002) + - - + +
  • 23. Models for Syracuse, Nebraska, predict that precipitation will decrease overall for the region. Erosion is also expected to decrease for wheat. Which pathway is most likely to be dominant for wheat? (diagram modified from Pruski and Nearing, 2002) + - - + +
  • 24. The same models predict that, while precipitation decreases overall for the region, erosion is expected to increase for cornfields. Which pathway is most likely to be dominant for corn? (diagram modified from Pruski and Nearing, 2002) + - - + +
  • 25. Based on these pathways, which crop do you think is more severely impacted by the decrease in precipitation? (diagram modified from Pruski and Nearing, 2002) + - - + +
  • 26. In agricultural systems, humans also make decisions that can have big impacts. What are some ways in which humans influence agriculture?