Download as PDF, PPTX
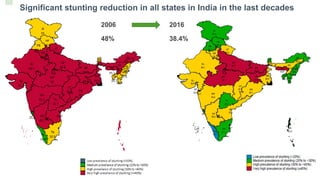
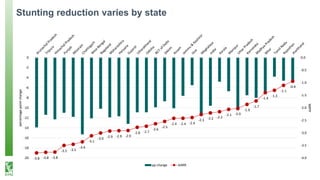
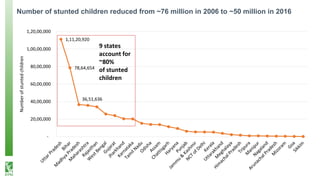
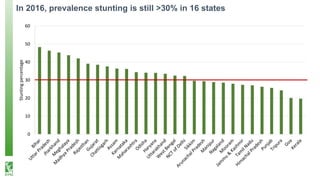
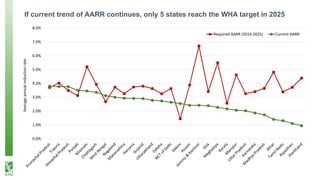
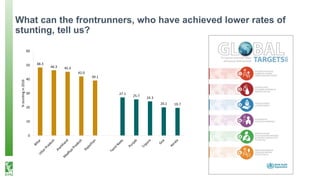
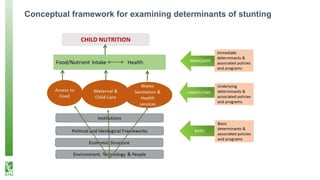
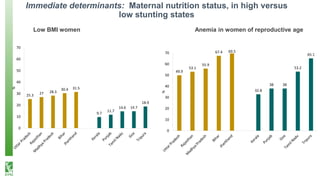
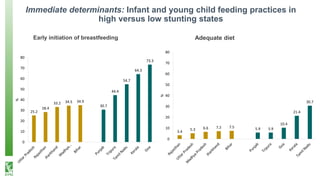
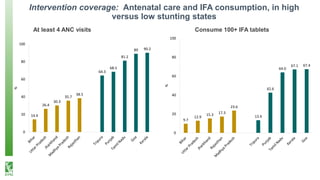
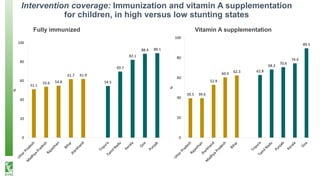
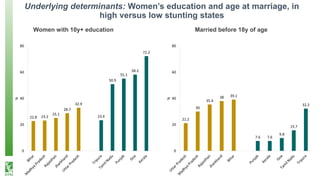
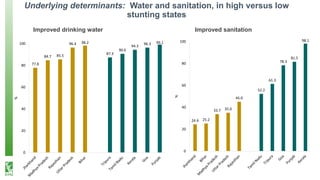
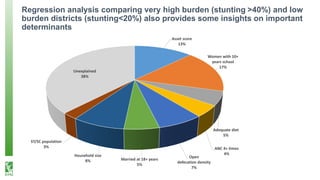
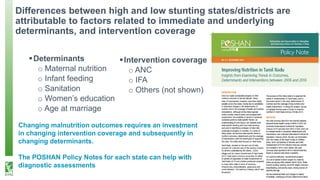

The document presents an analysis of stunting reduction in India, highlighting significant progress from 2006 to 2016, where the number of stunted children decreased from approximately 76 million to 50 million. It identifies key determinants affecting stunting rates, such as maternal nutrition, infant feeding practices, and education, while emphasizing the variability in stunting across different states. The document advocates for targeted policy interventions to address malnutrition and leverage successful strategies from states that have achieved better outcomes.


