More Related Content
Similar to Final_project (20)
Final_project
- 1. Copyright:© 2014 Esri
¯
0 10 20 30 405
Miles
Copyright:© 2014 Esri
¯
0 10 20 30 405
Miles
Copyright:© 2014 Esri
¯
0 10 20 30 405
Miles
Copyright:© 2014 Esri
¯
0 10 20 30 405
Miles
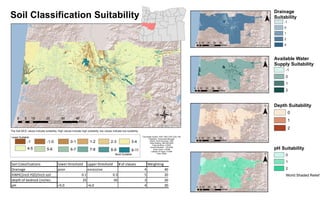
Drainage
Suitability
-1
0
1
2
4
Available Water
Supply Suitability
-1
0
1
2
Depth Suitability
0
1
2
pH Suitability
0
1
2
World Shaded Relief
Soil Classifications lower threshold upper threshold # of classes Weighting
Drainage poor excessive 4 40
AWHC(inch H2O/Inch soil 0.1 0.3 5 20
depth of bedrock (inches 25 65 3 20
pH <5.0 >6.0 4 20
Least Suitable
Most Suitable
-1 -1-0 0-1 1-2 2-3 3-4
4-5 5-6 6-7 7-8 8-9 9-11
Copyright:© 2014 Esri
Soil Classification Suitability
/0 10 20 30 405
Miles
The Soil MCE values indicate suitability. High values indicate high suitability, low values indicate low suitability.
Coordinate System: NAD 1983 UTM Zone 10N
Projection: Transverse Mercator
Datum: North American 1983
False Easting: 500,000.0000
False Northing: 0.0000
Central Meridian: -123.0000
Scale Factor: 0.9996
Latitude Of Origin: 0.0000
Units: Meter
- 2. 8
-3 -2 -1 0 1 2
3 4 5 6 7
Least Suitable
Most Suitable
Elevation
Suitability
-1
0
1
2
Aspect
Suitability
0
1
2
Slope
Suitability
-1
0
1
2
Copyright:© 2014 Esri
¯
0 10 20 30 405
Miles
Copyright:© 2014 Esri
¯
0 10 20 30 405
Miles
Copyright:© 2014 Esri
¯
0 10 20 30 405
Miles
Topographic Suitability
Copyright:© 2014 Esri
/0 10 20 30 405
Miles
Topographic Classifications Lower Threshold Upper Threshold # of classes Weighting
Elevation (m) 0 >1200 4 35
Slope <1 >30 4 35
Aspect (degrees) 0 360 3 30
For the topography suitability analysis high values indicate high suitability and low values indicate low suitability
Coordinate System: NAD 1983 UTM Zone 10N
Projection: Transverse Mercator
Datum: North American 1983
False Easting: 500,000.0000
False Northing: 0.0000
Central Meridian: -123.0000
Scale Factor: 0.9996
Latitude Of Origin: 0.0000
Units: Meter
- 3. Copyright:© 2014 Esri
Copyright:© 2014 Esri
Zone Type Area (ft^2) Area (acres)
Rural Residential (5 and 10 acre) 2523863217 57939.6952
Marginal Lands 94642160.6 2172.67636
Farm and Forest 8986282.569 206.295836
Exclusive Farm Use 8597388752 197368.098
Agriculture/Grazing/Timber 11784966.29 270.544517
General Rural 5515925.951 126.627729
Lane County Zoning
Unsuitable areas
Zone Type
AGRICULTURE/GRAZING/TIMBER
AGRICULTURE/GRAZING/TIMBER 5 ACRE MIN
EXCLUSIVE FARM USE
EXCLUSIVE FARM USE 25 ACRE MIN
EXCLUSIVE FARM USE 30 ACRE MIN
EXCLUSIVE FARM USE 40 ACRE MIN
EXCLUSIVE FARM USE 60 ACRE MIN
FARM & FOREST 20 ACRE MIN
GENERAL RURAL 10 ACRE MIN
MARGINAL LANDS
RURAL RESIDENTIAL
RURAL RESIDENTIAL 10 ACRE MIN
RURAL RESIDENTIAL 5 ACRE MIN
Land Use Suitability
Zone suitability
Value 0 1 2
Land Use is an important parameter in this analysis. Viticulture is unique in that the
very appearence of the vines is important. The vineyard, and associated
buildings (tasting room, barrel room, ect) draw potential customers in. Iit is important
that the vineyard be in an area where it can be seen regularly by prospective
customers. Areas that are zoned as Rural Residential are ideal locations for
vineyards. For this analysis Rural Residential areas were given the highest ranking.
/
/0 10 20 30 405
Miles
0 10 20 30 405
Miles
Coordinate System: NAD 1983 UTM Zone 10N
Projection: Transverse Mercator
Datum: North American 1983
False Easting: 500,000.0000
False Northing: 0.0000
Central Meridian: -123.0000
Scale Factor: 0.9996
Latitude Of Origin: 0.0000
Units: Meter
- 4. Copyright:© 2014 Esri
Combine Suitability Analysis
Coordinate System: NAD 1983 UTM Zone 10N
Projection: Transverse Mercator
Datum: North American 1983
False Easting: 500,000.0000
False Northing: 0.0000
Central Meridian: -123.0000
Scale Factor: 0.9996
Latitude Of Origin: 0.0000
Units: Meter
0 9 18 27 364.5
Miles
Suitability
<VALUE>
-3 - 0.952941176
0.952941176 - 2.929411765
2.929411766 - 3.964705882
3.964705883 - 5.941176471
5.941176472 - 7.917647059
7.91764706 - 9.988235294
9.988235295 - 11.96470588
11.96470589 - 13.94117647
13.94117648 - 15.91764706
15.91764707 - 21
/
This final analysis includes a weigthed sum of all parameters (topography, soil, and land use).
The highest values indicate ares of high suitability, the lowest values indicate areas of low suitabililty.