SlideShare a Scribd company logo
1 of 5
Download to read offline
Nanoscale
COMMUNICATION
Cite this: DOI: 10.1039/c5nr01158b
Received 18th February 2015,
Accepted 6th May 2015
DOI: 10.1039/c5nr01158b
www.rsc.org/nanoscale
Design of ultrasensitive DNA-based fluorescent
pH sensitive nanodevices†
Saheli Haldera
and Yamuna Krishnan*a,b
Here we tune the pH sensitivity of a DNA-based conformational
switch, called the I-switch, to yield a set of fluorescent pH sensi-
tive nanodevices with a collective, expanded pH sensing regime
from 5.3 to 7.5. The expanded pH regime of this new family of
I-switches originates from a dramatic improvement in the overall
percentage signal change in response to pH of these nanodevices.
The availability of non Watson–Crick base pairing in DNA has
led to the discovery of several functional DNA architectures
which have been deployed in cellulo to yield insight on intra-
cellular chemical environments.1
In 1993, Gueron and co-
workers found that the DNA sequence d(C5T) can form a
special tetraplex structure called the i-motif under acidic con-
ditions where two parallel duplexes paired via C·CH+
pairs
intercalated with each other in a head to tail orientation.2,3
It
has applications as a pH reporter4–9
in the context of synthetic
DNA-based conformational switches,6,7
where an i-motif
induced conformational change is transduced into a photonic
output8
using FRET. One such nanodevice called the I-switch
has been used to study pH of endocytic organelles in cells and
in vivo.9
However, different intracellular organelles maintain a
different resting pH that varies from pH 5.0 (lysosomes) to pH
8.0 (mitochondria) and thus, there is a need to engineer
I-switches which can respond to the whole physiological range.
There is evidence that the pH responsive regime of i-motif
based conformational switches may be tuned by increasing the
number of cytosine in a stretch.10–12
However, the cooperativity
of folding also correlates directly with i-motif stability.13,14
As a
result, along with the increase in the midpoint of the pH-
induced structural transition (pHhalf ) there is an unavoidable
increase in its cooperativity that narrows the overall pH sensi-
tive regime.14
A narrower pH regime is useful in certain con-
texts as it provides better pH resolution. It is however, highly
desirable to alter the pHhalf without overly affecting the
cooperativity.
Cytosine hemiprotonation drives i-motif formation. The
pKa of Cytosine N3 is 4.45 and thus DNA4 i-motifs are maxi-
mally stabilized at ∼pH 5.0.15
This typically results in
I-switches with pH reporting capacity at 5.5 < pH < 7.0. We
reasoned that introduction of chemically modified cyto-
sines16,17
with a lower or higher pKa such as 5′-bromocytosine
(pKa 2.5) or 5′-methylcytosine (pKa 4.7)18
could accordingly
tune I-switch response by altering the pHhalf of the structural
transition while possibly maintaining the cooperativity. We
observed that fully-brominated or fully-methylated cytosines in
the C-rich domain of I4 failed to form i-motifs at room tem-
perature in our hands. Thus, we doped I4 with cytosine modi-
fications at specific positions while keeping the total number
of modified cytosines per I-switch constant (N = 4) to see if
this could alter the pHhalf of the structural transition. The new
family of I-switches incorporates a stretch of four, pH sensitive,
C-rich segment (C4TAA)3C4 that forms a mismatched duplex at
neutral or basic pH with a partially complementary G-rich
strand (TTTGTTATGTGTTATGTGTTAT), where T indicates mis-
matches. In this I-switch design, the C-rich segment bears a
donor fluorophore (green sphere, Alexa 488) and the mis-
matched duplex positions an acceptor fluorophore (red sphere,
Alexa 647) far apart (Fig. 1a). At acidic pH, the mismatched
duplex frays as the C-rich strand forms an i-motif, bringing the
two fluorophores into a high FRET conformation that may be
monitored by fluorescence spectroscopy. The perfect duplex
domain (black) harbors a binding site for a recombinant anti-
body to enable targeting. Fig. 1b and c shows only the i-motif
domain of the I-switch where only the cytosine residues are
represented as triangles, the apices of the triangles pointing
towards the 3′ end of the strand. The grey triangles represent
unmodified cytosines while the red and blue triangles rep-
resent sites that incorporate either 5′-bromocytosines (Br
I-switches, red triangles) or 5′-methylcytosines (Me I-switches,
blue triangles) respectively in the modified I-switches. Fig. 1c
shows the four classes of modified I-switches we have investi-
†Electronic supplementary information (ESI) available: Materials and methods,
ESI Fig. 1–6. See DOI: 10.1039/c5nr01158b
a
National Centre for Biological Sciences, TIFR, GKVK, Bellary Road,
Bangalore 560 065, India
b
Department of Chemistry, The University of Chicago, GCIS, 929 East 57th Street,
Chicago, Illinois 60637, USA. E-mail: yamuna@uchicago.edu
This journal is © The Royal Society of Chemistry 2015 Nanoscale
Publishedon20May2015.DownloadedbyIndianInstituteofScienceon26/05/201507:23:25.
View Article Online
View Journal
gated categorized on the basis of the relative positions of the
modified cytosines in the i-motif domain of the I-switch. The
first class incorporates either two all-bromo or two all-methyl
modified Cm–H+
–Cm base pairs at positions 3, 9, 17, 23 that lie
at the core of the resultant i-motif (Core) with the reasoning
that these could possibly affect the nucleation event for i-motif
formation. The second class incorporates either two all-bromo
or two all-methyl modifications at the peripheral Cm–H+
–Cm
base pairs at positions 1, 11, 15, 25 (End) with the reasoning
that these could modulate i-motif fraying and thereby stability
to possibly shift the pH responsive regime.19
In the Core and
End designs, the i-motifs have two modified Cm–H+
–Cm base-
pairs on adjacent stacks. We therefore sought to modulate pH
of responsivity differently by interspersing two modified Cm–
H+
–Cm base pairs between unmodified C–H+
–C base pairs. We
therefore introduced modifications at positions 15, 17, 23, 25
to yield the Interspersed variant shown in Fig. 1c. All these var-
iants have two all-bromo or all-methyl modified Cm–H+
–Cm
base-pairs in different topologies. We then sought to modulate
pHhalf by instead incorporating four hemi-modified Cm–H+
–C
base pairs, by modifying only one of the participating cyto-
sines of a C–H+
–C base pair. We did this by introducing modi-
fications on four consecutive cytosines at positions 1, 2, 3, 4 at
the 5′ end (Consecutive).
First, we confirmed formation of i-motifs at acidic pH by
the C-rich domains of all the I-switch variants used in this
study. This was done by monitoring the difference in Circular
Dichroism (CD) spectra between pH 5.0 and pH 8.5 from
220 nm–320 nm (Fig. S2†). The difference spectra of pH 5.0
and pH 8.5 showed a positive band centered around 292 nm,
and a negative band centered around 260 nm.20
This is the
characteristic CD signature of i-motif structure that is held
together by C–H+
–C base pairs21–23
This was further confirmed
by CD spectroscopy at as a function of pH of all the new
I-switches (Br I-switches and Me I-switches) (Fig. 2a and b).
The change in molar ellipticity at 292 nm, where the C–H+
–C
basepairs are known to absorb maximally was plotted as a
function of pH. For uniformity, molar ellipticity of all
I-switches was normalised from 0 to 1. As the pH increases,
the structural transition from i-motif structure to duplex DNA
occurs, hence, positive band at 292 nm decreases sigmoidally
due to the decrease in C–H+
–C base pairs reflecting the pH
induced denaturation of the i-motif. The different Br modified
switches namely Interspersed, Core, End and Consecutive
showed a pHhalf of structural transition at pH 6.6 ± 0.2, 7.3 ±
0.2, 6.2 ± 0.2 and 6.8 ± 0.1 respectively. The different Me modi-
fied switches namely Interspersed, Core, End and Consecutive
showed pHhalf at pH 6.8 ± 0.2, 7.0 ± 0.3, 6.9 ± 0.2 and 7.0 ± 0.2
respectively. Bearing in mind that I4 showed a pHhalf at pH
6.6 ± 0.2 and the pKa of 5 methyl Cytosine is only 0.2 pH units
higher than cytosine, this indicates that the Me-I-switches
have been tuned according to the expectation, i.e., 0.3–0.5 pH
units higher. The End variant of the Br-I switch was tuned only
to 0.4 pH units lower. However, this is the only Br-I-switches,
that was tuned in the right direction, and this point is dis-
cussed later. Nevertheless these modest changes in pHhalf of
the modified switches informed us that i-motif induced struc-
tural transitions were indeed confirmed in these assemblies
before one proceeded to FRET reporters of the transition.24
To investigate the capability and performance of these
modified I-switches as pH reporters we proceeded to investi-
gate the pH-induced transition by fluorescence resonance
energy transfer (FRET) using I-switch variants bearing donor
Fig. 1 Schematic representation of the working principle of the
I-switch and its various modifications. (a) Working principle of the
I-switch; C-rich domain, donor and acceptor fluorophores are shown in
grey, green and red respectively. (b) Schematic of i-motif formed in
I-switches. Cytosine (grey triangles) modified cytosines (coloured tri-
angles) positions are indicated. Triangle apices point towards the 3’
strand terminus. (c) I-switch variants incorporating modified cytosines
used in this study.
Fig. 2 In vitro characterisation of all I-switch variants. (a and b) Norma-
lised ellipticity (Θ) at 292 nm of 1 µM native (I4) and (a) 5’-bromocytosine
modified (Br I-switches) I-switches (b) 5’-methylcytosine modified (Me
I-switches) in 1× clamping buffer is shown as a function of pH. All
experiments were performed in duplicate at RT and shown as mean ±
standard error of the mean.
Communication Nanoscale
Nanoscale This journal is © The Royal Society of Chemistry 2015
Publishedon20May2015.DownloadedbyIndianInstituteofScienceon26/05/201507:23:25.
View Article Online
and acceptor fluorophores as shown in Fig. 1. At basic pH the
labels are held far apart by a mismatched duplex showing low
FRET and high D/A values, while at acidic pH the i-motif
domains shorten the distances between the two fluorophores
showing high FRET and consequently low D/A values. The
dually labeled I-switch variants (1× clamping buffer of desired
pH, 120 mM KCl, 5 mM NaCl, 20 mM HEPES, 1 mM CaCl2
and 1 mM MgCl2) were excited at 495 nm and emission
spectra were collected from 505 nm to 725 nm. Emission
intensity at 520 nm from Alexa 488 (D) was divided by emis-
sion intensity at 669 nm from Alexa 647 (A) to obtain D/A
ratios at various pH which was then normalised to pH 4.0 and
plotted as a function of pH (Fig. 3a and b). This gives the
characteristic pH responsive regime and pH sensitivity of the
given I-switch variant. The change in D/A ratios was a result of
both decrease in Alexa 488 intensity and increase in the Alexa
647 intensity due to FRET (Fig. S3†) yielding a characteristic
sigmoidal curve.
The Me I-switch variants Interspersed, Core, End and Con-
secutive all showed FRET pHhalf values that were in fairly good
correspondence with their CD pHhalf values (Table 1). This was
also the case with all the Br I-switches except the Core variant.
This variant showed pHhalf of 6.1 ± 0.1, in large discrepancy
with the CD transition, but showed an overall shift of pH sensi-
tivity in the expected direction. CD and FRET measure
different parameters associated with the transition and it is
not unusual to find discrepancies in pHhalf between the two
methods. The success in this strategy of tuning using nucleo-
base pKa is evident from the derivatives of the D/A vs. pH
traces (Fig. 3c and d). When the number of cytosines increases
from I4 to I7, although the pHhalf of I7 changes to 7.03, the
cooperativity increases to 6.3 and its pH responsive regime
spans 0.5 pH units from Fig. 3d and Table 1. The Core Me-I-
switch whose pHhalf has been tuned to 7.1, with a cooperativity
of only 3.3 (Table 1) spans a pH sensitive regime of 1.0 pH
units.
The most notable feature of this new family of I-switches,
which was unpredicted, was the phenomenal fold change in
D/A ratio between the closed and open states. The overall per-
centage of signal change (%SC) of each of these variants dra-
matically increased ranging from 770% (Core Br I-switch) to
1400% (End Me-I-switch). %SC of any reporter is one of the
most important factors that determines its dynamic range. I4
and End Br-I-switch have very similar pHhalf and cooperativity.
However, due to the ∼600% greater overall %SC in the Br-I-
switches, it shows a wider regime of pH reporting capacity
from pH 5.3–7.5. Dynamic pH range in which these nano-
devices may be deployed is given in Fig. 4 and obtained as dis-
cussed in the ESI (Fig. S6†). While we are currently unaware of
the structural basis of such high %SC, it is reasonable to
assume that the introduction of substituents on the cytosines
likely distorts the i-motif structure in such a way that the fluo-
rescent dyes are positioned optimally for FRET. Small changes
in interfluorophore distances and the orientation factor can
result in dramatic increases in FRET efficiency.25
The Me-I-
switches were predictably tuned to basic pH regimes by
0.3–0.5 pH units and coupled with the %SC this expands the
sensitivity into mildly basic pH regimes. Interestingly,
5-methylcytosines are also present naturally in CpG islands,
telomeres26
and several heterochromatin regions of human
genome. This finding may open up considerations of possible
structural transitions at such methylated sites harboring mis-
matches in the human genome.
The Br-I-switches on the other hand, showed evidence of
I-motif stabilization both by CD and FRET, except for the End
variant. Halogens such as Br and I are known for their large
size to invoke several inter-atomic contacts and thereby
promote crystallization.27
In the i-motif, the nucleobases of
Fig. 3 (a and b) Donor (D) to FRET acceptor (A) ratio measurements of
dually labelled I-switch assemblies as a function of pH. Normalised ratio
of fluorescence intensities at 520 nm and 669 nm (λex 495 nm) of 50 nM
(a) Br I-switches and (b) Me I-switches in 1× clamping buffer is shown as
a function of pH. All experiments were performed in triplicate at RT and
shown as mean ± standard error of the mean. (c and d) First derivatives
of normalised D/A vs. pH traces for (c) Br I-switches and (d) Me
I-switches. Peak maxima denotes pHhalf.
Table 1 pH response characteristics of all the I-switch variants in this
study
a
Red and blue fonts indicate Br and Me I-switch variants respectively.
b
pHhalf is given by mid point of the normalised D/A vs. pH traces.
c
pHhalf obtained from normalised ellipticity vs. pH traces. d
Fold
change (FC) values obtained from the ratio of the D/A value of the
I-switch variant at pH 4.0 and pH 8.5. e
Numbers indicate Hill slope
obtained from normalised D/A vs. pH trace.
Nanoscale Communication
This journal is © The Royal Society of Chemistry 2015 Nanoscale
Publishedon20May2015.DownloadedbyIndianInstituteofScienceon26/05/201507:23:25.
View Article Online
two duplexes are intercalated leading to a very tightly packed
structure. It is possible that despite the low pKa of the bromo-
cytosines, the bromo moieties could stabilize the i-motif
resulting from hemiprotonated cytosines by simultaneously
invoking a large number of weak contacts.
In summary, we describe the characterization of a family of
I-switches whose pH responsivities have been expanded into
more acidic ranges using 5-bromocytosine and mildly basic
pH using 5-methylcytosines. This was achieved largely due to
a dramatic percentage signal change in this family of
I-switches while maintaining low cooperativity in the pH-
induced transition. The advantage of using low-cooperativity,
high %SC I-switches, is that one can deploy them in biological
scenarios such as screens where there could be large devi-
ations of pH from the expected value. High cooperativity repor-
ters as described by Nesterova et al., are useful when mapping
very subtle pH changes in a given assay with a previously well-
estimated pH. Given the fact that i-motif loop sequence is a
critical determinant in the kinetics of i-motif formation28,29
we
believe that the next challenge for DNA-based pH switches will
be the design of high-sensitivity I-switches that are super-fast
folders to yield pH sensitive nanodevices with fast response
times.
This work was funded by the DBT-Wellcome Trust India
Alliance and the Innovative Young Biotechnologist Award to
Y. K. S. H. thanks the CSIR, GoI for research fellowship. Y. K.
and S. H. thank NCBS for support.
Notes and references
1 (a) Y. Krishnan and F. C. Simmel, Angew. Chem., Int. Ed.,
2011, 50, 3124–3156; (b) Y. Krishnan and M. Bathe, Trends
Cell Biol., 2012, 22, 624–633.
2 K. Gehring, J. L. Leroy and M. Gueron, Nature, 1993, 363,
561–565.
3 T. E. Malliavin, J. Gau, K. Snoussi and J. L. Leroy,
Biophys. J., 2003, 84, 3838–3847.
4 (a) Y. Chen, S. H. Lee and C. Mao, Angew. Chem., Int. Ed.,
2004, 43, 5335–5338; (b) Z. Liu and C. Mao, Chem.
Commun., 2014, 50, 8239–8241; (c) G. Mata and
N. W. Luedtke, J. Am. Chem. Soc., 2015, 137, 699–707.
5 D. Liu, A. Bruckbauer, C. Abell, S. Balasubramanian,
D. J. Kang, D. Klenerman and D. Zhou, J. Am. Chem. Soc.,
2006, 128, 2067–2071.
6 D. Liu and S. Balasubramanian, Angew. Chem., Int. Ed.,
2003, 42, 5734–5736.
7 A. Idili, A. Vallée-Bélisle and F. Ricci, J. Am. Chem. Soc.,
2014, 136, 5836–5839.
8 H. Meng, Y. Yang, Y. Chen, Y. Zhou, Y. Liu, X. Chen, H. Ma,
Z. Tang, D. Liu and L. Jiang, Chem. Commun., 2009, 2293–
2295.
9 (a) S. Modi, C. Nizak, S. Surana, S. Halder and Y. Krishnan,
Nat. Nanotechnol., 2013, 8, 459–467; (b) S. Surana,
J. M. Bhat, S. P. Koushika and Y. Krishnan, Nat. Commun.,
2011, 2, 1–7; (c) S. Modi, M. G. Swetha, D. Goswami,
G. D. Gupta, S. Mayor and Y. Krishnan, Nat. Nanotechnol.,
2009, 4, 325–330.
10 J. L. Mergny, L. Lacroix, X. Han, J. L. Leroy and C. Hélène,
J. Am. Chem. Soc., 1995, 117, 8887–8898.
11 S. Modi, S. Halder, C. Nizak and Y. Krishnan, Nanoscale,
2014, 6, 1144–1152.
12 (a) I. V. Nesterova and E. E. Nesterova, J. Am. Chem. Soc.,
2014, 136, 8843–8846; (b) I. V. Nesterova, S. O. Elsiddieg
and E. E. Nesterova, J. Phys. Chem. B, 2013, 117, 10115–
10121.
13 E. M. Moody and P. C. Bevilacqua, J. Am. Chem. Soc., 2003,
125, 16285–16293.
14 P. Buceka, R. Gargallob and A. Kudrev, Anal. Chim. Acta,
2010, 683, 69–77.
15 J. L. Leroy, M. Gueron, J. L. Mergny and C. Hélène, Nucleic
Acids Res., 1994, 22, 1600–1606.
16 (a) N. K. Sharma and K. N. Ganesh, Chem. Commun., 2005,
4330–4332; (b) B. Datta, M. E. Bier, S. Roy and
B. A. Armitage, J. Am. Chem. Soc., 2005, 127, 4199–4207.
17 (a) A. Pasternak and J. Wengel, Bioorg. Med. Chem. Lett.,
2011, 21, 752–755; (b) Y. Krishnan-Ghosh, E. Stephens and
S. Balasubramanian, J. Am. Chem. Soc., 2004, 126,
5944–5945; (c) Y. Krishnan-Ghosh, Y. A. M. Whitney and
S. Balasubramanian, Chem. Commun., 2005, 3068–3070.
18 (a) T. Kulikowski and D. Shugar, Acta Biochim. Pol., 1979,
26, 145–160; (b) K. Kawai, Y. osakada and T. Majima, Chem-
PhysChem, 2009, 10, 1766–1769.
19 N. Kumar, M. Petersen and S. Maiti, Chem. Commun., 2009,
1532–1534.
Fig. 4 pH tuning of the various I-switches. Dynamic range (10%–90%
of total signal change) based on fluorescent studies of – (a) Br modified
switches compared with native (I4) switch and (b) Me modified switches
compared with native (I7) switch. The colour of the boxes indicate the
position of the modification in the I-switches as described in Fig. 1(c).
Communication Nanoscale
Nanoscale This journal is © The Royal Society of Chemistry 2015
Publishedon20May2015.DownloadedbyIndianInstituteofScienceon26/05/201507:23:25.
View Article Online
20 R. Z. Jin, K. J. Breslauer, R. A. Jones and B. L. Gaffney,
Science, 1990, 250, 543–546.
21 E. L. Edwards, M. H. Patrick, R. L. Ratliff and D. M. Gray,
Biochemistry, 1990, 29, 828–836.
22 H. Kanehara, M. Mizuguchi, K. Tajima, K. Kanaori and
K. Makino, Biochemistry, 1997, 36, 1790–1797.
23 M. Kaushik, N. Suehl and L. A. Marky, Biophys. Chem.,
2007, 126, 154–164.
24 M. M. Dailey, M. C. Miller, P. J. Bates, A. N. Lane and
J. O. Trent, Nucleic Acids Res., 2010, 38, 4877–4888.
25 (a) T. Fessl and D. M. J. Lilley, Biophys. J., 2013, 105, 2175–
2181; (b) A. Iqbal, S. Arslan, B. Okumus, T. J. Wilson,
G. Giraud, D. G. Norman, T. Ha and D. M. J. Lilley, Proc.
Natl. Acad. Sci. U. S. A., 2008, 105, 11176–11181.
26 A. T. Phan and J. L. Mergny, Nucleic Acids Res., 2002, 30,
4618–4625.
27 (a) D. S. Reddy, D. C. Craig and G. R. Desiraju, J. Am. Chem.
Soc., 1996, 118, 4090–4093; (b) C. M. Reddy, M. T. Kirchner,
R. C. Gundakaram, K. A. Padmanabhan and G. R. Desiraju,
Chem. – Eur. J., 2006, 12, 2222–2234; (c) V. R. Pedireddi,
D. S. Reddy, B. S. Goud, D. C. Craig, A. D. Rae and
G. R. Desiraju, J. Chem. Soc., Perkin Trans. 2, 1994, 2, 2353–
2360.
28 A. L. Lieblein, B. Furtig and H. Schwalbe, ChemBioChem,
2013, 14, 1226–1230.
29 S. P. Gurung, C. Schwarz, J. P. Hall, C. J. Cardin and
J. A. Brazier, Chem. Commun., 2015, DOI: 10.1039/
c4cc07279k.
Nanoscale Communication
This journal is © The Royal Society of Chemistry 2015 Nanoscale
Publishedon20May2015.DownloadedbyIndianInstituteofScienceon26/05/201507:23:25.
View Article Online

More Related Content

What's hot

enzyme kinetics, mechanism of action of enzymes and line-weaver burk plot
enzyme kinetics, mechanism of action of enzymes and line-weaver burk plotenzyme kinetics, mechanism of action of enzymes and line-weaver burk plot
enzyme kinetics, mechanism of action of enzymes and line-weaver burk plotmuti ullah
 
JMC 1996 39 4531LactamSulf
JMC 1996 39 4531LactamSulfJMC 1996 39 4531LactamSulf
JMC 1996 39 4531LactamSulfJ. Edward Semple
 
Deuteration presentation
Deuteration presentationDeuteration presentation
Deuteration presentationNicholas Gammon
 
SIMONA CAVALU_Raman and Surface Enhanced Raman Spectroscopy of 2,2,5,5-Tetram...
SIMONA CAVALU_Raman and Surface Enhanced Raman Spectroscopy of 2,2,5,5-Tetram...SIMONA CAVALU_Raman and Surface Enhanced Raman Spectroscopy of 2,2,5,5-Tetram...
SIMONA CAVALU_Raman and Surface Enhanced Raman Spectroscopy of 2,2,5,5-Tetram...Simona Cavalu
 
5276 5280.output
5276 5280.output5276 5280.output
5276 5280.outputj1075017
 
Raft polymeristion of sma
Raft polymeristion of smaRaft polymeristion of sma
Raft polymeristion of smaFaiqueS
 
A Fluorescent Probe Designed For Conformational Studies
A Fluorescent Probe Designed For Conformational StudiesA Fluorescent Probe Designed For Conformational Studies
A Fluorescent Probe Designed For Conformational Studiessubbu2681
 
Sty mah raft
Sty mah raftSty mah raft
Sty mah raftFaiqueS
 
Studies of transition metal ion - 5- Sulphosalicylic acid doped Polyanilines
Studies of transition metal ion - 5- Sulphosalicylic acid doped PolyanilinesStudies of transition metal ion - 5- Sulphosalicylic acid doped Polyanilines
Studies of transition metal ion - 5- Sulphosalicylic acid doped PolyanilinesIOSR Journals
 
Nucleosides JOC01-2789-Harry
Nucleosides JOC01-2789-HarryNucleosides JOC01-2789-Harry
Nucleosides JOC01-2789-HarryHarry An
 
Guided inquiry analysis the use of ft nmr of curcumin
Guided inquiry analysis the use of ft nmr of curcuminGuided inquiry analysis the use of ft nmr of curcumin
Guided inquiry analysis the use of ft nmr of curcuminDr Robert Craig PhD
 
BT631-27-Membrane_proteins
BT631-27-Membrane_proteinsBT631-27-Membrane_proteins
BT631-27-Membrane_proteinsRajesh G
 
Photocatalytic reduction of carbon dioxide to methanol using a ruthenium trin...
Photocatalytic reduction of carbon dioxide to methanol using a ruthenium trin...Photocatalytic reduction of carbon dioxide to methanol using a ruthenium trin...
Photocatalytic reduction of carbon dioxide to methanol using a ruthenium trin...Pawan Kumar
 

What's hot (20)

Kieran_ccpNMR
Kieran_ccpNMRKieran_ccpNMR
Kieran_ccpNMR
 
MMRIResearch
MMRIResearchMMRIResearch
MMRIResearch
 
enzyme kinetics, mechanism of action of enzymes and line-weaver burk plot
enzyme kinetics, mechanism of action of enzymes and line-weaver burk plotenzyme kinetics, mechanism of action of enzymes and line-weaver burk plot
enzyme kinetics, mechanism of action of enzymes and line-weaver burk plot
 
JMC 1996 39 4531LactamSulf
JMC 1996 39 4531LactamSulfJMC 1996 39 4531LactamSulf
JMC 1996 39 4531LactamSulf
 
Deuteration presentation
Deuteration presentationDeuteration presentation
Deuteration presentation
 
Final Presentation
Final PresentationFinal Presentation
Final Presentation
 
SIMONA CAVALU_Raman and Surface Enhanced Raman Spectroscopy of 2,2,5,5-Tetram...
SIMONA CAVALU_Raman and Surface Enhanced Raman Spectroscopy of 2,2,5,5-Tetram...SIMONA CAVALU_Raman and Surface Enhanced Raman Spectroscopy of 2,2,5,5-Tetram...
SIMONA CAVALU_Raman and Surface Enhanced Raman Spectroscopy of 2,2,5,5-Tetram...
 
CPsarakis REU Final Paper
CPsarakis REU Final PaperCPsarakis REU Final Paper
CPsarakis REU Final Paper
 
5276 5280.output
5276 5280.output5276 5280.output
5276 5280.output
 
Raft polymeristion of sma
Raft polymeristion of smaRaft polymeristion of sma
Raft polymeristion of sma
 
A Fluorescent Probe Designed For Conformational Studies
A Fluorescent Probe Designed For Conformational StudiesA Fluorescent Probe Designed For Conformational Studies
A Fluorescent Probe Designed For Conformational Studies
 
TYC
TYCTYC
TYC
 
Sty mah raft
Sty mah raftSty mah raft
Sty mah raft
 
Studies of transition metal ion - 5- Sulphosalicylic acid doped Polyanilines
Studies of transition metal ion - 5- Sulphosalicylic acid doped PolyanilinesStudies of transition metal ion - 5- Sulphosalicylic acid doped Polyanilines
Studies of transition metal ion - 5- Sulphosalicylic acid doped Polyanilines
 
Srep31295
Srep31295Srep31295
Srep31295
 
1 s2.0-s2211285516301124-main
1 s2.0-s2211285516301124-main1 s2.0-s2211285516301124-main
1 s2.0-s2211285516301124-main
 
Nucleosides JOC01-2789-Harry
Nucleosides JOC01-2789-HarryNucleosides JOC01-2789-Harry
Nucleosides JOC01-2789-Harry
 
Guided inquiry analysis the use of ft nmr of curcumin
Guided inquiry analysis the use of ft nmr of curcuminGuided inquiry analysis the use of ft nmr of curcumin
Guided inquiry analysis the use of ft nmr of curcumin
 
BT631-27-Membrane_proteins
BT631-27-Membrane_proteinsBT631-27-Membrane_proteins
BT631-27-Membrane_proteins
 
Photocatalytic reduction of carbon dioxide to methanol using a ruthenium trin...
Photocatalytic reduction of carbon dioxide to methanol using a ruthenium trin...Photocatalytic reduction of carbon dioxide to methanol using a ruthenium trin...
Photocatalytic reduction of carbon dioxide to methanol using a ruthenium trin...
 

Viewers also liked

CUC2010: Linux datotecni sustavi
CUC2010: Linux datotecni sustaviCUC2010: Linux datotecni sustavi
CUC2010: Linux datotecni sustaviDinko Korunic
 
음표배우자10
음표배우자10음표배우자10
음표배우자10moonjunu
 
Recombinant antibody mediated delivery of organelle-specific DNA pH sensors a...
Recombinant antibody mediated delivery of organelle-specific DNA pH sensors a...Recombinant antibody mediated delivery of organelle-specific DNA pH sensors a...
Recombinant antibody mediated delivery of organelle-specific DNA pH sensors a...saheli halder
 
A pH-independent DNA nanodevice for quantifying chloride transport in organel...
A pH-independent DNA nanodevice for quantifying chloride transport in organel...A pH-independent DNA nanodevice for quantifying chloride transport in organel...
A pH-independent DNA nanodevice for quantifying chloride transport in organel...saheli halder
 
마리오 런 시즌 2
마리오 런 시즌 2마리오 런 시즌 2
마리오 런 시즌 2moonjunu
 
Classroom Technology
Classroom TechnologyClassroom Technology
Classroom TechnologyNicole Simone
 
Scheda tecnica-agevolazioni superammortamento f
Scheda tecnica-agevolazioni superammortamento fScheda tecnica-agevolazioni superammortamento f
Scheda tecnica-agevolazioni superammortamento fRoberto Lenzi
 
tuning the pH Response of i-Motif DNA Oligonucleotides_Lannes_et_al-2015-Chem...
tuning the pH Response of i-Motif DNA Oligonucleotides_Lannes_et_al-2015-Chem...tuning the pH Response of i-Motif DNA Oligonucleotides_Lannes_et_al-2015-Chem...
tuning the pH Response of i-Motif DNA Oligonucleotides_Lannes_et_al-2015-Chem...saheli halder
 
Primeros auxilios lesiones de piel
Primeros auxilios lesiones de pielPrimeros auxilios lesiones de piel
Primeros auxilios lesiones de pieljerehemysebastian
 

Viewers also liked (16)

CUC2010: Linux datotecni sustavi
CUC2010: Linux datotecni sustaviCUC2010: Linux datotecni sustavi
CUC2010: Linux datotecni sustavi
 
Colo colo
Colo coloColo colo
Colo colo
 
Flash dance
Flash danceFlash dance
Flash dance
 
음표배우자10
음표배우자10음표배우자10
음표배우자10
 
Recombinant antibody mediated delivery of organelle-specific DNA pH sensors a...
Recombinant antibody mediated delivery of organelle-specific DNA pH sensors a...Recombinant antibody mediated delivery of organelle-specific DNA pH sensors a...
Recombinant antibody mediated delivery of organelle-specific DNA pH sensors a...
 
A pH-independent DNA nanodevice for quantifying chloride transport in organel...
A pH-independent DNA nanodevice for quantifying chloride transport in organel...A pH-independent DNA nanodevice for quantifying chloride transport in organel...
A pH-independent DNA nanodevice for quantifying chloride transport in organel...
 
마리오 런 시즌 2
마리오 런 시즌 2마리오 런 시즌 2
마리오 런 시즌 2
 
Rickelm Resume 2016
Rickelm Resume 2016Rickelm Resume 2016
Rickelm Resume 2016
 
Classroom Technology
Classroom TechnologyClassroom Technology
Classroom Technology
 
Presentation_NEW.PPTX
Presentation_NEW.PPTXPresentation_NEW.PPTX
Presentation_NEW.PPTX
 
Scheda tecnica-agevolazioni superammortamento f
Scheda tecnica-agevolazioni superammortamento fScheda tecnica-agevolazioni superammortamento f
Scheda tecnica-agevolazioni superammortamento f
 
tuning the pH Response of i-Motif DNA Oligonucleotides_Lannes_et_al-2015-Chem...
tuning the pH Response of i-Motif DNA Oligonucleotides_Lannes_et_al-2015-Chem...tuning the pH Response of i-Motif DNA Oligonucleotides_Lannes_et_al-2015-Chem...
tuning the pH Response of i-Motif DNA Oligonucleotides_Lannes_et_al-2015-Chem...
 
Tutela particulares
Tutela particularesTutela particulares
Tutela particulares
 
Compositions
CompositionsCompositions
Compositions
 
Primeros auxilios lesiones de piel
Primeros auxilios lesiones de pielPrimeros auxilios lesiones de piel
Primeros auxilios lesiones de piel
 
Harish resume
Harish resumeHarish resume
Harish resume
 

Similar to Design of Ultrasensitive Fluorescent pH Sensors with Expanded Range (5.3-7.5

Smith_ProteinScience_2013
Smith_ProteinScience_2013Smith_ProteinScience_2013
Smith_ProteinScience_2013Austin Smith
 
Bis-pyrene probes of foldamer conformation in solution and in phospholipid bi...
Bis-pyrene probes of foldamer conformation in solution and in phospholipid bi...Bis-pyrene probes of foldamer conformation in solution and in phospholipid bi...
Bis-pyrene probes of foldamer conformation in solution and in phospholipid bi...madhu740653
 
Mechanism of the Reaction of Plasma Albumin with Formaldehyde in Ethanol - Wa...
Mechanism of the Reaction of Plasma Albumin with Formaldehyde in Ethanol - Wa...Mechanism of the Reaction of Plasma Albumin with Formaldehyde in Ethanol - Wa...
Mechanism of the Reaction of Plasma Albumin with Formaldehyde in Ethanol - Wa...IOSR Journals
 
Comparing the Effects of Different Osmolytes in the B-to-Z DNA Transition
Comparing the Effects of Different Osmolytes in the B-to-Z DNA TransitionComparing the Effects of Different Osmolytes in the B-to-Z DNA Transition
Comparing the Effects of Different Osmolytes in the B-to-Z DNA TransitionCharlotte C
 
Lab 3 acid base titration curves and acid_base indicators
Lab 3 acid base titration curves and acid_base indicatorsLab 3 acid base titration curves and acid_base indicators
Lab 3 acid base titration curves and acid_base indicatorsAnas Maghayreh
 
SIMONA CAVALU_EPR study of non covalent spin labeled serum albumin and haemog...
SIMONA CAVALU_EPR study of non covalent spin labeled serum albumin and haemog...SIMONA CAVALU_EPR study of non covalent spin labeled serum albumin and haemog...
SIMONA CAVALU_EPR study of non covalent spin labeled serum albumin and haemog...Simona Cavalu
 
JOC-Liu-1987
JOC-Liu-1987JOC-Liu-1987
JOC-Liu-1987Paul Liu
 
JOC-Liu-1987
JOC-Liu-1987JOC-Liu-1987
JOC-Liu-1987Paul Liu
 
Proton euilibria in minor groove of dna
Proton euilibria in minor groove of dnaProton euilibria in minor groove of dna
Proton euilibria in minor groove of dnamganguly123
 
thesis body final
thesis body finalthesis body final
thesis body finalKane Logue
 
Dissecting NOS electronics_Biochem J 2013
Dissecting NOS electronics_Biochem J 2013Dissecting NOS electronics_Biochem J 2013
Dissecting NOS electronics_Biochem J 2013Luciana Hannibal, Ph.D.
 
Test of δ- MnO2 Reactivity with Good'sBuffers
Test of δ- MnO2 Reactivity with Good'sBuffersTest of δ- MnO2 Reactivity with Good'sBuffers
Test of δ- MnO2 Reactivity with Good'sBuffersApollo Yue Nung Lin
 

Similar to Design of Ultrasensitive Fluorescent pH Sensors with Expanded Range (5.3-7.5 (20)

Smith_ProteinScience_2013
Smith_ProteinScience_2013Smith_ProteinScience_2013
Smith_ProteinScience_2013
 
Pielak_JACS
Pielak_JACSPielak_JACS
Pielak_JACS
 
3. Acridine
3. Acridine3. Acridine
3. Acridine
 
Smith_ProSci_2105
Smith_ProSci_2105Smith_ProSci_2105
Smith_ProSci_2105
 
URECA_application_final_draft
URECA_application_final_draftURECA_application_final_draft
URECA_application_final_draft
 
Bis-pyrene probes of foldamer conformation in solution and in phospholipid bi...
Bis-pyrene probes of foldamer conformation in solution and in phospholipid bi...Bis-pyrene probes of foldamer conformation in solution and in phospholipid bi...
Bis-pyrene probes of foldamer conformation in solution and in phospholipid bi...
 
Mechanism of the Reaction of Plasma Albumin with Formaldehyde in Ethanol - Wa...
Mechanism of the Reaction of Plasma Albumin with Formaldehyde in Ethanol - Wa...Mechanism of the Reaction of Plasma Albumin with Formaldehyde in Ethanol - Wa...
Mechanism of the Reaction of Plasma Albumin with Formaldehyde in Ethanol - Wa...
 
Comparing the Effects of Different Osmolytes in the B-to-Z DNA Transition
Comparing the Effects of Different Osmolytes in the B-to-Z DNA TransitionComparing the Effects of Different Osmolytes in the B-to-Z DNA Transition
Comparing the Effects of Different Osmolytes in the B-to-Z DNA Transition
 
Dsc peptide
Dsc peptideDsc peptide
Dsc peptide
 
om300167u
om300167uom300167u
om300167u
 
Lab 3 acid base titration curves and acid_base indicators
Lab 3 acid base titration curves and acid_base indicatorsLab 3 acid base titration curves and acid_base indicators
Lab 3 acid base titration curves and acid_base indicators
 
SIMONA CAVALU_EPR study of non covalent spin labeled serum albumin and haemog...
SIMONA CAVALU_EPR study of non covalent spin labeled serum albumin and haemog...SIMONA CAVALU_EPR study of non covalent spin labeled serum albumin and haemog...
SIMONA CAVALU_EPR study of non covalent spin labeled serum albumin and haemog...
 
JOC-Liu-1987
JOC-Liu-1987JOC-Liu-1987
JOC-Liu-1987
 
JOC-Liu-1987
JOC-Liu-1987JOC-Liu-1987
JOC-Liu-1987
 
Wardle let dds_2009
Wardle let dds_2009Wardle let dds_2009
Wardle let dds_2009
 
Proton euilibria in minor groove of dna
Proton euilibria in minor groove of dnaProton euilibria in minor groove of dna
Proton euilibria in minor groove of dna
 
thesis body final
thesis body finalthesis body final
thesis body final
 
pHLIP Poster
pHLIP PosterpHLIP Poster
pHLIP Poster
 
Dissecting NOS electronics_Biochem J 2013
Dissecting NOS electronics_Biochem J 2013Dissecting NOS electronics_Biochem J 2013
Dissecting NOS electronics_Biochem J 2013
 
Test of δ- MnO2 Reactivity with Good'sBuffers
Test of δ- MnO2 Reactivity with Good'sBuffersTest of δ- MnO2 Reactivity with Good'sBuffers
Test of δ- MnO2 Reactivity with Good'sBuffers
 

Design of Ultrasensitive Fluorescent pH Sensors with Expanded Range (5.3-7.5

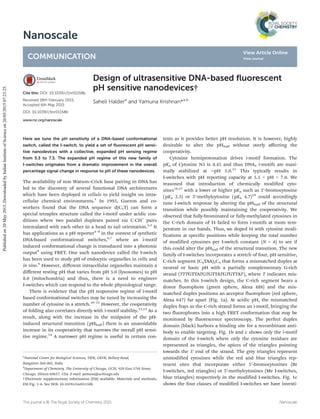
  • 1. Nanoscale COMMUNICATION Cite this: DOI: 10.1039/c5nr01158b Received 18th February 2015, Accepted 6th May 2015 DOI: 10.1039/c5nr01158b www.rsc.org/nanoscale Design of ultrasensitive DNA-based fluorescent pH sensitive nanodevices† Saheli Haldera and Yamuna Krishnan*a,b Here we tune the pH sensitivity of a DNA-based conformational switch, called the I-switch, to yield a set of fluorescent pH sensi- tive nanodevices with a collective, expanded pH sensing regime from 5.3 to 7.5. The expanded pH regime of this new family of I-switches originates from a dramatic improvement in the overall percentage signal change in response to pH of these nanodevices. The availability of non Watson–Crick base pairing in DNA has led to the discovery of several functional DNA architectures which have been deployed in cellulo to yield insight on intra- cellular chemical environments.1 In 1993, Gueron and co- workers found that the DNA sequence d(C5T) can form a special tetraplex structure called the i-motif under acidic con- ditions where two parallel duplexes paired via C·CH+ pairs intercalated with each other in a head to tail orientation.2,3 It has applications as a pH reporter4–9 in the context of synthetic DNA-based conformational switches,6,7 where an i-motif induced conformational change is transduced into a photonic output8 using FRET. One such nanodevice called the I-switch has been used to study pH of endocytic organelles in cells and in vivo.9 However, different intracellular organelles maintain a different resting pH that varies from pH 5.0 (lysosomes) to pH 8.0 (mitochondria) and thus, there is a need to engineer I-switches which can respond to the whole physiological range. There is evidence that the pH responsive regime of i-motif based conformational switches may be tuned by increasing the number of cytosine in a stretch.10–12 However, the cooperativity of folding also correlates directly with i-motif stability.13,14 As a result, along with the increase in the midpoint of the pH- induced structural transition (pHhalf ) there is an unavoidable increase in its cooperativity that narrows the overall pH sensi- tive regime.14 A narrower pH regime is useful in certain con- texts as it provides better pH resolution. It is however, highly desirable to alter the pHhalf without overly affecting the cooperativity. Cytosine hemiprotonation drives i-motif formation. The pKa of Cytosine N3 is 4.45 and thus DNA4 i-motifs are maxi- mally stabilized at ∼pH 5.0.15 This typically results in I-switches with pH reporting capacity at 5.5 < pH < 7.0. We reasoned that introduction of chemically modified cyto- sines16,17 with a lower or higher pKa such as 5′-bromocytosine (pKa 2.5) or 5′-methylcytosine (pKa 4.7)18 could accordingly tune I-switch response by altering the pHhalf of the structural transition while possibly maintaining the cooperativity. We observed that fully-brominated or fully-methylated cytosines in the C-rich domain of I4 failed to form i-motifs at room tem- perature in our hands. Thus, we doped I4 with cytosine modi- fications at specific positions while keeping the total number of modified cytosines per I-switch constant (N = 4) to see if this could alter the pHhalf of the structural transition. The new family of I-switches incorporates a stretch of four, pH sensitive, C-rich segment (C4TAA)3C4 that forms a mismatched duplex at neutral or basic pH with a partially complementary G-rich strand (TTTGTTATGTGTTATGTGTTAT), where T indicates mis- matches. In this I-switch design, the C-rich segment bears a donor fluorophore (green sphere, Alexa 488) and the mis- matched duplex positions an acceptor fluorophore (red sphere, Alexa 647) far apart (Fig. 1a). At acidic pH, the mismatched duplex frays as the C-rich strand forms an i-motif, bringing the two fluorophores into a high FRET conformation that may be monitored by fluorescence spectroscopy. The perfect duplex domain (black) harbors a binding site for a recombinant anti- body to enable targeting. Fig. 1b and c shows only the i-motif domain of the I-switch where only the cytosine residues are represented as triangles, the apices of the triangles pointing towards the 3′ end of the strand. The grey triangles represent unmodified cytosines while the red and blue triangles rep- resent sites that incorporate either 5′-bromocytosines (Br I-switches, red triangles) or 5′-methylcytosines (Me I-switches, blue triangles) respectively in the modified I-switches. Fig. 1c shows the four classes of modified I-switches we have investi- †Electronic supplementary information (ESI) available: Materials and methods, ESI Fig. 1–6. See DOI: 10.1039/c5nr01158b a National Centre for Biological Sciences, TIFR, GKVK, Bellary Road, Bangalore 560 065, India b Department of Chemistry, The University of Chicago, GCIS, 929 East 57th Street, Chicago, Illinois 60637, USA. E-mail: yamuna@uchicago.edu This journal is © The Royal Society of Chemistry 2015 Nanoscale Publishedon20May2015.DownloadedbyIndianInstituteofScienceon26/05/201507:23:25. View Article Online View Journal
  • 2. gated categorized on the basis of the relative positions of the modified cytosines in the i-motif domain of the I-switch. The first class incorporates either two all-bromo or two all-methyl modified Cm–H+ –Cm base pairs at positions 3, 9, 17, 23 that lie at the core of the resultant i-motif (Core) with the reasoning that these could possibly affect the nucleation event for i-motif formation. The second class incorporates either two all-bromo or two all-methyl modifications at the peripheral Cm–H+ –Cm base pairs at positions 1, 11, 15, 25 (End) with the reasoning that these could modulate i-motif fraying and thereby stability to possibly shift the pH responsive regime.19 In the Core and End designs, the i-motifs have two modified Cm–H+ –Cm base- pairs on adjacent stacks. We therefore sought to modulate pH of responsivity differently by interspersing two modified Cm– H+ –Cm base pairs between unmodified C–H+ –C base pairs. We therefore introduced modifications at positions 15, 17, 23, 25 to yield the Interspersed variant shown in Fig. 1c. All these var- iants have two all-bromo or all-methyl modified Cm–H+ –Cm base-pairs in different topologies. We then sought to modulate pHhalf by instead incorporating four hemi-modified Cm–H+ –C base pairs, by modifying only one of the participating cyto- sines of a C–H+ –C base pair. We did this by introducing modi- fications on four consecutive cytosines at positions 1, 2, 3, 4 at the 5′ end (Consecutive). First, we confirmed formation of i-motifs at acidic pH by the C-rich domains of all the I-switch variants used in this study. This was done by monitoring the difference in Circular Dichroism (CD) spectra between pH 5.0 and pH 8.5 from 220 nm–320 nm (Fig. S2†). The difference spectra of pH 5.0 and pH 8.5 showed a positive band centered around 292 nm, and a negative band centered around 260 nm.20 This is the characteristic CD signature of i-motif structure that is held together by C–H+ –C base pairs21–23 This was further confirmed by CD spectroscopy at as a function of pH of all the new I-switches (Br I-switches and Me I-switches) (Fig. 2a and b). The change in molar ellipticity at 292 nm, where the C–H+ –C basepairs are known to absorb maximally was plotted as a function of pH. For uniformity, molar ellipticity of all I-switches was normalised from 0 to 1. As the pH increases, the structural transition from i-motif structure to duplex DNA occurs, hence, positive band at 292 nm decreases sigmoidally due to the decrease in C–H+ –C base pairs reflecting the pH induced denaturation of the i-motif. The different Br modified switches namely Interspersed, Core, End and Consecutive showed a pHhalf of structural transition at pH 6.6 ± 0.2, 7.3 ± 0.2, 6.2 ± 0.2 and 6.8 ± 0.1 respectively. The different Me modi- fied switches namely Interspersed, Core, End and Consecutive showed pHhalf at pH 6.8 ± 0.2, 7.0 ± 0.3, 6.9 ± 0.2 and 7.0 ± 0.2 respectively. Bearing in mind that I4 showed a pHhalf at pH 6.6 ± 0.2 and the pKa of 5 methyl Cytosine is only 0.2 pH units higher than cytosine, this indicates that the Me-I-switches have been tuned according to the expectation, i.e., 0.3–0.5 pH units higher. The End variant of the Br-I switch was tuned only to 0.4 pH units lower. However, this is the only Br-I-switches, that was tuned in the right direction, and this point is dis- cussed later. Nevertheless these modest changes in pHhalf of the modified switches informed us that i-motif induced struc- tural transitions were indeed confirmed in these assemblies before one proceeded to FRET reporters of the transition.24 To investigate the capability and performance of these modified I-switches as pH reporters we proceeded to investi- gate the pH-induced transition by fluorescence resonance energy transfer (FRET) using I-switch variants bearing donor Fig. 1 Schematic representation of the working principle of the I-switch and its various modifications. (a) Working principle of the I-switch; C-rich domain, donor and acceptor fluorophores are shown in grey, green and red respectively. (b) Schematic of i-motif formed in I-switches. Cytosine (grey triangles) modified cytosines (coloured tri- angles) positions are indicated. Triangle apices point towards the 3’ strand terminus. (c) I-switch variants incorporating modified cytosines used in this study. Fig. 2 In vitro characterisation of all I-switch variants. (a and b) Norma- lised ellipticity (Θ) at 292 nm of 1 µM native (I4) and (a) 5’-bromocytosine modified (Br I-switches) I-switches (b) 5’-methylcytosine modified (Me I-switches) in 1× clamping buffer is shown as a function of pH. All experiments were performed in duplicate at RT and shown as mean ± standard error of the mean. Communication Nanoscale Nanoscale This journal is © The Royal Society of Chemistry 2015 Publishedon20May2015.DownloadedbyIndianInstituteofScienceon26/05/201507:23:25. View Article Online
  • 3. and acceptor fluorophores as shown in Fig. 1. At basic pH the labels are held far apart by a mismatched duplex showing low FRET and high D/A values, while at acidic pH the i-motif domains shorten the distances between the two fluorophores showing high FRET and consequently low D/A values. The dually labeled I-switch variants (1× clamping buffer of desired pH, 120 mM KCl, 5 mM NaCl, 20 mM HEPES, 1 mM CaCl2 and 1 mM MgCl2) were excited at 495 nm and emission spectra were collected from 505 nm to 725 nm. Emission intensity at 520 nm from Alexa 488 (D) was divided by emis- sion intensity at 669 nm from Alexa 647 (A) to obtain D/A ratios at various pH which was then normalised to pH 4.0 and plotted as a function of pH (Fig. 3a and b). This gives the characteristic pH responsive regime and pH sensitivity of the given I-switch variant. The change in D/A ratios was a result of both decrease in Alexa 488 intensity and increase in the Alexa 647 intensity due to FRET (Fig. S3†) yielding a characteristic sigmoidal curve. The Me I-switch variants Interspersed, Core, End and Con- secutive all showed FRET pHhalf values that were in fairly good correspondence with their CD pHhalf values (Table 1). This was also the case with all the Br I-switches except the Core variant. This variant showed pHhalf of 6.1 ± 0.1, in large discrepancy with the CD transition, but showed an overall shift of pH sensi- tivity in the expected direction. CD and FRET measure different parameters associated with the transition and it is not unusual to find discrepancies in pHhalf between the two methods. The success in this strategy of tuning using nucleo- base pKa is evident from the derivatives of the D/A vs. pH traces (Fig. 3c and d). When the number of cytosines increases from I4 to I7, although the pHhalf of I7 changes to 7.03, the cooperativity increases to 6.3 and its pH responsive regime spans 0.5 pH units from Fig. 3d and Table 1. The Core Me-I- switch whose pHhalf has been tuned to 7.1, with a cooperativity of only 3.3 (Table 1) spans a pH sensitive regime of 1.0 pH units. The most notable feature of this new family of I-switches, which was unpredicted, was the phenomenal fold change in D/A ratio between the closed and open states. The overall per- centage of signal change (%SC) of each of these variants dra- matically increased ranging from 770% (Core Br I-switch) to 1400% (End Me-I-switch). %SC of any reporter is one of the most important factors that determines its dynamic range. I4 and End Br-I-switch have very similar pHhalf and cooperativity. However, due to the ∼600% greater overall %SC in the Br-I- switches, it shows a wider regime of pH reporting capacity from pH 5.3–7.5. Dynamic pH range in which these nano- devices may be deployed is given in Fig. 4 and obtained as dis- cussed in the ESI (Fig. S6†). While we are currently unaware of the structural basis of such high %SC, it is reasonable to assume that the introduction of substituents on the cytosines likely distorts the i-motif structure in such a way that the fluo- rescent dyes are positioned optimally for FRET. Small changes in interfluorophore distances and the orientation factor can result in dramatic increases in FRET efficiency.25 The Me-I- switches were predictably tuned to basic pH regimes by 0.3–0.5 pH units and coupled with the %SC this expands the sensitivity into mildly basic pH regimes. Interestingly, 5-methylcytosines are also present naturally in CpG islands, telomeres26 and several heterochromatin regions of human genome. This finding may open up considerations of possible structural transitions at such methylated sites harboring mis- matches in the human genome. The Br-I-switches on the other hand, showed evidence of I-motif stabilization both by CD and FRET, except for the End variant. Halogens such as Br and I are known for their large size to invoke several inter-atomic contacts and thereby promote crystallization.27 In the i-motif, the nucleobases of Fig. 3 (a and b) Donor (D) to FRET acceptor (A) ratio measurements of dually labelled I-switch assemblies as a function of pH. Normalised ratio of fluorescence intensities at 520 nm and 669 nm (λex 495 nm) of 50 nM (a) Br I-switches and (b) Me I-switches in 1× clamping buffer is shown as a function of pH. All experiments were performed in triplicate at RT and shown as mean ± standard error of the mean. (c and d) First derivatives of normalised D/A vs. pH traces for (c) Br I-switches and (d) Me I-switches. Peak maxima denotes pHhalf. Table 1 pH response characteristics of all the I-switch variants in this study a Red and blue fonts indicate Br and Me I-switch variants respectively. b pHhalf is given by mid point of the normalised D/A vs. pH traces. c pHhalf obtained from normalised ellipticity vs. pH traces. d Fold change (FC) values obtained from the ratio of the D/A value of the I-switch variant at pH 4.0 and pH 8.5. e Numbers indicate Hill slope obtained from normalised D/A vs. pH trace. Nanoscale Communication This journal is © The Royal Society of Chemistry 2015 Nanoscale Publishedon20May2015.DownloadedbyIndianInstituteofScienceon26/05/201507:23:25. View Article Online
  • 4. two duplexes are intercalated leading to a very tightly packed structure. It is possible that despite the low pKa of the bromo- cytosines, the bromo moieties could stabilize the i-motif resulting from hemiprotonated cytosines by simultaneously invoking a large number of weak contacts. In summary, we describe the characterization of a family of I-switches whose pH responsivities have been expanded into more acidic ranges using 5-bromocytosine and mildly basic pH using 5-methylcytosines. This was achieved largely due to a dramatic percentage signal change in this family of I-switches while maintaining low cooperativity in the pH- induced transition. The advantage of using low-cooperativity, high %SC I-switches, is that one can deploy them in biological scenarios such as screens where there could be large devi- ations of pH from the expected value. High cooperativity repor- ters as described by Nesterova et al., are useful when mapping very subtle pH changes in a given assay with a previously well- estimated pH. Given the fact that i-motif loop sequence is a critical determinant in the kinetics of i-motif formation28,29 we believe that the next challenge for DNA-based pH switches will be the design of high-sensitivity I-switches that are super-fast folders to yield pH sensitive nanodevices with fast response times. This work was funded by the DBT-Wellcome Trust India Alliance and the Innovative Young Biotechnologist Award to Y. K. S. H. thanks the CSIR, GoI for research fellowship. Y. K. and S. H. thank NCBS for support. Notes and references 1 (a) Y. Krishnan and F. C. Simmel, Angew. Chem., Int. Ed., 2011, 50, 3124–3156; (b) Y. Krishnan and M. Bathe, Trends Cell Biol., 2012, 22, 624–633. 2 K. Gehring, J. L. Leroy and M. Gueron, Nature, 1993, 363, 561–565. 3 T. E. Malliavin, J. Gau, K. Snoussi and J. L. Leroy, Biophys. J., 2003, 84, 3838–3847. 4 (a) Y. Chen, S. H. Lee and C. Mao, Angew. Chem., Int. Ed., 2004, 43, 5335–5338; (b) Z. Liu and C. Mao, Chem. Commun., 2014, 50, 8239–8241; (c) G. Mata and N. W. Luedtke, J. Am. Chem. Soc., 2015, 137, 699–707. 5 D. Liu, A. Bruckbauer, C. Abell, S. Balasubramanian, D. J. Kang, D. Klenerman and D. Zhou, J. Am. Chem. Soc., 2006, 128, 2067–2071. 6 D. Liu and S. Balasubramanian, Angew. Chem., Int. Ed., 2003, 42, 5734–5736. 7 A. Idili, A. Vallée-Bélisle and F. Ricci, J. Am. Chem. Soc., 2014, 136, 5836–5839. 8 H. Meng, Y. Yang, Y. Chen, Y. Zhou, Y. Liu, X. Chen, H. Ma, Z. Tang, D. Liu and L. Jiang, Chem. Commun., 2009, 2293– 2295. 9 (a) S. Modi, C. Nizak, S. Surana, S. Halder and Y. Krishnan, Nat. Nanotechnol., 2013, 8, 459–467; (b) S. Surana, J. M. Bhat, S. P. Koushika and Y. Krishnan, Nat. Commun., 2011, 2, 1–7; (c) S. Modi, M. G. Swetha, D. Goswami, G. D. Gupta, S. Mayor and Y. Krishnan, Nat. Nanotechnol., 2009, 4, 325–330. 10 J. L. Mergny, L. Lacroix, X. Han, J. L. Leroy and C. Hélène, J. Am. Chem. Soc., 1995, 117, 8887–8898. 11 S. Modi, S. Halder, C. Nizak and Y. Krishnan, Nanoscale, 2014, 6, 1144–1152. 12 (a) I. V. Nesterova and E. E. Nesterova, J. Am. Chem. Soc., 2014, 136, 8843–8846; (b) I. V. Nesterova, S. O. Elsiddieg and E. E. Nesterova, J. Phys. Chem. B, 2013, 117, 10115– 10121. 13 E. M. Moody and P. C. Bevilacqua, J. Am. Chem. Soc., 2003, 125, 16285–16293. 14 P. Buceka, R. Gargallob and A. Kudrev, Anal. Chim. Acta, 2010, 683, 69–77. 15 J. L. Leroy, M. Gueron, J. L. Mergny and C. Hélène, Nucleic Acids Res., 1994, 22, 1600–1606. 16 (a) N. K. Sharma and K. N. Ganesh, Chem. Commun., 2005, 4330–4332; (b) B. Datta, M. E. Bier, S. Roy and B. A. Armitage, J. Am. Chem. Soc., 2005, 127, 4199–4207. 17 (a) A. Pasternak and J. Wengel, Bioorg. Med. Chem. Lett., 2011, 21, 752–755; (b) Y. Krishnan-Ghosh, E. Stephens and S. Balasubramanian, J. Am. Chem. Soc., 2004, 126, 5944–5945; (c) Y. Krishnan-Ghosh, Y. A. M. Whitney and S. Balasubramanian, Chem. Commun., 2005, 3068–3070. 18 (a) T. Kulikowski and D. Shugar, Acta Biochim. Pol., 1979, 26, 145–160; (b) K. Kawai, Y. osakada and T. Majima, Chem- PhysChem, 2009, 10, 1766–1769. 19 N. Kumar, M. Petersen and S. Maiti, Chem. Commun., 2009, 1532–1534. Fig. 4 pH tuning of the various I-switches. Dynamic range (10%–90% of total signal change) based on fluorescent studies of – (a) Br modified switches compared with native (I4) switch and (b) Me modified switches compared with native (I7) switch. The colour of the boxes indicate the position of the modification in the I-switches as described in Fig. 1(c). Communication Nanoscale Nanoscale This journal is © The Royal Society of Chemistry 2015 Publishedon20May2015.DownloadedbyIndianInstituteofScienceon26/05/201507:23:25. View Article Online
  • 5. 20 R. Z. Jin, K. J. Breslauer, R. A. Jones and B. L. Gaffney, Science, 1990, 250, 543–546. 21 E. L. Edwards, M. H. Patrick, R. L. Ratliff and D. M. Gray, Biochemistry, 1990, 29, 828–836. 22 H. Kanehara, M. Mizuguchi, K. Tajima, K. Kanaori and K. Makino, Biochemistry, 1997, 36, 1790–1797. 23 M. Kaushik, N. Suehl and L. A. Marky, Biophys. Chem., 2007, 126, 154–164. 24 M. M. Dailey, M. C. Miller, P. J. Bates, A. N. Lane and J. O. Trent, Nucleic Acids Res., 2010, 38, 4877–4888. 25 (a) T. Fessl and D. M. J. Lilley, Biophys. J., 2013, 105, 2175– 2181; (b) A. Iqbal, S. Arslan, B. Okumus, T. J. Wilson, G. Giraud, D. G. Norman, T. Ha and D. M. J. Lilley, Proc. Natl. Acad. Sci. U. S. A., 2008, 105, 11176–11181. 26 A. T. Phan and J. L. Mergny, Nucleic Acids Res., 2002, 30, 4618–4625. 27 (a) D. S. Reddy, D. C. Craig and G. R. Desiraju, J. Am. Chem. Soc., 1996, 118, 4090–4093; (b) C. M. Reddy, M. T. Kirchner, R. C. Gundakaram, K. A. Padmanabhan and G. R. Desiraju, Chem. – Eur. J., 2006, 12, 2222–2234; (c) V. R. Pedireddi, D. S. Reddy, B. S. Goud, D. C. Craig, A. D. Rae and G. R. Desiraju, J. Chem. Soc., Perkin Trans. 2, 1994, 2, 2353– 2360. 28 A. L. Lieblein, B. Furtig and H. Schwalbe, ChemBioChem, 2013, 14, 1226–1230. 29 S. P. Gurung, C. Schwarz, J. P. Hall, C. J. Cardin and J. A. Brazier, Chem. Commun., 2015, DOI: 10.1039/ c4cc07279k. Nanoscale Communication This journal is © The Royal Society of Chemistry 2015 Nanoscale Publishedon20May2015.DownloadedbyIndianInstituteofScienceon26/05/201507:23:25. View Article Online