1. Sadiq Jafri Fund Management GATF Monthly Performance Report July-Aug 2010
There is, however, something to be said for these correlations. As discussed on the previous
page, they do not provide us with trading setups necessarily but merely and indication of how
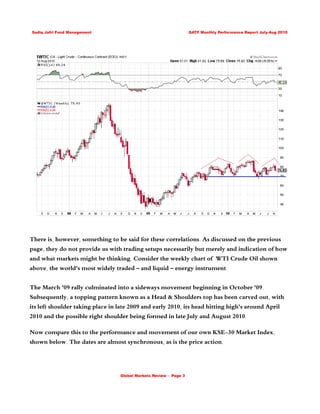
and what markets might be thinking. Consider the weekly chart of WTI Crude Oil shown
above, the world's most widely traded – and liquid – energy instrument.
The March '09 rally culminated into a sideways movement beginning in October '09.
Subsequently, a topping pattern known as a Head & Shoulders top has been carved out, with
its left shoulder taking place in late 2009 and early 2010, its head hitting high's around April
2010 and the possible right shoulder being formed in late July and August 2010.
Now compare this to the performance and movement of our own KSE-30 Market Index,
shown below. The dates are almost synchronous, as is the price action.
Global Markets Review - Page 3
2. Sadiq Jafri Fund Management GATF Monthly Performance Report July-Aug 2010
Similar price patterns exist on several of the world's leading equity and commodity indices
and sector charts, including but not limited to, the Dow Jones Industrial Average, the S&P
500, the CRB/Jeffries Commodities Index and so on, as detailed by charts shown here and on
other pages in this report.
So, what does this tell us? That the rally the world experienced during the last 15-18 months in
both commodity and equity prices, is over? That we are poised to roll over in Armageddon
like fashion across leading markets? Not necessarily. In our opinion, and more importantly
from our funds trading perspective, the world's markets are indeed showing exhaustion and
Global Markets Review - Page 4