Beginners Guide to TikTok for Search - Rachel Pearson - We are Tilt __ Bright...
Mbak dayani regresi berganda
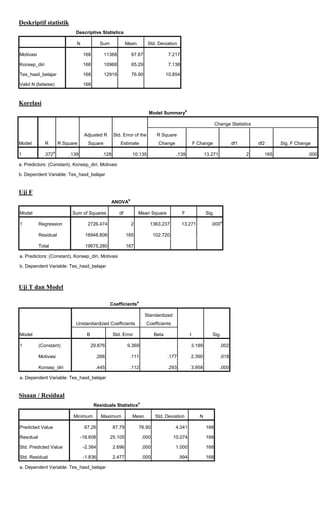
1. Deskriptif statistik
Descriptive Statistics
N
Sum
Mean
Std. Deviation
Motivasi
168
11368
67.67
7.217
Konsep_diri
168
10968
65.29
7.138
Tes_hasil_belajar
168
12919
76.90
10.854
Valid N (listwise)
168
Korelasi
b
Model Summary
Change Statistics
Adjusted R
Model
R
1
.372
R Square
a
Std. Error of the
R Square
Square
Estimate
Change
.139
.128
10.135
F Change
.139
df1
13.271
2
a. Predictors: (Constant), Konsep_diri, Motivasi
b. Dependent Variable: Tes_hasil_belajar
Uji F
b
ANOVA
Model
1
Sum of Squares
Regression
df
Mean Square
F
2726.474
2
1363.237
Residual
16948.806
165
19675.280
.000
a
102.720
Total
Sig.
13.271
167
a. Predictors: (Constant), Konsep_diri, Motivasi
b. Dependent Variable: Tes_hasil_belajar
Uji T dan Model
Coefficients
a
Standardized
Unstandardized Coefficients
Model
1
B
(Constant)
Coefficients
Std. Error
Beta
29.876
9.369
Motivasi
.266
.111
Konsep_diri
.445
.112
t
Sig.
3.189
.002
.177
2.390
.018
.293
3.958
.000
a. Dependent Variable: Tes_hasil_belajar
Sisaan / Residual
Residuals Statistics
Minimum
Predicted Value
Maximum
a
Mean
Std. Deviation
N
67.26
87.79
76.90
4.041
168
-18.608
25.105
.000
10.074
168
Std. Predicted Value
-2.384
2.696
.000
1.000
168
Std. Residual
-1.836
2.477
.000
.994
168
Residual
a. Dependent Variable: Tes_hasil_belajar
df2
165
Sig. F Change
.000
2. Homogenitas
Levene's Test of Equality of Error Variances
a
Dependent Variable:Tes_hasil_belajar
F
1.018
df1
df2
144
Sig.
23
.509
Tests the null hypothesis that the error variance
of the dependent variable is equal across groups.
a. Design: Intercept + Motivasi + Konsep_diri