Show Me the Money: How City Budgets Work in Southern California
•
1 like•1,453 views

Every year, city councils create a budget based on their community goals. To better understand what drives different budgets among Southern California cities, we look at the overall differences between budget sizes and the potential drivers for this difference. We then deep dive into two particular cities, Santa Monica and Ventura, to compare their respective budgets from a revenue and expenditure perspective.
Recommended

Recommended
More Related Content
Viewers also liked
Viewers also liked (10)
Similar to Show Me the Money: How City Budgets Work in Southern California
Similar to Show Me the Money: How City Budgets Work in Southern California (20)
Recently uploaded
Recently uploaded (20)
Show Me the Money: How City Budgets Work in Southern California
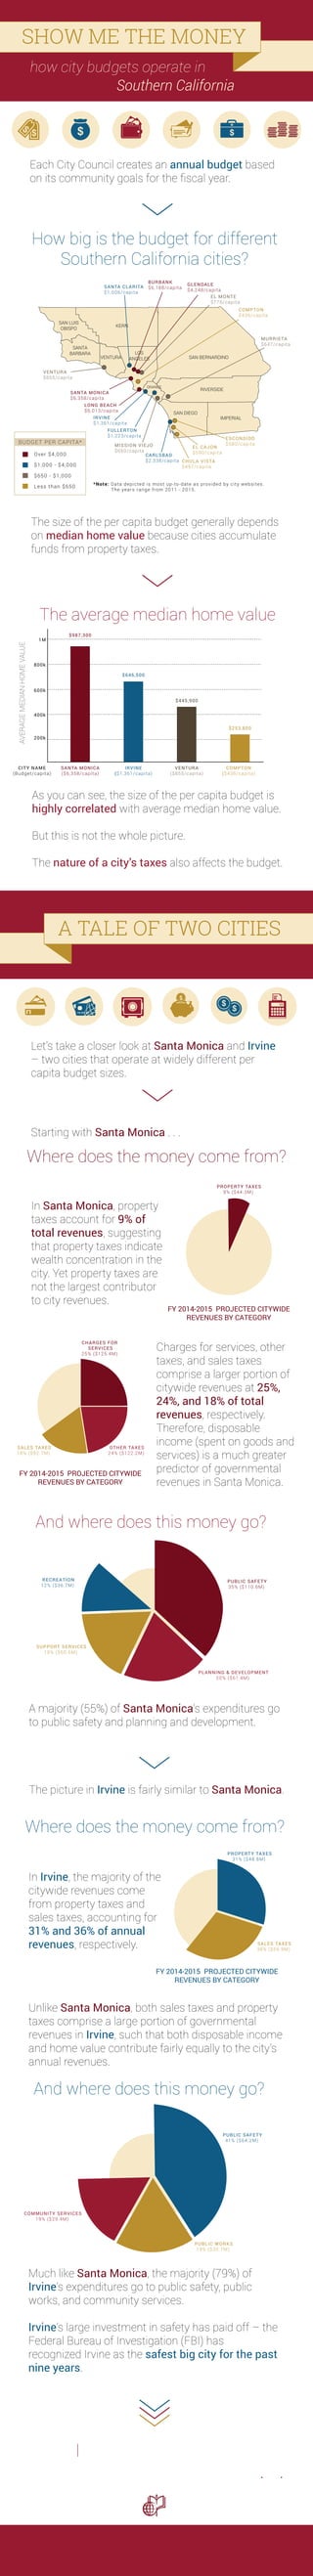
- 1. IMPERIAL SAN DIEGO RIVERSIDE ORANGE SAN BERNARDINO KERN VENTURA SANTA BARBARA SAN LUIS OBISPO SHOW ME THE MONEY how city budgets operate in Southern California Each City Council creates an annual budget based on its community goals for the fiscal year. The size of the per capita budget generally depends on median home value because cities accumulate funds from property taxes. How big is the budget for different Southern California cities? The average median home value SANTA MONICA $6,358/capita LONG BEACH $6,013/capita CARLSBAD $2,338/capita MURRIETA $647/capita CHULA VISTA $497/capita EL CAJON $590/capita ESCONDIDO $580/capita COMPTON $436/capita MISSION VIEJO $650/capita VENTURA $855/capita EL MONTE $776/capita IRVINE $1,361/capita SANTA CLARITA $1,006/capita FULLERTON $1,223/capita BURBANK $6,188/capita GLENDALE $4,248/capita BUDGET PER CAPITA* Over $4,000 $1,000 - $4,000 $650 - $1,000 Less than $650 *Note: Data depicted is most up-to-date as provided by city websites. The years range from 2011 - 2015. LOS ANGELES AVERAGEMEDIANHOMEVALUE SANTA MONICA ($6,358/capita) CITY NAME (Budget/capita) 200k 400k 600k 800k 1M $987,300 $646,500 $445,900 $253,800 IRVINE ($1,361/capita) VENTURA ($855/capita) COMPTON ($436/capita) As you can see, the size of the per capita budget is highly correlated with average median home value. But this is not the whole picture. The nature of a city’s taxes also affects the budget. A TALE OF TWO CITIES Let’s take a closer look at Santa Monica and Irvine – two cities that operate at widely different per capita budget sizes. In Santa Monica, property taxes account for 9% of total revenues, suggesting that property taxes indicate wealth concentration in the city. Yet property taxes are not the largest contributor to city revenues. Charges for services, other taxes, and sales taxes comprise a larger portion of citywide revenues at 25%, 24%, and 18% of total revenues, respectively. Therefore, disposable income (spent on goods and services) is a much greater predictor of governmental revenues in Santa Monica. PROPERTY TAXES 9% ($44.3M) FY 2014-2015 PROJECTED CITYWIDE REVENUES BY CATEGORY FY 2014-2015 PROJECTED CITYWIDE REVENUES BY CATEGORY CHARGES FOR SERVICES 25% ($125.4M) SALES TAXES 18% ($92.7M) OTHER TAXES 24% ($122.2M) And where does this money go? PUBLIC SAFETY 35% ($110.6M) PLANNING & DEVELOPMENT 20% ($61.4M) SUPPORT SERVICES 19% ($60.6M) RECREATION 12% ($36.7M) A majority (55%) of Santa Monica’s expenditures go to public safety and planning and development. The picture in Irvine is fairly similar to Santa Monica. Unlike Santa Monica, both sales taxes and property taxes comprise a large portion of governmental revenues in Irvine, such that both disposable income and home value contribute fairly equally to the city’s annual revenues. Where does the money come from? Where does the money come from? Starting with Santa Monica . . . In Irvine, the majority of the citywide revenues come from property taxes and sales taxes, accounting for 31% and 36% of annual revenues, respectively. PROPERTY TAXES 31% ($48.8M) SALES TAXES 36% ($56.9M) FY 2014-2015 PROJECTED CITYWIDE REVENUES BY CATEGORY And where does this money go? PUBLIC SAFETY 41% ($64.2M) PUBLIC WORKS 19% ($30.7M) COMMUNITY SERVICES 19% ($29.4M) Much like Santa Monica, the majority (79%) of Irvine’s expenditures go to public safety, public works, and community services. Irvine’s large investment in safety has paid off – the Federal Bureau of Investigation (FBI) has recognized Irvine as the safest big city for the past nine years. More information can be found at roseinstitute.org. Want to learn more about city budgets?