SlideShare a Scribd company logo
1 of 6
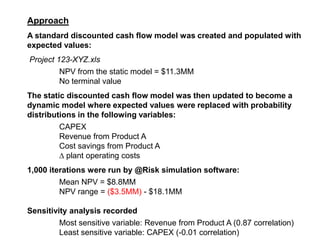
Approach A standard discounted cash flow model was created and populated with expected values: Project 123-XYZ.xls 	NPV from the static model = $11.3MM 	No terminal value The static discounted cash flow model was then updated to become a dynamic model where expected values were replaced with probability distributions in the following variables:   	CAPEX	 	Revenue from Product A Cost savings from Product A ∆ plant operating costs 1,000 iterations were run by @Risk simulation software: 	Mean NPV = $8.8MM 	NPV range = ($3.5MM) - $18.1MM Sensitivity analysis recorded 	Most sensitive variable: Revenue from Product A (0.87 correlation) 	Least sensitive variable: CAPEX (-0.01 correlation)
Discounted Cash Flow Model This model & its values are to demonstrate simulation studies / war gaming Project 123-XYZ Year 1 Year 2 Year 3 Year 4 Year 5 Year 6 Year 7 Year 8 Year 9 Year 11 Year 12 Product A Product A Cost savings ,[object Object]
Discounted to 2009 USD
All expected values came from expected values in SR model titled: Project 123-XYZ Base Case EVA  10 year 5.20.08.xls
3% inflation of Product A revenues, fuel savings, and ∆ plant costs
20 year straight-line depreciation

More Related Content

Similar to Increasing Capital Budgeting Insight Using Monte Carlo Simulation / War Gaming with NPV / EVA Models

EGT267 Programming for Engineering Applications Spring 2020 .docx
EGT267 Programming for Engineering Applications Spring 2020 .docxEGT267 Programming for Engineering Applications Spring 2020 .docx
EGT267 Programming for Engineering Applications Spring 2020 .docxgidmanmary
 
Risk & capital budgeting
Risk & capital  budgetingRisk & capital  budgeting
Risk & capital budgetinglubnasadiyah
 
Class costs i
Class costs iClass costs i
Class costs imayankvns
 
Risk Concept And Management 5
Risk Concept And Management 5Risk Concept And Management 5
Risk Concept And Management 5rajeevgupta
 
7. annual cash flow analysis
7. annual cash flow analysis7. annual cash flow analysis
7. annual cash flow analysisMohsin Siddique
 
7 150316005526-conversion-gate01
7 150316005526-conversion-gate017 150316005526-conversion-gate01
7 150316005526-conversion-gate01abidiqbal55
 
The Production And Cost C M A
The  Production And  Cost   C M AThe  Production And  Cost   C M A
The Production And Cost C M AZoha Qureshi
 
Chapter 18 sensitivity analysis
Chapter 18   sensitivity analysisChapter 18   sensitivity analysis
Chapter 18 sensitivity analysisBich Lien Pham
 
Chapter 18 sensitivity analysis
Chapter 18   sensitivity analysisChapter 18   sensitivity analysis
Chapter 18 sensitivity analysisBich Lien Pham
 
COST NOTES LECTURE ALL COST CURVES NUMERICALS EXAMPLES THEORY
COST NOTES LECTURE ALL COST CURVES NUMERICALS EXAMPLES THEORY COST NOTES LECTURE ALL COST CURVES NUMERICALS EXAMPLES THEORY
COST NOTES LECTURE ALL COST CURVES NUMERICALS EXAMPLES THEORY SOURAV DAS
 
Task Force Pace Phone Confer Q&A 7 29 09
Task Force Pace Phone Confer Q&A 7 29 09Task Force Pace Phone Confer Q&A 7 29 09
Task Force Pace Phone Confer Q&A 7 29 09Chris Smith
 
Preventive maintenance
Preventive maintenancePreventive maintenance
Preventive maintenanceSTACY DAVIS
 
Cost function
Cost functionCost function
Cost functionptttt
 

Similar to Increasing Capital Budgeting Insight Using Monte Carlo Simulation / War Gaming with NPV / EVA Models (20)

EGT267 Programming for Engineering Applications Spring 2020 .docx
EGT267 Programming for Engineering Applications Spring 2020 .docxEGT267 Programming for Engineering Applications Spring 2020 .docx
EGT267 Programming for Engineering Applications Spring 2020 .docx
 
Risk & capital budgeting
Risk & capital  budgetingRisk & capital  budgeting
Risk & capital budgeting
 
Class costs i
Class costs iClass costs i
Class costs i
 
Risk Concept And Management 5
Risk Concept And Management 5Risk Concept And Management 5
Risk Concept And Management 5
 
7. annual cash flow analysis
7. annual cash flow analysis7. annual cash flow analysis
7. annual cash flow analysis
 
7 150316005526-conversion-gate01
7 150316005526-conversion-gate017 150316005526-conversion-gate01
7 150316005526-conversion-gate01
 
The Production And Cost C M A
The  Production And  Cost   C M AThe  Production And  Cost   C M A
The Production And Cost C M A
 
Cost analysis
Cost analysisCost analysis
Cost analysis
 
Chapter 13
Chapter 13Chapter 13
Chapter 13
 
theoty x and y
theoty x and ytheoty x and y
theoty x and y
 
Chap6
Chap6Chap6
Chap6
 
Chapter 18 sensitivity analysis
Chapter 18   sensitivity analysisChapter 18   sensitivity analysis
Chapter 18 sensitivity analysis
 
Chapter 18 sensitivity analysis
Chapter 18   sensitivity analysisChapter 18   sensitivity analysis
Chapter 18 sensitivity analysis
 
Lo4b(arif)
Lo4b(arif)Lo4b(arif)
Lo4b(arif)
 
COST NOTES LECTURE ALL COST CURVES NUMERICALS EXAMPLES THEORY
COST NOTES LECTURE ALL COST CURVES NUMERICALS EXAMPLES THEORY COST NOTES LECTURE ALL COST CURVES NUMERICALS EXAMPLES THEORY
COST NOTES LECTURE ALL COST CURVES NUMERICALS EXAMPLES THEORY
 
Task Force Pace Phone Confer Q&A 7 29 09
Task Force Pace Phone Confer Q&A 7 29 09Task Force Pace Phone Confer Q&A 7 29 09
Task Force Pace Phone Confer Q&A 7 29 09
 
Preventive maintenance
Preventive maintenancePreventive maintenance
Preventive maintenance
 
Cost function
Cost functionCost function
Cost function
 
Cost function
Cost functionCost function
Cost function
 
Cost function
Cost functionCost function
Cost function
 

Increasing Capital Budgeting Insight Using Monte Carlo Simulation / War Gaming with NPV / EVA Models

  • 1. Approach A standard discounted cash flow model was created and populated with expected values: Project 123-XYZ.xls NPV from the static model = $11.3MM No terminal value The static discounted cash flow model was then updated to become a dynamic model where expected values were replaced with probability distributions in the following variables: CAPEX Revenue from Product A Cost savings from Product A ∆ plant operating costs 1,000 iterations were run by @Risk simulation software: Mean NPV = $8.8MM NPV range = ($3.5MM) - $18.1MM Sensitivity analysis recorded Most sensitive variable: Revenue from Product A (0.87 correlation) Least sensitive variable: CAPEX (-0.01 correlation)
  • 2.
  • 4. All expected values came from expected values in SR model titled: Project 123-XYZ Base Case EVA 10 year 5.20.08.xls
  • 5. 3% inflation of Product A revenues, fuel savings, and ∆ plant costs
  • 6. 20 year straight-line depreciation
  • 8. No ∆ in working capitalInputs & Assumptions:
  • 9.
  • 10. Could be up to 5% less
  • 11.
  • 12. Could be up to 25% less
  • 13.
  • 14.
  • 15. Could be +/- 10%∆ in plant costs (due to Product A)
  • 16.
  • 18.
  • 20. No ∆working capitalNPV is guaranteed to not be exactly $11.3MM. How much +/- is a matter of many probabilities combining. (Model forecasts 30% prob. NPV will be >$11MM)
  • 21.
  • 22.
  • 23. Yearly revenue from Product A is ~2x the value of fuel savings from Product A
  • 24. Plant costs each year are about the same as the revenue from Product A. However, plant costs have more certainty than the revenue estimatesCost Savings Cost Savings Cost
  • 25.
  • 26. Will Holcim close a kiln?
  • 27. If so, which year?
  • 28. If so, how much volume will we get?
  • 29. Will Holcim close two kilns?
  • 30.
  • 31. … and any other uncertainty we may have.Competitor A Comp. B Competitor B reduce capacity? Competitor B exit the market completely?