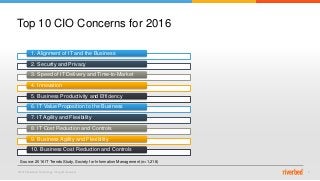
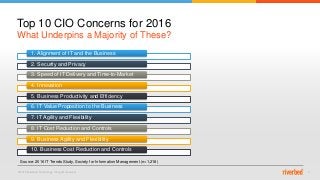
Measuring the Business
Impact of Application
Performance
What Are Your Performance Metrics
Really Telling You?
© 2015 Riverbed Technology. All rights reserved. 2
Top 10 CIO Concerns for 2016
1. Alignment of IT and the Business
2. Security and Privacy
3. Speed of IT Delivery and Time-to-Market
4. Innovation
5. Business Productivity and Efficiency
6. IT Value Proposition to the Business
7. IT Agility and Flexibility
8. IT Cost Reduction and Controls
9. Business Agility and Flexibility
10. Business Cost Reduction and Controls
Source: 2016 IT Trends Study, Society for Information Management (n=1,218)
© 2015 Riverbed Technology. All rights reserved. 3
1. Alignment of IT and the Business
2. Security and Privacy
3. Speed of IT Delivery and Time-to-Market
4. Innovation
5. Business Productivity and Efficiency
6. IT Value Proposition to the Business
7. IT Agility and Flexibility
8. IT Cost Reduction and Controls
9. Business Agility and Flexibility
10. Business Cost Reduction and Controls
Top 10 CIO Concerns for 2016
What Underpins a Majority of These?
Source: 2016 IT Trends Study, Society for Information Management (n=1,218)
© 2015 Riverbed Technology. All rights reserved. 4
Superior performance of
business-critical applications
© 2015 Riverbed Technology. All rights reserved. 5
Application
Performance
Business
Performance=
In Other Words…
© 2015 Riverbed Technology. All rights reserved. 6
How so?
© 2015 Riverbed Technology. All rights reserved. 7
89% 1.6 hours
When Applications Don’t Perform, Business Suffers
Percentage of executives
who say poor enterprise
application performance
negatively impacts their
work1
The average hourly cost of
a critical application failure
for a large organization2
Minimum amount of
business downtime that
59% of the Fortune 500
experience per week3
$500,000 - $1 million
1. Riverbed, “Riverbed Global Application Performance Survey,” November 2015
2. IDC, “DevOps and the Cost of Downtime: Fortune 1000 Best Practice Metrics Quantified,” Dec. 2014
3. Vision Solutions, “Assessing the Financial Impact of Downtime,” 2008
© 2015 Riverbed Technology. All rights reserved. 8
When Applications Don’t Perform, Business Is Lost
1
1
1 1
2 3
1. Forrester, “Realize Practical Application Management, Feb. 2013
2. Ibid
3. The Aberdeen Group, “The Performance of Web Applications: Customers Are Won or Lost in One Second,” May 2015
© 2015 Riverbed Technology. All rights reserved. 9
When Applications Don’t Perform, Brands Are Impacted
29%
32%
33%
35%
40%
41%
0% 5% 10% 15% 20% 25% 30% 35% 40% 45%
Decreased employee morale
Negative impact on brand
Lost clients or customers
Missed critical deadlines
Contract delays
Dissatisfied clients or customers
Source: Riverbed Global Application Performance Survey, Nov. 2015, Riverbed (n= 900)
PitfallsofPoorAppPerformance
© 2015 Riverbed Technology. All rights reserved. 10
But When Apps Perform Optimally, Businesses Experience…
31%
33%
43%
47%
50%
51%
0% 10% 20% 30% 40% 50% 60%
Improved employee morale
Faster delivery of products to market
Improved customer satisfaction
Cost savings
Time savings
Improved employee productivity
Source: Riverbed Global Application Performance Survey, Nov. 2015, Riverbed (n= 900)
BenefitsofOptimalAppPerformance
© 2015 Riverbed Technology. All rights reserved. 11
Being able to quantify this relationship
between application performance and
business performance is important for
IT leaders, but it’s also challenging…
© 2015 Riverbed Technology. All rights reserved. 12
The Challenges for IT Leaders
 Traditional application SLAs don’t directly
translate to business impact
– How does an increase in response time affect the number of
customer orders or other volume-based transactions?
 64% of organizations still use fragmented
approaches to technology monitoring1
– Data is more difficult to aggregate and translate into
actionable business intelligence
 Pinpointing the most valuable data is difficult
– Digital universe doubles every two years, but only 22% of
this data is useful for analysis2
1. Forrester, “Application Performance Management Is Critical To Business Success,” Feb. 2014
2. IDC, “The Digital Universe of Opportunities: Rich Data and the Increasing Value of the Internet of Things,” April 2014
© 2015 Riverbed Technology. All rights reserved. 13© 2015 Riverbed Technology. All rights reserved. 13
What’s IT to Do, Then?
Start speaking the language of business leaders
Eliminate siloed approaches to technology monitoring
Create dashboards to establish transparency and trust
© 2015 Riverbed Technology. All rights reserved. 14
Starter tips:
1. Examine how effective the current set of application
metrics are when communicating IT’s performance
2. Meet with executives, review business objectives, and
pinpoint business KPIs that align with those goals
3. Identify 5-10 apps that have the most influence on those
business objectives
4. Create a value mapping between application SLAs and
business KPIs, similar to the image to the right
5. Conduct a gap analysis to see if the right technologies
are in place to collect and report relevant data
6. Review trending data for one quarter’s time to prove
relationships between business KPIs and app SLAs
7. Regularly review reporting strategy to validate metrics,
benchmark performance, and make adjustments
Map the Relationship Between Application SLAs and Business KPIs
Speak the Language of the Business
© 2015 Riverbed Technology. All rights reserved. 15
What to look for:
1. Network performance management (NPM)
2. Application performance management (APM)
3. A unified console that aggregates all NPM and APM
metrics into role-relevant dashboards.
Converge Performance Metrics into a Single, Unified Platform
Eliminate Siloed Approaches to Technology Monitoring
© 2015 Riverbed Technology. All rights reserved. 16
Considerations when developing dashboards:
1. Stakeholders need to be able to analyze dashboards at
a quick glance, within a single screen and a few clicks
2. Provide role-based dashboards to present only the
information that is most important to various groups
3. Dashboards should help communicate the value of
various IT solutions
Provide Real-time Information Needed for Agile Decision-Making
Create Dashboards to Establish Transparency and Trust
© 2015 Riverbed Technology. All rights reserved. 17
 Download our white paper:
http://rvbd.ly/1Q3zO3q
 Review our global app performance survey:
http://rvbd.ly/1XLJcaX
 Contact Riverbed:
http://www.riverbed.com/contact/#form
Ready to Learn More?

What Are Your Application Performance Metrics Telling You About Business Performance?

  • 1.
    Measuring the Business Impactof Application Performance What Are Your Performance Metrics Really Telling You?
  • 2.
    © 2015 RiverbedTechnology. All rights reserved. 2 Top 10 CIO Concerns for 2016 1. Alignment of IT and the Business 2. Security and Privacy 3. Speed of IT Delivery and Time-to-Market 4. Innovation 5. Business Productivity and Efficiency 6. IT Value Proposition to the Business 7. IT Agility and Flexibility 8. IT Cost Reduction and Controls 9. Business Agility and Flexibility 10. Business Cost Reduction and Controls Source: 2016 IT Trends Study, Society for Information Management (n=1,218)
  • 3.
    © 2015 RiverbedTechnology. All rights reserved. 3 1. Alignment of IT and the Business 2. Security and Privacy 3. Speed of IT Delivery and Time-to-Market 4. Innovation 5. Business Productivity and Efficiency 6. IT Value Proposition to the Business 7. IT Agility and Flexibility 8. IT Cost Reduction and Controls 9. Business Agility and Flexibility 10. Business Cost Reduction and Controls Top 10 CIO Concerns for 2016 What Underpins a Majority of These? Source: 2016 IT Trends Study, Society for Information Management (n=1,218)
  • 4.
    © 2015 RiverbedTechnology. All rights reserved. 4 Superior performance of business-critical applications
  • 5.
    © 2015 RiverbedTechnology. All rights reserved. 5 Application Performance Business Performance= In Other Words…
  • 6.
    © 2015 RiverbedTechnology. All rights reserved. 6 How so?
  • 7.
    © 2015 RiverbedTechnology. All rights reserved. 7 89% 1.6 hours When Applications Don’t Perform, Business Suffers Percentage of executives who say poor enterprise application performance negatively impacts their work1 The average hourly cost of a critical application failure for a large organization2 Minimum amount of business downtime that 59% of the Fortune 500 experience per week3 $500,000 - $1 million 1. Riverbed, “Riverbed Global Application Performance Survey,” November 2015 2. IDC, “DevOps and the Cost of Downtime: Fortune 1000 Best Practice Metrics Quantified,” Dec. 2014 3. Vision Solutions, “Assessing the Financial Impact of Downtime,” 2008
  • 8.
    © 2015 RiverbedTechnology. All rights reserved. 8 When Applications Don’t Perform, Business Is Lost 1 1 1 1 2 3 1. Forrester, “Realize Practical Application Management, Feb. 2013 2. Ibid 3. The Aberdeen Group, “The Performance of Web Applications: Customers Are Won or Lost in One Second,” May 2015
  • 9.
    © 2015 RiverbedTechnology. All rights reserved. 9 When Applications Don’t Perform, Brands Are Impacted 29% 32% 33% 35% 40% 41% 0% 5% 10% 15% 20% 25% 30% 35% 40% 45% Decreased employee morale Negative impact on brand Lost clients or customers Missed critical deadlines Contract delays Dissatisfied clients or customers Source: Riverbed Global Application Performance Survey, Nov. 2015, Riverbed (n= 900) PitfallsofPoorAppPerformance
  • 10.
    © 2015 RiverbedTechnology. All rights reserved. 10 But When Apps Perform Optimally, Businesses Experience… 31% 33% 43% 47% 50% 51% 0% 10% 20% 30% 40% 50% 60% Improved employee morale Faster delivery of products to market Improved customer satisfaction Cost savings Time savings Improved employee productivity Source: Riverbed Global Application Performance Survey, Nov. 2015, Riverbed (n= 900) BenefitsofOptimalAppPerformance
  • 11.
    © 2015 RiverbedTechnology. All rights reserved. 11 Being able to quantify this relationship between application performance and business performance is important for IT leaders, but it’s also challenging…
  • 12.
    © 2015 RiverbedTechnology. All rights reserved. 12 The Challenges for IT Leaders  Traditional application SLAs don’t directly translate to business impact – How does an increase in response time affect the number of customer orders or other volume-based transactions?  64% of organizations still use fragmented approaches to technology monitoring1 – Data is more difficult to aggregate and translate into actionable business intelligence  Pinpointing the most valuable data is difficult – Digital universe doubles every two years, but only 22% of this data is useful for analysis2 1. Forrester, “Application Performance Management Is Critical To Business Success,” Feb. 2014 2. IDC, “The Digital Universe of Opportunities: Rich Data and the Increasing Value of the Internet of Things,” April 2014
  • 13.
    © 2015 RiverbedTechnology. All rights reserved. 13© 2015 Riverbed Technology. All rights reserved. 13 What’s IT to Do, Then? Start speaking the language of business leaders Eliminate siloed approaches to technology monitoring Create dashboards to establish transparency and trust
  • 14.
    © 2015 RiverbedTechnology. All rights reserved. 14 Starter tips: 1. Examine how effective the current set of application metrics are when communicating IT’s performance 2. Meet with executives, review business objectives, and pinpoint business KPIs that align with those goals 3. Identify 5-10 apps that have the most influence on those business objectives 4. Create a value mapping between application SLAs and business KPIs, similar to the image to the right 5. Conduct a gap analysis to see if the right technologies are in place to collect and report relevant data 6. Review trending data for one quarter’s time to prove relationships between business KPIs and app SLAs 7. Regularly review reporting strategy to validate metrics, benchmark performance, and make adjustments Map the Relationship Between Application SLAs and Business KPIs Speak the Language of the Business
  • 15.
    © 2015 RiverbedTechnology. All rights reserved. 15 What to look for: 1. Network performance management (NPM) 2. Application performance management (APM) 3. A unified console that aggregates all NPM and APM metrics into role-relevant dashboards. Converge Performance Metrics into a Single, Unified Platform Eliminate Siloed Approaches to Technology Monitoring
  • 16.
    © 2015 RiverbedTechnology. All rights reserved. 16 Considerations when developing dashboards: 1. Stakeholders need to be able to analyze dashboards at a quick glance, within a single screen and a few clicks 2. Provide role-based dashboards to present only the information that is most important to various groups 3. Dashboards should help communicate the value of various IT solutions Provide Real-time Information Needed for Agile Decision-Making Create Dashboards to Establish Transparency and Trust
  • 17.
    © 2015 RiverbedTechnology. All rights reserved. 17  Download our white paper: http://rvbd.ly/1Q3zO3q  Review our global app performance survey: http://rvbd.ly/1XLJcaX  Contact Riverbed: http://www.riverbed.com/contact/#form Ready to Learn More?

Editor's Notes

  • #6 Clearly, application performance equals business performance. We depend on applications for everything today, whether you’re at a local retail store or a multinational corporation. If applications don’t work, employees can’t work. Collaboration doesn’t happen. Products don’t get shipped on time. Customers can’t be served. Transactions can’t complete. Business is lost. Application performance directly impacts business performance in every way.
  • #10 GLOBAL RESULTS: When apps don’t work as they should, they have negative impacts on the business. Respondents said poor application performance has resulted in:   Dissatisfied clients or customers (41%) Contract delays (40%) Missed critical deadlines (35%) Lost clients or customers (33%)