SlideShare a Scribd company logo
1 of 2
Download to read offline
MARKET                                                      Weekly Market Recap
INSIGHTS                                                    December 10, 2012
                                                                                                                                                 Friday                             Prior                          Year                   Year                                            Friday             Prior                 Year            Year
                                                                                                                                                  Close                             Week                            End                   Ago                                              Close             Week                   End            Ago
Headlines                                                    Index Levels                                                                        12/7/12                          11/30/12                       12/30/11               12/7/11        Consumer Rates                     12/7/12          11/30/12              12/30/11         12/7/11
• The ECB left policy rates unchanged.                       Dow Jones 30                                                                        13,155                            13,026                         12,218                12,196         6 Month CD                           0.33              0.34                  0.64           0.64
• U.S. policymakers continued fiscal cliff discussions.      S&P 500                                                                              1,418                             1,416                          1,258                  1,261        30 Year Mortgage                     3.52              3.53                  4.07            4.18
Economic News                                                Nasdaq                                                                               2,978                             3,010                          2,605                 2,649         Prime Rate                           3.25              3.25                  3.25            3.25
•   The ISM Manufacturing index fell in November.            Russell 2000                                                                           822                               822                            741                   746
                                                                                                                                                                                                                                                       Commodities
•   Jobless claims fell to 370,000.                          Bond Rates                                                                                                                                                                                Gold                              1701.50           1726.00               1531.00         1735.50
•   Consumer sentiment fell to 74.5.                         2 Year Treasury                                                                      0.24                                     0.25                          0.24            0.23          Crude Oil                           85.93             88.91                 98.83          100.49
•   Private Payrolls: +147K; Unemp. Rate: 7.7%.              10 Year Treasury                                                                     1.63                                      1.61                         1.87            2.02          Gasoline                             3.39              3.44                  3.26            3.29
•   Next Week: International Trade, Retail Sales, CPI.       10 Year Municipal                                                                    1.73                                     1.73                          2.45            2.64
                                                             High Yield                                                                           6.23                                     6.45                          8.36            8.55          Currency
Thought of the Week                                                                                                                                                                                                                                    $ per €                              1.29                  1.30             1.30                1.34
Historically, stronger recoveries tend to follow more        Fed Funds Target                                                                     N/A                                      0.25                          0.25            0.25
                                                                                                                                                                                                                                                       $ per £                              1.60                  1.60              1.55               1.57
severe recessions. However, as shown in this week’s
                                                                                                                                                                                                                                                       ¥ per $                             82.37                 82.47            76.94               77.73
chart, cumulative economic growth over the past three                                                                                                            1 week                                                          YTD
years has been the weakest coming out of a recession         Market Returns                                                                      Local                                     USD                          Local             USD                                                                                                    Wgt Avg
since the Great Depression, despite historic support         S&P 500                                                                              0.20                                     0.20                          15.19           15.19         Index                              P/E                 P/E                Dividend        Mkt Cap
from the Federal Reserve. With Operation Twist expiring      MSCI - EAFE                                                                          1.01                                     0.81                          15.33           15.16         Characteristics                  Forward             Trailing               Yield          (Bill)
at the end of this year and the Federal Reserve slated to    United Kingdom                                                                       0.87                                     0.83                         10.49           13.90          S&P 500                            12.92              15.92                  2.29         107.35
meet next week, it seems likely that the FOMC will           Europe ex-UK                                                                          1.14                                    0.52                         19.24           19.32          Russell 1000 Value                 11.82              14.54                  2.56          90.22
maintain its accommodative stance, and may announce          Japan                                                                                0.97                                     1.09                          11.36           4.02          Russell 1000 Growth                15.02              18.36                  1.80         100.61
additional Treasury purchases to offset the conclusion of    Asia ex-Japan                                                                         1.14                                    1.27                         17.66           20.47          Russell 2000                       17.66              23.65                  1.49            1.29
Operation Twist. Although a great deal of uncertainty
remains surrounding the fiscal cliff, once this              S&P 500 Sector Returns                                                                                                                                            Style Returns                       Chart of the Week
uncertainty subsides, we continue to believe that                                                                                                                                                                                 V       B        G                The Current U.S. Recovery is the Weakest Since the Depression
economic growth could accelerate in 2013 as housing                                                                                                                                                                                                                 Cumulative decline and subsequent 3-year recovery in real GDP
                                                                  1.7


continues to recover and sentiment continues to               2                                                                                                                                                            L     0.9     0.2      -0.5              25%
                                                                                                                                                                            Technology
                                                                                                                                                 Consumer


                                                                                                                                                                                         Materials
                                                                                 0.9


                                                                                                                                                                Telecom
                                                                                               0.7


improve.                                                                                                                                                                                                                                                                                                                  Real GDP Growth
                                                                                                         0.6

                                                                                                                         0.4

                                                                                                                                   0.4


                                                              1                                                                                                                                                                                                            20.2%
                                                                                                                                                 Discr.


                                                                                                                                                                                                     0.2


                                                                                                                                                                                                                                                          1 week
                                                                                                                                                                                                               1 week
                                                                                                                                                                                                                           M     0.9     0.4      0.0               20%            18.5% 18.4%
                                                              0                                                                                                                                                                                                                                  16.4%                    Real GDP Decline
Question of the week:
                                                                  Financials

                                                                                 Industrials

                                                                                               Energy

                                                                                                         Health Care
                                                                                                                       Consumer
                                                                                                                         Staples
                                                                                                                                   Utilities


                                                                                                                                                                                                     S&P 500
                                                                                                                                                   -0.2

                                                                                                                                                                -0.4


                                                                                                                                                                                                                                                                                                         14.1%
According to the 3Q12 Flow of Funds report from the          -1                                                                                                                                                            S     0.4     0.1      -0.3              15%                                          13.2%
                                                                                                                                                                                                                                                                                                                         12.4%
Federal Reserve, how much did household net worth
                                                                                                                                                                            -1.4


                                                             -2
                                                                                                                                                                                                                                                                                                                                 9.8%
                                                                                                                                                                                         -1.8


increase in the third quarter?
                                                                                                                                                                                                                                  V       B        G                10%                                                                 8.4%
                                                                                                                                                                                                                                                                                                                                               7.3%
Prior week's question:
                                                                  25.1

                                                                                 23.0


                                                                                                                                                                                                                                                                                                                                                      6.7%
                                                             30
                                                                                               19.0

                                                                                                         18.9


As a gauge of market fear, the CBOE VIX Index has
                                                                                                                                                                                                     15.2


                                                                                                                                                                                                                           L     16.2    15.2     14.7
                                                                                                                         13.7

                                                                                                                                   13.5

                                                                                                                                                   13.3


                                                             20                                                                                                                                                                                                      5%
                                                                                                                                                                9.4


traded below its long run average of 20 for the past 93
                                                                                                                                                                            4.7


                                                             10
days. When was the last time the VIX traded below this
                                                                                                                                                                                         1.6


                                                                                                                                                                                                               YTD


                                                                                                                                                                                                                                                          YTD
                                                                                                                                                                                                                           M     16.5    15.2     13.7
range for this length of time or longer?                      0                                                                                                                                                                                                      0%
                                                                  Financials
                                                                               Consumer
                                                                                   Discr.
                                                                                               Telecom

                                                                                                         Health Care
                                                                                                                       Consumer
                                                                                                                         Staples
                                                                                                                                   Industrials

                                                                                                                                                   Technology

                                                                                                                                                                Materials

                                                                                                                                                                            Energy

                                                                                                                                                                                         Utilities

                                                                                                                                                                                                     S&P 500


Answer to prior week's question:                                                                                                                                                                                           S     13.8    12.4     11.0
The last time the VIX traded below 20 for greater than                                                                                                                                                                                                              -5%
93 days was on July 25, 2007.                                                                                                                                                                                                                                              1948 1981 1960 1969 1973 1957 1953 1990 2001 1980 2008


Please see important disclosure on next page.                                                  Note: All returns represent total return including dividends.
MARKET                                   Weekly Market Recap | December 10, 2012
INSIGHTS

Chart of the Week: Source: BEA, NBER, J.P. Morgan Asset Management.                                               reinvestment of dividends. The Index used from L to R, top to bottom are: S&P 500 Index (Index represents
Thought of the Week: Source: BEA, NBER, Federal Reserve, J.P. Morgan Asset Management.                            the 500 Large Cap portion of the stock market, and is comprised of 500 stocks as selected by the S&P
                                                                                                                  Index Committee), Russell 1000 Value Index (Measures the performance of those Russell 1000 companies
Question of the Week: Source: Federal Reserve, J.P. Morgan Asset Management.                                      with lower price-to-book ratios and lower forecasted growth values), Russell 1000 Growth Index (Measures
Market Returns: All data represents total return including the reinvestment of dividends for stated period.       the performance of those Russell 1000 companies with higher price-to-book ratios and higher forecasted
Index: MSCI – EAFE; provided by: MSCI – gross official pricing. Index: UK; provided by: MSCI – gross official     growth values), Russell Mid Cap Value Index (Measures the performance of those Russell Mid Cap
pricing. Index: Europe ex-UK; provided by: MSCI – gross official pricing. Index: Japan; provided by: MSCI –       companies with lower price-to-book ratios and lower forecasted growth values), Russell Mid Cap Index
gross official pricing. Index: Asia ex-Japan; provided by: MSCI – gross official pricing. Index: S&P 500 Index;   (The Russell Midcap Index includes the smallest 800 securities in the Russell 1000), Russell Mid Cap
provided by: IDC.                                                                                                 Growth Index (Measures the performance of those Russell Mid Cap companies with higher price-to-book
(MSCI EAFE is a Morgan Stanley Capital International Index that is designed to measure the performance of         ratios and higher forecasted growth values), Russell 2000 Value Index (Measures the performance of
the developed stock markets of Europe, Australia, and the Far East).                                              those Russell 2000 companies with lower price-to-book ratios and lower forecasted growth values),
                                                                                                                  Russell 2000 Index (The Russell 2000 includes the smallest 2000 securities in the Russell 3000), Russell
Dow Jones-UBS Commodity Index (DJ-UBSCI) is a broadly diversified index composed of futures contracts
                                                                                                                  2000 Growth Index (Measures the performance of those Russell 2000 companies with higher price-to-
on physical commodities. The index is designed to minimize concentration in any one commodity or sector.
                                                                                                                  book ratios and higher forecasted growth values).
It includes 19 commodity futures in five groups.
                                                                                                                  Contact JPMorgan Distribution Services, Inc. at 1-800-480-4111 for a fund prospectus. You can
Bond Rates: Fed Funds Target, EcoWin; 2 Year Treasury, IDC; 10 Year Treasury, IDC; 10 Year Muni, Barclays
                                                                                                                  also visit us at www.jpmorganfunds.com. Investors should carefully consider the investment
Capital; High Yield, Barclays Capital High-yield Index.
                                                                                                                  objectives and risks as well as charges and expenses of the mutual fund before investing. The
Consumer Rates: 6 Month CD, Federal Reserve; 30 Year Mortgage, Mortgage Bankers Association (MBA);                prospectus contains this and other information about the mutual fund. Read the prospectus
Prime Rate: Federal Reserve.                                                                                      carefully before investing.
Commodities: Gold, EcoWin; Crude Oil (WTI), EcoWin; Gasoline, EcoWin.                                             Past performance does not guarantee future results.
Currency: Dollar per Pound, IDC; Dollar per Euro, IDC; Yen per Dollar, IDC.                                       Diversification does not guarantee investment returns and does not eliminate the risk of loss.
Index Price Levels: Reflects closing price level for each index as of stated date. Dow Jones Industrial 30        Opinions and estimates offered constitute our judgment and are subject to change without notice, as are
(The Dow Jones is a price-weighted index composing of 30 widely-traded blue chip stocks.): IDC, S&P 500           statements of financial market trends, which are based on current market conditions. We believe the
Index (The S&P 500 Index is widely regarded as the best single gauge of the U.S. equities market, this            information provided here is reliable, but do not warrant its accuracy or completeness. This material is not
world-renowned index includes a representative sample of 500 leading companies in leading industries of           intended as an offer or solicitation for the purchase or sale of any financial instrument. The views and
the U.S. economy. Although the S&P 500 focuses on the large-cap segment of the market, with                       strategies described may not be suitable for all investors. This material has been prepared for
approximately 75% coverage of U.S. equities, it is also an ideal proxy for the total market.): IDC, NASDAQ        informational purposes only, and is not intended to provide, and should not be relied on for, accounting,
Composite Index (The NASDAQ Index is a market-value weighted index of all common stocks listed on the             legal or tax advice. References to future returns are not promises or even estimates of actual returns a
NASDAQ stock exchange.): IDC, Russell 2000 Index: IDC. Indexes are not available for direct investment.           client portfolio may achieve. Any forecasts contained herein are for illustrative purposes only and are not
S&P Index Characteristics: Trailing P/E price is provided by Factset Pricing database while trailing earnings     to be relied upon as advice or interpreted as a recommendation.
is provided by Compustat. Dividend Yield provided by FactSet Pricing database. Fwd. P/E is a bottom-up            The price of equity securities may rise, or fall because of changes in the broad market or changes in a
weighted Harmonic average using First Call Mean estimates for the "Next 12 Months" (NTM) period.                  company's financial condition, sometimes rapidly or unpredictably. International investing involves a
Marketcap is a bottom-up weighted average based on share information from Compustat and Price                     greater degree of risk and increased volatility. There is no guarantee that companies that can issue
information from FactSet's Pricing database as provided by Standard & Poor's.                                     dividends will declare, continue to play, or increase dividends. Investments in commodities may have
Russell 1000 Value Index, Russell 1000 Growth Index, and Russell 2000 Index Characteristics: Trailing P/E         greater volatility than investments in traditional securities, particularly if the instruments involve leverage.
is provided directly by Russell. Fwd. P/E is a bottom-up weighted harmonic average using First Call Mean          J.P. Morgan Asset Management is the marketing name for the asset management businesses of JPMorgan
estimates for the "Next 12 Months" (NTM) period. Marketcap is a bottom-up weighted average based on               Chase & Co. Those businesses include, but are not limited to, J.P. Morgan Investment Management Inc.,
share information from Compustat and Price information from FactSet's Pricing database as provided by             Security Capital Research & Management Incorporated and J.P. Morgan Alternative Asset Management,
Russell.                                                                                                          Inc.
Sector Returns: Sectors are based on the GICS Classification model. Return data are calculated by FactSet         JPMorgan Distribution Services, Inc., member FINRA/SIPC
using constituents and weights as provided by Standard & Poor’s. Returns are cumulative total return for
                                                                                                                  © JPMorgan Chase & Co., December 2012.
stated period, including reinvestment of dividends.
                                                                                                                  Unless otherwise stated, all data is as of December 7, 2012 or as of most recently available.
Style Returns: Style box returns based on Russell Indexes with the exception of the Large-Cap Blend box,
which reflects the S&P 500 Index. All values are cumulative total return for stated period including the


 NOT FDIC INSURED | NO BANK GUARANTEE | MAY LOSE VALUE

More Related Content

What's hot

First powerpoint to
First powerpoint to First powerpoint to
First powerpoint to collincooke
 
Perini 2007_Annual_Report
Perini 2007_Annual_ReportPerini 2007_Annual_Report
Perini 2007_Annual_Reportfinance50
 
anheuser-busch BUD07_Annual_Report_SuppFinInfo
anheuser-busch BUD07_Annual_Report_SuppFinInfoanheuser-busch BUD07_Annual_Report_SuppFinInfo
anheuser-busch BUD07_Annual_Report_SuppFinInfofinance15
 
Ecolab2005AR
Ecolab2005AREcolab2005AR
Ecolab2005ARfinance37
 
Spring 77386 Real Estate Sales REport | November 2012
Spring 77386 Real Estate Sales REport | November 2012Spring 77386 Real Estate Sales REport | November 2012
Spring 77386 Real Estate Sales REport | November 2012Ken Brand
 
2020 technologies annual report 2009
2020 technologies annual report 20092020 technologies annual report 2009
2020 technologies annual report 200920-20 Technologies
 
Q1 2009 Earning Report of Smith International, Inc.
Q1 2009 Earning Report of Smith International, Inc. Q1 2009 Earning Report of Smith International, Inc.
Q1 2009 Earning Report of Smith International, Inc. earningreport earningreport
 
southern 2007 Narrative Section
southern 2007 Narrative Sectionsouthern 2007 Narrative Section
southern 2007 Narrative Sectionfinance17
 
erie insurance group 2003-annual-report
erie insurance group 2003-annual-reporterie insurance group 2003-annual-report
erie insurance group 2003-annual-reportfinance49
 
Future venture autosave (1)
Future venture autosave (1)Future venture autosave (1)
Future venture autosave (1)dupatta
 
Excel chartslesson8andsurvey h.t.
Excel chartslesson8andsurvey h.t.Excel chartslesson8andsurvey h.t.
Excel chartslesson8andsurvey h.t.hat46
 
Progressive 2006review
 Progressive 2006review Progressive 2006review
Progressive 2006reviewfinance18
 
kelly services annual reports 2001
kelly services  annual reports 2001kelly services  annual reports 2001
kelly services annual reports 2001finance36
 

What's hot (14)

First powerpoint to
First powerpoint to First powerpoint to
First powerpoint to
 
Perini 2007_Annual_Report
Perini 2007_Annual_ReportPerini 2007_Annual_Report
Perini 2007_Annual_Report
 
anheuser-busch BUD07_Annual_Report_SuppFinInfo
anheuser-busch BUD07_Annual_Report_SuppFinInfoanheuser-busch BUD07_Annual_Report_SuppFinInfo
anheuser-busch BUD07_Annual_Report_SuppFinInfo
 
Ecolab2005AR
Ecolab2005AREcolab2005AR
Ecolab2005AR
 
timken
timkentimken
timken
 
Spring 77386 Real Estate Sales REport | November 2012
Spring 77386 Real Estate Sales REport | November 2012Spring 77386 Real Estate Sales REport | November 2012
Spring 77386 Real Estate Sales REport | November 2012
 
2020 technologies annual report 2009
2020 technologies annual report 20092020 technologies annual report 2009
2020 technologies annual report 2009
 
Q1 2009 Earning Report of Smith International, Inc.
Q1 2009 Earning Report of Smith International, Inc. Q1 2009 Earning Report of Smith International, Inc.
Q1 2009 Earning Report of Smith International, Inc.
 
southern 2007 Narrative Section
southern 2007 Narrative Sectionsouthern 2007 Narrative Section
southern 2007 Narrative Section
 
erie insurance group 2003-annual-report
erie insurance group 2003-annual-reporterie insurance group 2003-annual-report
erie insurance group 2003-annual-report
 
Future venture autosave (1)
Future venture autosave (1)Future venture autosave (1)
Future venture autosave (1)
 
Excel chartslesson8andsurvey h.t.
Excel chartslesson8andsurvey h.t.Excel chartslesson8andsurvey h.t.
Excel chartslesson8andsurvey h.t.
 
Progressive 2006review
 Progressive 2006review Progressive 2006review
Progressive 2006review
 
kelly services annual reports 2001
kelly services  annual reports 2001kelly services  annual reports 2001
kelly services annual reports 2001
 

Viewers also liked

γυναίκα ιχθύς ραντεβού με άντρα σκορπιό
γυναίκα ιχθύς ραντεβού με άντρα σκορπιόγυναίκα ιχθύς ραντεβού με άντρα σκορπιό
γυναίκα ιχθύς ραντεβού με άντρα σκορπιόzwdia
 
Cisco ios (1)
Cisco ios (1)Cisco ios (1)
Cisco ios (1)kashi4583
 
STEAM POWER PLANT
STEAM POWER PLANTSTEAM POWER PLANT
STEAM POWER PLANTNAGARAJ051
 
Md kecurian chromebook
Md kecurian chromebookMd kecurian chromebook
Md kecurian chromebookpqa1005
 
Ukraine and crimea a safe place to live – my soul repose
Ukraine and crimea a safe place to live – my soul reposeUkraine and crimea a safe place to live – my soul repose
Ukraine and crimea a safe place to live – my soul reposemysoulrepose
 
Thriving veggies one pager
Thriving veggies one pagerThriving veggies one pager
Thriving veggies one pagerCraig Ellis
 
Missão 13 Maio 2014
Missão 13 Maio 2014Missão 13 Maio 2014
Missão 13 Maio 2014Fabiano Brito
 

Viewers also liked (15)

Issuu
Issuu Issuu
Issuu
 
γυναίκα ιχθύς ραντεβού με άντρα σκορπιό
γυναίκα ιχθύς ραντεβού με άντρα σκορπιόγυναίκα ιχθύς ραντεβού με άντρα σκορπιό
γυναίκα ιχθύς ραντεβού με άντρα σκορπιό
 
Cisco ios (1)
Cisco ios (1)Cisco ios (1)
Cisco ios (1)
 
STEAM POWER PLANT
STEAM POWER PLANTSTEAM POWER PLANT
STEAM POWER PLANT
 
Job advert
Job advertJob advert
Job advert
 
Plano capaens religioso
Plano capaens religiosoPlano capaens religioso
Plano capaens religioso
 
Finalaya daily wrap_14may2014
Finalaya daily wrap_14may2014Finalaya daily wrap_14may2014
Finalaya daily wrap_14may2014
 
1
11
1
 
Md kecurian chromebook
Md kecurian chromebookMd kecurian chromebook
Md kecurian chromebook
 
G325 1a resesearch and planning
G325 1a resesearch and planningG325 1a resesearch and planning
G325 1a resesearch and planning
 
Sena
SenaSena
Sena
 
Ukraine and crimea a safe place to live – my soul repose
Ukraine and crimea a safe place to live – my soul reposeUkraine and crimea a safe place to live – my soul repose
Ukraine and crimea a safe place to live – my soul repose
 
Thriving veggies one pager
Thriving veggies one pagerThriving veggies one pager
Thriving veggies one pager
 
cv_grafico
cv_graficocv_grafico
cv_grafico
 
Missão 13 Maio 2014
Missão 13 Maio 2014Missão 13 Maio 2014
Missão 13 Maio 2014
 

Similar to Weekly Market Recap: Stocks Rise Despite Fiscal Cliff Uncertainty

Personal Financial Intelligence by Uwamai Igein
Personal Financial Intelligence by Uwamai IgeinPersonal Financial Intelligence by Uwamai Igein
Personal Financial Intelligence by Uwamai Igeinuwade
 
Apresentação do evento santander securities – 17 e 18052010
Apresentação do evento santander securities – 17 e 18052010Apresentação do evento santander securities – 17 e 18052010
Apresentação do evento santander securities – 17 e 18052010risantander
 
Credit suisse event_presentation
Credit suisse event_presentationCredit suisse event_presentation
Credit suisse event_presentationrisantander
 
MacMedia - Tollgate 2
MacMedia - Tollgate 2MacMedia - Tollgate 2
MacMedia - Tollgate 2quirozlf
 
Ar welcome - exploring alternative sources of income - 06 08 12
Ar   welcome - exploring alternative sources of income - 06 08 12Ar   welcome - exploring alternative sources of income - 06 08 12
Ar welcome - exploring alternative sources of income - 06 08 12alanreid
 
August markets perspectives
August markets perspectivesAugust markets perspectives
August markets perspectivesFincor Corretora
 
Fincor: Perspectivas mercados financeiros Agosto
Fincor: Perspectivas mercados financeiros AgostoFincor: Perspectivas mercados financeiros Agosto
Fincor: Perspectivas mercados financeiros AgostoJoão Pinto
 
77354 november 2012 market report collection
77354 november 2012 market report collection77354 november 2012 market report collection
77354 november 2012 market report collectionsfinley2388
 
Real Estate Magnolia | Market Report Nov. 2012
Real Estate Magnolia | Market Report Nov. 2012Real Estate Magnolia | Market Report Nov. 2012
Real Estate Magnolia | Market Report Nov. 2012Tanya Lavoie Bugbee
 
77354 november 2012 market report collection
77354 november 2012 market report collection77354 november 2012 market report collection
77354 november 2012 market report collectionsfinley2388
 
Magnolia TX 77354 | Real Estate Home Sales Report
Magnolia TX 77354 | Real Estate Home Sales ReportMagnolia TX 77354 | Real Estate Home Sales Report
Magnolia TX 77354 | Real Estate Home Sales ReportKen Brand
 
Business Plan Preparation - X-Lint
Business Plan Preparation - X-LintBusiness Plan Preparation - X-Lint
Business Plan Preparation - X-LintBrennan Meadowcroft
 
World Leaders Brochure
World Leaders BrochureWorld Leaders Brochure
World Leaders Brochurejuanroi5001
 
Magnolia Real Estate Report 2012
Magnolia Real Estate Report 2012Magnolia Real Estate Report 2012
Magnolia Real Estate Report 2012Tanya Lavoie Bugbee
 
MacMedia - Tollgate 3
MacMedia - Tollgate 3MacMedia - Tollgate 3
MacMedia - Tollgate 3quirozlf
 
Financial analysis paladin energy ltd - paladin energy limited primarily ex...
Financial analysis   paladin energy ltd - paladin energy limited primarily ex...Financial analysis   paladin energy ltd - paladin energy limited primarily ex...
Financial analysis paladin energy ltd - paladin energy limited primarily ex...BCV
 
Consolidated Customer Financials072908 Sample
Consolidated Customer Financials072908  SampleConsolidated Customer Financials072908  Sample
Consolidated Customer Financials072908 Samplewcampagn
 

Similar to Weekly Market Recap: Stocks Rise Despite Fiscal Cliff Uncertainty (20)

Personal Financial Intelligence by Uwamai Igein
Personal Financial Intelligence by Uwamai IgeinPersonal Financial Intelligence by Uwamai Igein
Personal Financial Intelligence by Uwamai Igein
 
Apresentação do evento santander securities – 17 e 18052010
Apresentação do evento santander securities – 17 e 18052010Apresentação do evento santander securities – 17 e 18052010
Apresentação do evento santander securities – 17 e 18052010
 
Credit suisse event_presentation
Credit suisse event_presentationCredit suisse event_presentation
Credit suisse event_presentation
 
MacMedia - Tollgate 2
MacMedia - Tollgate 2MacMedia - Tollgate 2
MacMedia - Tollgate 2
 
Ar welcome - exploring alternative sources of income - 06 08 12
Ar   welcome - exploring alternative sources of income - 06 08 12Ar   welcome - exploring alternative sources of income - 06 08 12
Ar welcome - exploring alternative sources of income - 06 08 12
 
August markets perspectives
August markets perspectivesAugust markets perspectives
August markets perspectives
 
Fincor: Perspectivas mercados financeiros Agosto
Fincor: Perspectivas mercados financeiros AgostoFincor: Perspectivas mercados financeiros Agosto
Fincor: Perspectivas mercados financeiros Agosto
 
77354 november 2012 market report collection
77354 november 2012 market report collection77354 november 2012 market report collection
77354 november 2012 market report collection
 
Real Estate Magnolia | Market Report Nov. 2012
Real Estate Magnolia | Market Report Nov. 2012Real Estate Magnolia | Market Report Nov. 2012
Real Estate Magnolia | Market Report Nov. 2012
 
77354 november 2012 market report collection
77354 november 2012 market report collection77354 november 2012 market report collection
77354 november 2012 market report collection
 
Magnolia TX 77354 | Real Estate Home Sales Report
Magnolia TX 77354 | Real Estate Home Sales ReportMagnolia TX 77354 | Real Estate Home Sales Report
Magnolia TX 77354 | Real Estate Home Sales Report
 
Business Plan Preparation - X-Lint
Business Plan Preparation - X-LintBusiness Plan Preparation - X-Lint
Business Plan Preparation - X-Lint
 
World Leaders Brochure
World Leaders BrochureWorld Leaders Brochure
World Leaders Brochure
 
77354 real estate market report october 2012 magnolia tx
77354 real estate market report october 2012 magnolia tx77354 real estate market report october 2012 magnolia tx
77354 real estate market report october 2012 magnolia tx
 
Magnolia Real Estate Report 2012
Magnolia Real Estate Report 2012Magnolia Real Estate Report 2012
Magnolia Real Estate Report 2012
 
MacMedia - Tollgate 3
MacMedia - Tollgate 3MacMedia - Tollgate 3
MacMedia - Tollgate 3
 
Financial analysis paladin energy ltd - paladin energy limited primarily ex...
Financial analysis   paladin energy ltd - paladin energy limited primarily ex...Financial analysis   paladin energy ltd - paladin energy limited primarily ex...
Financial analysis paladin energy ltd - paladin energy limited primarily ex...
 
Apre 4 t08
Apre 4 t08Apre 4 t08
Apre 4 t08
 
Daily equity-report
Daily equity-reportDaily equity-report
Daily equity-report
 
Consolidated Customer Financials072908 Sample
Consolidated Customer Financials072908  SampleConsolidated Customer Financials072908  Sample
Consolidated Customer Financials072908 Sample
 

Weekly Market Recap: Stocks Rise Despite Fiscal Cliff Uncertainty

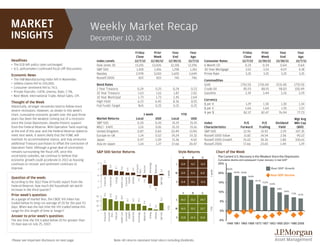
  • 1. MARKET Weekly Market Recap INSIGHTS December 10, 2012 Friday Prior Year Year Friday Prior Year Year Close Week End Ago Close Week End Ago Headlines Index Levels 12/7/12 11/30/12 12/30/11 12/7/11 Consumer Rates 12/7/12 11/30/12 12/30/11 12/7/11 • The ECB left policy rates unchanged. Dow Jones 30 13,155 13,026 12,218 12,196 6 Month CD 0.33 0.34 0.64 0.64 • U.S. policymakers continued fiscal cliff discussions. S&P 500 1,418 1,416 1,258 1,261 30 Year Mortgage 3.52 3.53 4.07 4.18 Economic News Nasdaq 2,978 3,010 2,605 2,649 Prime Rate 3.25 3.25 3.25 3.25 • The ISM Manufacturing index fell in November. Russell 2000 822 822 741 746 Commodities • Jobless claims fell to 370,000. Bond Rates Gold 1701.50 1726.00 1531.00 1735.50 • Consumer sentiment fell to 74.5. 2 Year Treasury 0.24 0.25 0.24 0.23 Crude Oil 85.93 88.91 98.83 100.49 • Private Payrolls: +147K; Unemp. Rate: 7.7%. 10 Year Treasury 1.63 1.61 1.87 2.02 Gasoline 3.39 3.44 3.26 3.29 • Next Week: International Trade, Retail Sales, CPI. 10 Year Municipal 1.73 1.73 2.45 2.64 High Yield 6.23 6.45 8.36 8.55 Currency Thought of the Week $ per € 1.29 1.30 1.30 1.34 Historically, stronger recoveries tend to follow more Fed Funds Target N/A 0.25 0.25 0.25 $ per £ 1.60 1.60 1.55 1.57 severe recessions. However, as shown in this week’s ¥ per $ 82.37 82.47 76.94 77.73 chart, cumulative economic growth over the past three 1 week YTD years has been the weakest coming out of a recession Market Returns Local USD Local USD Wgt Avg since the Great Depression, despite historic support S&P 500 0.20 0.20 15.19 15.19 Index P/E P/E Dividend Mkt Cap from the Federal Reserve. With Operation Twist expiring MSCI - EAFE 1.01 0.81 15.33 15.16 Characteristics Forward Trailing Yield (Bill) at the end of this year and the Federal Reserve slated to United Kingdom 0.87 0.83 10.49 13.90 S&P 500 12.92 15.92 2.29 107.35 meet next week, it seems likely that the FOMC will Europe ex-UK 1.14 0.52 19.24 19.32 Russell 1000 Value 11.82 14.54 2.56 90.22 maintain its accommodative stance, and may announce Japan 0.97 1.09 11.36 4.02 Russell 1000 Growth 15.02 18.36 1.80 100.61 additional Treasury purchases to offset the conclusion of Asia ex-Japan 1.14 1.27 17.66 20.47 Russell 2000 17.66 23.65 1.49 1.29 Operation Twist. Although a great deal of uncertainty remains surrounding the fiscal cliff, once this S&P 500 Sector Returns Style Returns Chart of the Week uncertainty subsides, we continue to believe that V B G The Current U.S. Recovery is the Weakest Since the Depression economic growth could accelerate in 2013 as housing Cumulative decline and subsequent 3-year recovery in real GDP 1.7 continues to recover and sentiment continues to 2 L 0.9 0.2 -0.5 25% Technology Consumer Materials 0.9 Telecom 0.7 improve. Real GDP Growth 0.6 0.4 0.4 1 20.2% Discr. 0.2 1 week 1 week M 0.9 0.4 0.0 20% 18.5% 18.4% 0 16.4% Real GDP Decline Question of the week: Financials Industrials Energy Health Care Consumer Staples Utilities S&P 500 -0.2 -0.4 14.1% According to the 3Q12 Flow of Funds report from the -1 S 0.4 0.1 -0.3 15% 13.2% 12.4% Federal Reserve, how much did household net worth -1.4 -2 9.8% -1.8 increase in the third quarter? V B G 10% 8.4% 7.3% Prior week's question: 25.1 23.0 6.7% 30 19.0 18.9 As a gauge of market fear, the CBOE VIX Index has 15.2 L 16.2 15.2 14.7 13.7 13.5 13.3 20 5% 9.4 traded below its long run average of 20 for the past 93 4.7 10 days. When was the last time the VIX traded below this 1.6 YTD YTD M 16.5 15.2 13.7 range for this length of time or longer? 0 0% Financials Consumer Discr. Telecom Health Care Consumer Staples Industrials Technology Materials Energy Utilities S&P 500 Answer to prior week's question: S 13.8 12.4 11.0 The last time the VIX traded below 20 for greater than -5% 93 days was on July 25, 2007. 1948 1981 1960 1969 1973 1957 1953 1990 2001 1980 2008 Please see important disclosure on next page. Note: All returns represent total return including dividends.
  • 2. MARKET Weekly Market Recap | December 10, 2012 INSIGHTS Chart of the Week: Source: BEA, NBER, J.P. Morgan Asset Management. reinvestment of dividends. The Index used from L to R, top to bottom are: S&P 500 Index (Index represents Thought of the Week: Source: BEA, NBER, Federal Reserve, J.P. Morgan Asset Management. the 500 Large Cap portion of the stock market, and is comprised of 500 stocks as selected by the S&P Index Committee), Russell 1000 Value Index (Measures the performance of those Russell 1000 companies Question of the Week: Source: Federal Reserve, J.P. Morgan Asset Management. with lower price-to-book ratios and lower forecasted growth values), Russell 1000 Growth Index (Measures Market Returns: All data represents total return including the reinvestment of dividends for stated period. the performance of those Russell 1000 companies with higher price-to-book ratios and higher forecasted Index: MSCI – EAFE; provided by: MSCI – gross official pricing. Index: UK; provided by: MSCI – gross official growth values), Russell Mid Cap Value Index (Measures the performance of those Russell Mid Cap pricing. Index: Europe ex-UK; provided by: MSCI – gross official pricing. Index: Japan; provided by: MSCI – companies with lower price-to-book ratios and lower forecasted growth values), Russell Mid Cap Index gross official pricing. Index: Asia ex-Japan; provided by: MSCI – gross official pricing. Index: S&P 500 Index; (The Russell Midcap Index includes the smallest 800 securities in the Russell 1000), Russell Mid Cap provided by: IDC. Growth Index (Measures the performance of those Russell Mid Cap companies with higher price-to-book (MSCI EAFE is a Morgan Stanley Capital International Index that is designed to measure the performance of ratios and higher forecasted growth values), Russell 2000 Value Index (Measures the performance of the developed stock markets of Europe, Australia, and the Far East). those Russell 2000 companies with lower price-to-book ratios and lower forecasted growth values), Russell 2000 Index (The Russell 2000 includes the smallest 2000 securities in the Russell 3000), Russell Dow Jones-UBS Commodity Index (DJ-UBSCI) is a broadly diversified index composed of futures contracts 2000 Growth Index (Measures the performance of those Russell 2000 companies with higher price-to- on physical commodities. The index is designed to minimize concentration in any one commodity or sector. book ratios and higher forecasted growth values). It includes 19 commodity futures in five groups. Contact JPMorgan Distribution Services, Inc. at 1-800-480-4111 for a fund prospectus. You can Bond Rates: Fed Funds Target, EcoWin; 2 Year Treasury, IDC; 10 Year Treasury, IDC; 10 Year Muni, Barclays also visit us at www.jpmorganfunds.com. Investors should carefully consider the investment Capital; High Yield, Barclays Capital High-yield Index. objectives and risks as well as charges and expenses of the mutual fund before investing. The Consumer Rates: 6 Month CD, Federal Reserve; 30 Year Mortgage, Mortgage Bankers Association (MBA); prospectus contains this and other information about the mutual fund. Read the prospectus Prime Rate: Federal Reserve. carefully before investing. Commodities: Gold, EcoWin; Crude Oil (WTI), EcoWin; Gasoline, EcoWin. Past performance does not guarantee future results. Currency: Dollar per Pound, IDC; Dollar per Euro, IDC; Yen per Dollar, IDC. Diversification does not guarantee investment returns and does not eliminate the risk of loss. Index Price Levels: Reflects closing price level for each index as of stated date. Dow Jones Industrial 30 Opinions and estimates offered constitute our judgment and are subject to change without notice, as are (The Dow Jones is a price-weighted index composing of 30 widely-traded blue chip stocks.): IDC, S&P 500 statements of financial market trends, which are based on current market conditions. We believe the Index (The S&P 500 Index is widely regarded as the best single gauge of the U.S. equities market, this information provided here is reliable, but do not warrant its accuracy or completeness. This material is not world-renowned index includes a representative sample of 500 leading companies in leading industries of intended as an offer or solicitation for the purchase or sale of any financial instrument. The views and the U.S. economy. Although the S&P 500 focuses on the large-cap segment of the market, with strategies described may not be suitable for all investors. This material has been prepared for approximately 75% coverage of U.S. equities, it is also an ideal proxy for the total market.): IDC, NASDAQ informational purposes only, and is not intended to provide, and should not be relied on for, accounting, Composite Index (The NASDAQ Index is a market-value weighted index of all common stocks listed on the legal or tax advice. References to future returns are not promises or even estimates of actual returns a NASDAQ stock exchange.): IDC, Russell 2000 Index: IDC. Indexes are not available for direct investment. client portfolio may achieve. Any forecasts contained herein are for illustrative purposes only and are not S&P Index Characteristics: Trailing P/E price is provided by Factset Pricing database while trailing earnings to be relied upon as advice or interpreted as a recommendation. is provided by Compustat. Dividend Yield provided by FactSet Pricing database. Fwd. P/E is a bottom-up The price of equity securities may rise, or fall because of changes in the broad market or changes in a weighted Harmonic average using First Call Mean estimates for the "Next 12 Months" (NTM) period. company's financial condition, sometimes rapidly or unpredictably. International investing involves a Marketcap is a bottom-up weighted average based on share information from Compustat and Price greater degree of risk and increased volatility. There is no guarantee that companies that can issue information from FactSet's Pricing database as provided by Standard & Poor's. dividends will declare, continue to play, or increase dividends. Investments in commodities may have Russell 1000 Value Index, Russell 1000 Growth Index, and Russell 2000 Index Characteristics: Trailing P/E greater volatility than investments in traditional securities, particularly if the instruments involve leverage. is provided directly by Russell. Fwd. P/E is a bottom-up weighted harmonic average using First Call Mean J.P. Morgan Asset Management is the marketing name for the asset management businesses of JPMorgan estimates for the "Next 12 Months" (NTM) period. Marketcap is a bottom-up weighted average based on Chase & Co. Those businesses include, but are not limited to, J.P. Morgan Investment Management Inc., share information from Compustat and Price information from FactSet's Pricing database as provided by Security Capital Research & Management Incorporated and J.P. Morgan Alternative Asset Management, Russell. Inc. Sector Returns: Sectors are based on the GICS Classification model. Return data are calculated by FactSet JPMorgan Distribution Services, Inc., member FINRA/SIPC using constituents and weights as provided by Standard & Poor’s. Returns are cumulative total return for © JPMorgan Chase & Co., December 2012. stated period, including reinvestment of dividends. Unless otherwise stated, all data is as of December 7, 2012 or as of most recently available. Style Returns: Style box returns based on Russell Indexes with the exception of the Large-Cap Blend box, which reflects the S&P 500 Index. All values are cumulative total return for stated period including the NOT FDIC INSURED | NO BANK GUARANTEE | MAY LOSE VALUE