ECG
•Download as PPTX, PDF•
2 likes•619 views

The ECG records the depolarization and repolarization potentials generated by the atrial and ventricular myocardium over time. It shows: - Atrial depolarization as the P wave - Ventricular depolarization as the QRS complex - Ventricular repolarization as the ST segment, T wave, and U wave.

Recommended
More Related Content
What's hot
What's hot (20)
Viewers also liked
Similar to ECG
Similar to ECG (20)
More from Rajendran Surendran
More from Rajendran Surendran (15)
Recently uploaded
Recently uploaded (20)
ECG
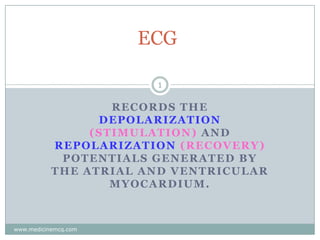
- 1. ECG 1 RECORDS THE DEPOLARIZATION (STIMULATION) AND REPOLARIZATION (RECOVERY) POTENTIALS GENERATED BY THE ATRIAL AND VENTRICULAR MYOCARDIUM. www.medicinemcq.com
- 4. ECG graph paper 4 Horizontal axis Records the time (interval) between cardiac electrical events Vertical axis Records their amplitude (voltage) www.medicinemcq.com
- 6. Horizontal divisions 6 Smallest (1 mm) 0.04 s (40 ms). Heavier lines 0.20 www.medicinemcq.com s (200 ms).
- 7. Amplitude 7 1 mV = 10 mm with standard calibration. www.medicinemcq.com
- 8. Q wave 8 The first negative QRS deflection www.medicinemcq.com
- 9. R wave 9 First positive deflection www.medicinemcq.com
- 10. S wave 10 Negative deflection after an R wave. www.medicinemcq.com
- 11. QS wave 11 Entirely negative QRS complex Lowercase letters (qrs) For waves of relatively small amplitude. www.medicinemcq.com
- 12. QRS complex 12 Ventricular depolarization. www.medicinemcq.com
- 13. Phase 0 or depolarization 13 Rapid upstroke of the action potential Corresponds to the onset of QRS. www.medicinemcq.com
- 15. Phase 2 15 Plateau phase Corresponds to the isoelectric ST segment. www.medicinemcq.com
- 17. Ventricular repolarization 17 ST segment, T wave, and U wave. www.medicinemcq.com
- 18. Atrial repolarization 18 Usually too low in amplitude to be detected. Obscured by QRS (i.e., ventricular depolarization). May be apparent in Acute pericarditis Atrial infarction. Atrial depolarization causes P wave. www.medicinemcq.com
- 19. Summary 19 Atrial depolarization P wave. Ventricular depolarization QRS complex Ventricular repolarization ST segment, T wave, and U wave. www.medicinemcq.com
- 20. ECG waves 20 P Atrial depolarization. R Ventricular depolarization and atrial repolarization. QRS complex Ventricular depolarization ST - T - U complex Ventricular repolarization www.medicinemcq.com
- 21. Unipolar recording 21 Use only 1 active electrode. www.medicinemcq.com
- 22. Bipolar recording 22 Use 2 active electrodes. www.medicinemcq.com
- 23. Bipolar lead 23 Measures the difference in potential between electrodes at two extremities Lead I = left arm-right arm voltages Lead II = left leg-right arm Lead III = left leg-left arm. www.medicinemcq.com
- 25. Standard limb leads 25 I, II, and III are bipolar leads Record the differences in potential between 2 limbs. www.medicinemcq.com
- 26. Lead I 26 Between left arm and right arm with left arm +. www.medicinemcq.com
- 27. Lead II 27 Between left leg and right arm with leg +. www.medicinemcq.com
- 28. Lead III 28 Between left leg and left arm with leg +. www.medicinemcq.com
- 29. V 1 to V 6 29 6 unipolar chest leads or precordial leads. www.medicinemcq.com
- 30. 3 augmented unipolar limb leads 30 avL, avR, and avF. Recordings between one limb and the other 2 limbs. Increases the size of the potentials by 50 %. www.medicinemcq.com
- 31. Positive deflection 31 Upright deflection For rest of the slides visit www.medicinemcq.com > Cardiology www.medicinemcq.com