SlideShare a Scribd company logo
1 of 17
What’s Your Favourite Colour?
Pink, 1

Burgundy, 1

Red, 7
Purple, 5

Blue, 9

Black, 4

Yellow, 1
Green`, 1

The most popular
colours that public has
chosen is blue and red.
The least popular
colours are
yellow, green, burgundy
and pink. Therefore we
will be incorporating
blue and red in to the
colour scheme of our
graphics in our
documentary.
Are You Male or Female?
Gender
18
16

16

14
12

13

10

Male

8

Female

6
4
2

0
Male

Female

This data shows that
the people that
answered
questionnaires were
mainly female but
there was also a high
amount of males so
we will aim our
documentary at both
genders.
How old are you?
12
10

8

10
8
7

6

16
17
18

4

18+

4

2

0
16

17

18

18+

This data shows that
the people that the
age range in this
questionnaire is
ranged between
teens and adults so
this is the age range
we will base our
documentary
around.
How much TV do you watch a week?
12
10

10

8
1 to 5
6

6
5

4
2

0
6 to 10

11 to 15
16 to 20

2
1 to 5

6 to 10

11 to 15

16 to 20

This data shows that
most people watch
TV for 1-5 hours a
week.
What time do you usually watch TV?
Series 1
30
25
20
15
10
5
0

25

Morning (Before
12)
Afternoon (1 till 5)

1

2

1

Evening
None
What type of TV Channels do you
watch?
Sky 1
4, 14%
ITV
6, 21%

Sports
3, 10%

Channel 4
11, 38%

BBC 1
5, 17%

This data shows that most
people that answered this
questionnaire watch
Channel 4 and ITV. We will
be using this data to
schedule our documentary
and we will be scheduling
our programme will be on
Channel 4.
What genres of music do you like?
Dance
4, 12%

Rock
4, 12%

Hip Hop
2, 8%

Alt. Punk
3%

RNB
4, 12%
Hardcore
Metal 3%
3, 9%
Indie
5, 14%

Pop
4, 12%

Classic
1, 3%

Alternative
1, 3%
Dubstep
1, 3%

The most popular
genre of music in
this survey is
Rock, this is the
genre of music we
will be using in our
documentary to
represent body art.
Do you have any Tattoos?
20
18

19

16
14
12
10
8

Yes

10

No

6
4
2

0
Yes

No

These results show
that more people
have not got tattoos
that answered this
questionnaire than
people that do but
there is still a high
number so we will
aim our programme
at both people who
have them and
people who are
interested in body
art.
Do you have any piercings?
18
16

17

14

12

12

10
8
6
4
2

0
Yes

No

These results show
that more people
have piercings than
people that didn’t.
There is still a high
number so we will
Yes aim our programme
No at both people who
have them and
people who are
interested in body
art.
How much would you spend on a
tattoo?
Column1
81 to 100
10%

100 +
10%

1 to 20
21%

61 to 80
7%
41 to 60
17%

21 to 40
35%

These results show that
people are willing to
spend a lot of money to
get a tattoo but the most
popular price in this
survey is £21 to £40.
How much would you spend on a
piercing?
5
4.5
4

4.3

3.5

3.5

3
2.5
2

These answers show
that the highest
amounts for
piercings is the
lowest amount and
the highest showing
that people are
willing to spend a
range of amounts for
body art. We will be
discussing this in our
documentary with
our interviewees.

4.5

2.5

1.5
1

0.5
0
£1 to £20 £21 to
£40

£41 to
£60

£61 to
£80

£81 to
£100

100+
Scale of 1-5 In your opinion how much
would getting a tattoo hurt? (1 – No
Pain, 5 – Very Painful)
12
10

10

8
6
4

6
5

5
3

2
0
1

2

3

4

5

These results show that
the pain to get a tattoo
would be a medium
amount, we will be using
these results as a topic of
discussion in our
documentary.
Do You Think that Tattoos should have
a meaning behind them?
No
10
34%

Yes
19
66%

These results show that
most people believe that
tattoos should have a
meaning behind them. We
will be using this as a main
topic in our documentary.
Does your Tattoo have a meaning
behind it?
These results show that most
people that have tattoos
have a meaning behind
them.

Yes
6, 10%

Don’t
have one
19, 83%

No
4, 7%
What’s Your Opinion on Tattoos?
16
14

15

12
10
8
7

6

7

Dislike

Sometimes
like

4
2
0
Like

These results show that
most of the people we
asked like tattoos and we
will be discussing with the
public their opinions on
tattoos.
What’s Your Opinion on Piercings?
16

14

15

12
10

10

8
6
4

4

2

0
Like

Dislike

Sometimes

These results show that
most of the people we
asked like piercings and
we will be discussing
this topic with the
public.
Do You Do Your Own Tattoos or
Piercings?
Yes
2

No
27

Most of the people that
answered this survey do
not do their own
tattoos or piercings so
they must get them
done professionally, we
will be discussing this
with the public.

More Related Content

Similar to Questionnaire conclusion

Questionnaire Analysis
Questionnaire AnalysisQuestionnaire Analysis
Questionnaire Analysisdemibeardmore
 
Questionnaire analysis
Questionnaire analysisQuestionnaire analysis
Questionnaire analysiscassierattray
 
Documentary research
Documentary researchDocumentary research
Documentary researchTajmina Ali
 
Questionnaire results
Questionnaire resultsQuestionnaire results
Questionnaire resultsmn04809904
 
Questionnaire results
Questionnaire resultsQuestionnaire results
Questionnaire resultsninachapman99
 
Results Of Questionnaire
Results Of QuestionnaireResults Of Questionnaire
Results Of QuestionnaireDemiLamb
 
resultsResults of questionaire
resultsResults of questionaireresultsResults of questionaire
resultsResults of questionairehannahkenyon
 
Young Drivers Questionnaire Results
Young Drivers Questionnaire ResultsYoung Drivers Questionnaire Results
Young Drivers Questionnaire ResultsCharleyMartin95
 
Questionnaire results
Questionnaire resultsQuestionnaire results
Questionnaire resultsstelloyd386
 
Audience Research Chart Analysis
Audience Research Chart AnalysisAudience Research Chart Analysis
Audience Research Chart Analysisdanielleedaviess
 
Questionnaire analysis group doc final
Questionnaire analysis group doc finalQuestionnaire analysis group doc final
Questionnaire analysis group doc finalFreya Clerkin
 
Questionnaire analysis group doc final
Questionnaire analysis group doc finalQuestionnaire analysis group doc final
Questionnaire analysis group doc finallilycorcoranx
 
Audience Research Results Analysis
Audience Research Results AnalysisAudience Research Results Analysis
Audience Research Results Analysisdb04803167
 
Questionnaire analysis group doc
Questionnaire analysis group docQuestionnaire analysis group doc
Questionnaire analysis group docJames Hart-Davies
 

Similar to Questionnaire conclusion (20)

Questionnaire Analysis
Questionnaire AnalysisQuestionnaire Analysis
Questionnaire Analysis
 
Questionnaire analysis
Questionnaire analysisQuestionnaire analysis
Questionnaire analysis
 
Documentary research
Documentary researchDocumentary research
Documentary research
 
Questionnaire results
Questionnaire resultsQuestionnaire results
Questionnaire results
 
Questionnaire feedback analysis
Questionnaire feedback analysisQuestionnaire feedback analysis
Questionnaire feedback analysis
 
Questionnaire results
Questionnaire resultsQuestionnaire results
Questionnaire results
 
Chart analysis
Chart analysisChart analysis
Chart analysis
 
Results Of Questionnaire
Results Of QuestionnaireResults Of Questionnaire
Results Of Questionnaire
 
resultsResults of questionaire
resultsResults of questionaireresultsResults of questionaire
resultsResults of questionaire
 
Audience Research
Audience ResearchAudience Research
Audience Research
 
Young Drivers Questionnaire Results
Young Drivers Questionnaire ResultsYoung Drivers Questionnaire Results
Young Drivers Questionnaire Results
 
Questionnaire results
Questionnaire resultsQuestionnaire results
Questionnaire results
 
Questionnaire results
Questionnaire resultsQuestionnaire results
Questionnaire results
 
Audience Research Chart Analysis
Audience Research Chart AnalysisAudience Research Chart Analysis
Audience Research Chart Analysis
 
Questionnaire analysis group doc final
Questionnaire analysis group doc finalQuestionnaire analysis group doc final
Questionnaire analysis group doc final
 
Questionnaire analysis group doc final
Questionnaire analysis group doc finalQuestionnaire analysis group doc final
Questionnaire analysis group doc final
 
Chart analysis
Chart analysisChart analysis
Chart analysis
 
Audience Research Results Analysis
Audience Research Results AnalysisAudience Research Results Analysis
Audience Research Results Analysis
 
Grapppphs
GrapppphsGrapppphs
Grapppphs
 
Questionnaire analysis group doc
Questionnaire analysis group docQuestionnaire analysis group doc
Questionnaire analysis group doc
 

More from rachael_holding

What i need to include in my documentary
What i need to include in my documentaryWhat i need to include in my documentary
What i need to include in my documentaryrachael_holding
 
6) what have you learnt about technologies
6) what have you learnt about technologies6) what have you learnt about technologies
6) what have you learnt about technologiesrachael_holding
 
Anertations for double page spread
Anertations for double page spreadAnertations for double page spread
Anertations for double page spreadrachael_holding
 
Anertations for contents page
Anertations for contents pageAnertations for contents page
Anertations for contents pagerachael_holding
 
Anertations for cover page
Anertations for cover pageAnertations for cover page
Anertations for cover pagerachael_holding
 
Anertations for cover page
Anertations for cover pageAnertations for cover page
Anertations for cover pagerachael_holding
 
Magazine information powerpoint
Magazine information powerpointMagazine information powerpoint
Magazine information powerpointrachael_holding
 

More from rachael_holding (11)

What i need to include in my documentary
What i need to include in my documentaryWhat i need to include in my documentary
What i need to include in my documentary
 
Lara croft
Lara croftLara croft
Lara croft
 
6) what have you learnt about technologies
6) what have you learnt about technologies6) what have you learnt about technologies
6) what have you learnt about technologies
 
Question 2
Question 2Question 2
Question 2
 
Anertations for double page spread
Anertations for double page spreadAnertations for double page spread
Anertations for double page spread
 
Anertations for contents page
Anertations for contents pageAnertations for contents page
Anertations for contents page
 
Anertations for cover page
Anertations for cover pageAnertations for cover page
Anertations for cover page
 
Anertations for cover page
Anertations for cover pageAnertations for cover page
Anertations for cover page
 
Evaluation powerpoint
Evaluation powerpointEvaluation powerpoint
Evaluation powerpoint
 
Evaluation powerpoint
Evaluation powerpointEvaluation powerpoint
Evaluation powerpoint
 
Magazine information powerpoint
Magazine information powerpointMagazine information powerpoint
Magazine information powerpoint
 

Questionnaire conclusion

  • 1. What’s Your Favourite Colour?
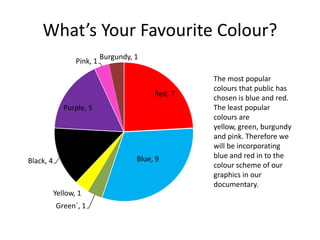
 Pink, 1 Burgundy, 1 Red, 7 Purple, 5 Blue, 9 Black, 4 Yellow, 1 Green`, 1 The most popular colours that public has chosen is blue and red. The least popular colours are yellow, green, burgundy and pink. Therefore we will be incorporating blue and red in to the colour scheme of our graphics in our documentary.
  • 2. Are You Male or Female? Gender 18 16 16 14 12 13 10 Male 8 Female 6 4 2 0 Male Female This data shows that the people that answered questionnaires were mainly female but there was also a high amount of males so we will aim our documentary at both genders.
  • 3. How old are you? 12 10 8 10 8 7 6 16 17 18 4 18+ 4 2 0 16 17 18 18+ This data shows that the people that the age range in this questionnaire is ranged between teens and adults so this is the age range we will base our documentary around.
  • 4. How much TV do you watch a week? 12 10 10 8 1 to 5 6 6 5 4 2 0 6 to 10 11 to 15 16 to 20 2 1 to 5 6 to 10 11 to 15 16 to 20 This data shows that most people watch TV for 1-5 hours a week.
  • 5. What time do you usually watch TV? Series 1 30 25 20 15 10 5 0 25 Morning (Before 12) Afternoon (1 till 5) 1 2 1 Evening None
  • 6. What type of TV Channels do you watch? Sky 1 4, 14% ITV 6, 21% Sports 3, 10% Channel 4 11, 38% BBC 1 5, 17% This data shows that most people that answered this questionnaire watch Channel 4 and ITV. We will be using this data to schedule our documentary and we will be scheduling our programme will be on Channel 4.
  • 7. What genres of music do you like? Dance 4, 12% Rock 4, 12% Hip Hop 2, 8% Alt. Punk 3% RNB 4, 12% Hardcore Metal 3% 3, 9% Indie 5, 14% Pop 4, 12% Classic 1, 3% Alternative 1, 3% Dubstep 1, 3% The most popular genre of music in this survey is Rock, this is the genre of music we will be using in our documentary to represent body art.
  • 8. Do you have any Tattoos? 20 18 19 16 14 12 10 8 Yes 10 No 6 4 2 0 Yes No These results show that more people have not got tattoos that answered this questionnaire than people that do but there is still a high number so we will aim our programme at both people who have them and people who are interested in body art.
  • 9. Do you have any piercings? 18 16 17 14 12 12 10 8 6 4 2 0 Yes No These results show that more people have piercings than people that didn’t. There is still a high number so we will Yes aim our programme No at both people who have them and people who are interested in body art.
  • 10. How much would you spend on a tattoo? Column1 81 to 100 10% 100 + 10% 1 to 20 21% 61 to 80 7% 41 to 60 17% 21 to 40 35% These results show that people are willing to spend a lot of money to get a tattoo but the most popular price in this survey is £21 to £40.
  • 11. How much would you spend on a piercing? 5 4.5 4 4.3 3.5 3.5 3 2.5 2 These answers show that the highest amounts for piercings is the lowest amount and the highest showing that people are willing to spend a range of amounts for body art. We will be discussing this in our documentary with our interviewees. 4.5 2.5 1.5 1 0.5 0 £1 to £20 £21 to £40 £41 to £60 £61 to £80 £81 to £100 100+
  • 12. Scale of 1-5 In your opinion how much would getting a tattoo hurt? (1 – No Pain, 5 – Very Painful) 12 10 10 8 6 4 6 5 5 3 2 0 1 2 3 4 5 These results show that the pain to get a tattoo would be a medium amount, we will be using these results as a topic of discussion in our documentary.
  • 13. Do You Think that Tattoos should have a meaning behind them? No 10 34% Yes 19 66% These results show that most people believe that tattoos should have a meaning behind them. We will be using this as a main topic in our documentary.
  • 14. Does your Tattoo have a meaning behind it? These results show that most people that have tattoos have a meaning behind them. Yes 6, 10% Don’t have one 19, 83% No 4, 7%
  • 15. What’s Your Opinion on Tattoos? 16 14 15 12 10 8 7 6 7 Dislike Sometimes like 4 2 0 Like These results show that most of the people we asked like tattoos and we will be discussing with the public their opinions on tattoos.
  • 16. What’s Your Opinion on Piercings? 16 14 15 12 10 10 8 6 4 4 2 0 Like Dislike Sometimes These results show that most of the people we asked like piercings and we will be discussing this topic with the public.
  • 17. Do You Do Your Own Tattoos or Piercings? Yes 2 No 27 Most of the people that answered this survey do not do their own tattoos or piercings so they must get them done professionally, we will be discussing this with the public.