The Coffee Bean & Tea Leaf(CBTL), Business strategy case study
Bharti airtel iifl_230513
1.
May 23, 2013
Indian market % change
Last close 1 day 3 mth YTD
Sensex 20,062 (0.2) 3.9 3.3
Nifty 6,095 (0.3) 4.2 3.2
BSE 100 6,107 (0.4) 3.8 2.2
BSE 200 2,452 (0.4) 3.2 1.1
CNX Midcap 7,967 (1.1) 0.6 (6.3)
BSE Small Cap 6,109 (0.8) (6.9) (17.2)
BSE 100 Futs 6,118 (0.2) 3.3 1.6
Sensex Futs 19,773 (2.0) 3.8 2.4
Developed market % change
Last close 1 day 3 mth YTD
Dow Jones 15,307 (0.5) 9.3 16.8
Nasdaq 3,463 (1.1) 9.5 14.7
S&P 500 1,655 (0.8) 9.2 16.1
FTSE 6,840 0.5 8.0 16.0
CAC 4,051 0.4 9.3 11.3
DAX 8,531 0.7 11.3 12.1
Hang Seng* 22,821 (1.9) 0.2 0.7
Nikkei* 15,737 0.7 38.2 51.4
Emerging market % change
Last close 1 day 3 mth YTD
Shanghai Comp 2,284 (0.8) (1.3) 0.7
Brazil Bovespa 56,429 0.3 (0.5) (7.4)
Mexico Bolsa 40,119 (1.1) (8.6) (8.2)
Kospi* 1,981 (0.6) (1.9) (0.8)
Straits* 3,440 (0.4) 4.6 8.6
* Markets are open
Institutional activity
(Rs cr) Cash F&O MTD YTD
FIIs 2,582 16 15,575 76,733
MFs (310) ‐ (2,704) (11,295)
FIIs Prov. 540
MFs Prov. (973)
Commodities % change
Last close 1 day 3 mth YTD
Crude (US$/bbl) 93.6 (0.8) 0.5 1.9
Gold (US$/oz) 1,364 (0.4) (13.7) (18.6)
Copper (US$/mt) 7,445 1.4 (4.2) (5.8)
Aluminium (US$/mt) 1,850 1.3 (7.7) (9.4)
Zinc (US$/mt) 1,848 1.6 (10.7) (9.8)
Currency % change
Last close 1 day 3 mth YTD
Rs/US$ 55.48 0.1 (2.3) (0.9)
US$/GBP 1.50 (0.1) (0.9) (7.5)
US$/EUR 1.28 (0.1) (1.7) (2.7)
Yen/US$ 103.17 0.0 (11.0) (15.9)
Advance/Decline stocks
(Nos) 22‐May‐13 21‐May‐13
Adv 438 478
Dec 951 905
Unch 89 110
A/D ratio (x)* 0.46 0.53
*A/D excluding Unch
Trade value
(Rs cr) % chg
Cash NSE 10,796 5.5
Cash BSE 2,011 4.7
Total Cash 12,807 5.3
Delivery (%) 43.2 0.0
Derivatives 148,553 258.7
Bond Market
Last close Bps chg
10yr Gsec 7.17 (0.19)
Call rate 7.30 0.05
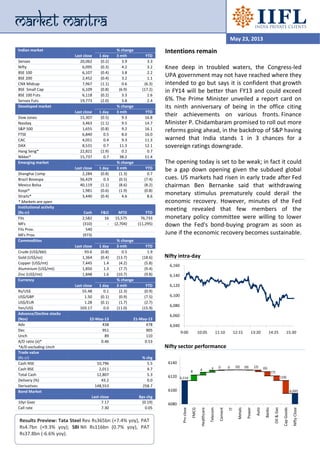
Nifty intra‐day
6,040
6,060
6,080
6,100
6,120
6,140
6,160
9:00 10:05 11:10 12:15 13:20 14:25 15:30
Nifty sector performance
6,114
8 4 3 0 0 (0) (0) (2) (6)
(7)
(19)
6,095
6080
6100
6120
6140
Prv close
FMCG
Healthcare
Telecom
Cement
IT
Metals
Power
Auto
Banks
Oil & Gas
Cap Goods
Nifty Close
Intentions remain
Knee deep in troubled waters, the Congress‐led
UPA government may not have reached where they
intended to go but says it is confident that growth
in FY14 will be better than FY13 and could exceed
6%. The Prime Minister unveiled a report card on
its ninth anniversary of being in the office citing
their achievements on various fronts. Finance
Minister P. Chidambaram promised to roll out more
reforms going ahead, in the backdrop of S&P having
warned that India stands 1 in 3 chances for a
sovereign ratings downgrade.
The opening today is set to be weak; in fact it could
be a gap down opening given the subdued global
cues. US markets had risen in early trade after Fed
chairman Ben Bernanke said that withdrawing
monetary stimulus prematurely could derail the
economic recovery. However, minutes of the Fed
meeting revealed that few members of the
monetary policy committee were willing to lower
down the Fed's bond‐buying program as soon as
June if the economic recovery becomes sustainable.
Results Preview: Tata Steel Rev Rs365bn (+7.4% yoy), PAT
Rs4.7bn (+9.3% yoy); SBI NII Rs116bn (0.7% yoy), PAT
Rs37.8bn (‐6.6% yoy).
2. News
Corporate snippets
McLeod Russel India Ltd has incorporated a
trading outfit in Kenya to procure and supply
African tea to the company’s Dubai blending unit.
(BL)
The board of Larsen & Toubro has approved a
scheme of arrangement for consolidating the
assets and liabilities of its hydrocarbon business
with its wholly owned subsidiary L&T
Hydrocarbon Engineering Ltd. (BL)
Daiichi Sankyo, the parent of Ranbaxy
Laboratories, said it believed certain former
shareholders of the Indian company had
concealed critical information. It was now
pursuing legal remedies, Daiichi added. (BS)
Reliance Jio Infocomm, the telecom arm of
Reliance Industries, plans to roll out fourth
generation (4G) services in metros by the end of
this financial year. (BS)
LIC Housing Fin is planning to raise Rs5bn in five‐
year bonds at 8.34%. (BS)
JSW Steel’s crude steel production fell 11% to
637,000 tons in April, due to planned shutdown
of units and lack of availability of quality iron ore.
(BS)
Jai Corp Ltd is looking at the option of selling a
part of its stake in the Navi Mumbai special
economic zone. (BS)
The Securities and Exchange Board of India has
written to Jet Airways, raising questions over
parts of the agreement signed by Jet with Etihad
Airways last month as they appear to confer
substantial management rights to the Etihad. (ET)
ING Vysya Bank said it hopes to raise Rs20bn in
fresh capital by the first half of next month
through a mix of preferential share allotment to
the promoters as well as a qualified institutional
placement. (ET)
Coal India will not allow the government to
auction shale gas blocks in its command area.
(ET)
Srei Infrastructure Finance is poised to buy the
domestic banking unit of nationalised Austrian
lender Hypo Alpe Adria for €65.5mn. (ET)
Economy snippets
The government has allowed Quadricycles to ply
within city limits as modes of public transport.
(BS)
In the wake of a CAG report accusing telecom
operators of acting as a cartel in the last two
rounds of spectrum auctions, the Competition
Commission of India has said it will look into the
matter to ascertain if at all the operators violated
any rules on competition. (ET)
The finance ministry has agreed to pay Rs1,000bn
cash compensation to state oil marketing
companies for the full financial year 2012‐13.
However, the finance ministry has the oil ministry
that the existing fuel pricing formula, which
allegedly inflates government’s fuel subsidy
burden, will have to be changed from current
financial year. (ET)
Results table
Rs m Revenues YoY % PAT YoY%
Jyothy
Laboratories
2,725 24.2 118 (57.7)
L&T 202,938 9.9 17,879 (6.9)
Redington 68,078 24.0 1,048 2.7
Thermax 14,682 (13.0) 1,153 (11.2)
3. Technicals
Note:
1. Ideas given under the ‘Technicals’ section are for intraday purpose or up to a period of three trading sessions. Stocks recommended under this heading are not
necessarily part of our fundamental buy or sell list.
2. Data in the above table comprises BSE200 Index stocks.
Nifty price/volume
13:J F M A M
Log IRIS
Source : www.SpiderSoftwareIndia.Com
5600
5800
6000
6200
Cr
50.00
100
Price Avg3(S,100,S,200,S,50)
Vol
NSE Nifty [N59901] 6127.05, 6147.60, 6074.45, 6094.50, 564906432 -0.32%
Dly
94
96
Nifty succumbed to selling pressure on back of weak
structure of ‘Rising wedge’, violating its short term
support of 6,110 on closing basis. Nifty earlier had held
on above the support levels. Hence, it is likely to
witness some amount of correction to the levels of
6,040 in the near term. i.e. 20‐DMA. However, the long
term trend in the market continues to remain positive
with Nifty making an attempt to test the support.
Support/Resistance levels*
Close Support Resistance
Nifty 6,095 6,021 6,137
Sensex 20,062 19,843 20,188
CNX IT 6,420 6,331 6,477
CNX Bankex 13,008 12,765 13,145
Nifty Junior 12,443 12,230 12,574
*based on pivot calculations
Positive breakout
Company name CMP
10 Days
MVG avg
Price %
chg
Delivery
(%)
Siemens 592 579 2.2 15.9
Bosch 9,228 9,050 2.0 89.0
Shriram Trans. 789 775 1.8 84.5
United Phos 156 153 1.7 67.3
TCS 1,498 1,476 1.5 67.6
Ing Vysya Bank 620 611 1.5 83.9
Oil India 586 578 1.4 77.6
Kotak Bank 768 758 1.4 36.0
Asian Paints 4,836 4,770 1.4 42.3
Jain Irrigation 68 67 1.3 49.7
Top gainers
Company Price (Rs) Price % chg % YTD chg
Manappuram 18 7.3 (47.9)
Castrol India 344 4.1 14.8
GSK Cons. 4,957 3.5 30.3
United Spirits 2,484 3.2 30.8
Crompton Grv 108 3.1 (6.5)
Sun Pharma 1,002 2.9 36.1
Shree Cement 4,919 2.8 5.9
Bharti Airtel 312 2.5 (1.6)
Jain Irrigation 68 2.5 (8.9)
Bajaj Fin. 686 2.2 (24.0)
Trading Strategy
Bharti Airtel (BUY, below Rs310, Target Rs325, SL
Rs303): After hitting a peak of Rs332, the stock has
seen a sharp correction with prices decelerating
almost 50% from the recent high. However in
yesterday’s trade, the stock found support at its 50‐
DMA and staged a pullback. Wednesday’s movement
has negated short term downtrend and stock is likely
to see some buying momentum in the short term.
Based on the projection of pullback, stock could test
levels of Rs325. (Duration 5 days)
Volume toppers
Company Price (Rs) Price % chg Vol % chg
Marico Ltd 219 (0.5) 689
Gujarat Fluoro 281 (1.2) 651
Concor 1,145 (0.2) 641
L&T 1,514 (5.7) 557
IOC 293 (3.9) 394
Negative breakout
Company name CMP
10 Days
MVG avg
Price %
chg
Delivery
(%)
M&M Fin. 240 247 (2.7) 45.4
Hexaware 78 80 (2.6) 51.4
GSPL 61 63 (2.6) 74.2
Rel Cap 362 371 (2.5) 11.7
Apollo Tyre 89 91 (2.3) 53.0
Hero Moto 1,650 1,689 (2.3) 41.7
GAIL 330 337 (2.1) 72.1
Gujarat Fluoro 281 287 (2.0) 98.3
Bharat Forge 230 234 (2.0) 58.3
Cadila Health 792 808 (2.0) 55.5
Top losers
Company Price (Rs) Price % chg % YTD chg
Adani Power 56 (7.2) (8.7)
Voltas 84 (6.0) (21.0)
L&T 1,514 (5.7) (5.8)
DLF 227 (5.7) (1.5)
Renuka 22 (5.3) (29.6)
JP Power 26 (4.9) (30.7)
HPCL 291 (4.9) 0.0
IFCI 28 (4.6) (17.2)
HPCL 291 (4.9) 0.0
Opto Circuits 48 (4.5) (55.0)
4. Pivot & Deals
Moving average & pivot table (Nifty 50)
Company
CMP
(Rs) Support* Resistance*
50‐
DMA
200‐
DMA
ACC 1,220 1,200 1,240 1,203 1,329
Ambuja Cem 186 182 191 182 195
Asian Paints 4,836 4,745 4,927 4,772 4,280
Axis Bank 1,513 1,480 1,546 1,389 1,282
Bajaj Auto 1,849 1,814 1,884 1,814 1,872
BOB 711 679 743 694 744
BHEL 204 198 209 190 218
BPCL 390 363 416 396 370
Bharti Airtel 312 304 320 303 298
Cairn India 289 277 300 294 320
Cipla 416 408 424 398 389
Coal India 310 305 315 307 342
DLF 227 209 245 246 232
Dr Reddy 2,056 2,008 2,103 1,919 1,812
GAIL 330 321 339 330 351
Grasim Ind 3,050 2,992 3,108 2,917 3,088
HCL Tech 744 729 759 758 656
HDFC Bank 703 689 717 662 647
Hero Moto 1,650 1,607 1,694 1,606 1,777
Hindalco Ind 111 108 114 97 111
HUL 585 584 587 507 510
HDFC 900 890 910 832 794
ICICI Bank 1,210 1,188 1,233 1,104 1,080
IDFC 159 156 162 151 156
INFY 2,385 2,331 2,440 2,577 2,525
ITC 336 328 343 315 291
JP Assoc. 73 68 79 73 82
JSPL 303 296 311 331 384
Kotak Bank 768 754 782 685 644
L&T 1,514 1,362 1,666 1,478 1,525
Lupin Ltd 768 747 789 674 610
M&M 990 968 1,013 906 877
Maruti 1,688 1,655 1,720 1,511 1,432
NTPC 155 151 159 149 159
ONGC 329 315 343 320 295
Power Grid 113 111 114 109 114
PNB 807 778 836 762 790
Ranbaxy 431 424 438 444 487
RIL 819 798 839 808 821
Rel Infra 408 392 425 379 470
Sesa Goa 161 157 165 157 173
Siemens 592 568 615 540 629
SBI 2,363 2,306 2,420 2,213 2,203
Sun Pharma 1,002 963 1,040 900 760
TCS 1,498 1,482 1,515 1,497 1,370
Tata Motors 291 282 300 286 280
Tata Power 91 88 94 95 101
Tata Steel 306 297 315 317 376
Ultra Cemco 1,950 1,909 1,992 1,896 1,898
*based on pivot calculations
Global pivot table
Index CMP (Rs) Supp 1 Supp 2 Pivot Res 1
Dow Jones 15,307 15,201 15,031 15,372 15,478
S&P 500 1,655 1,640 1,617 1,664 1,679
DAX 8,531 8,458 8,408 8,508 8,581
Hang Seng 22,821 22,714 22,509 22,919 23,026
Nikkei 15,737 15,647 15,499 15,795 15,885
A pivot is a level at which the market direction changes for the day. These points
can be critical support and resistance levels for that day. Pivot levels are only
broad indicators and not necessarily our view on the stock or index.
Bulk deals
Date Scrip name Institution B/S
Qty
('000)
Avg
price
(Rs)
22‐May Praj Ind Hdfc Mf B 4,316 38
22‐May Praj Ind
Capital World
Growth & Income
Fund Inc S 4,305 38
21‐May Jindal Cotex Albula Invst Fund B 2,175 14
21‐May Jindal Cotex
M/S Avatar India
Opportunities Fund S 2,175 14
20‐May
S. Kumars
Nation Idbi S 2,776 5
20‐May VST Ind Citigroup Global S 140 1,580
17‐May IVRCL Ltd Ambit Sec S 3,780 22
17‐May NRB Bearings Hdfc Mf S 653 36
16‐May Goa Carbon Crosseas Capital B 55 83
15‐May IVRCL Ltd Ambit Sec B 1,956 20
Insider trades
Date Company Name B/S
Qty
('000)
13‐May AXIS Bank Ltd United India Ins S 3
17‐May Astra Microwave B Reddy B 27
17‐May ECE Ind P Mohta B 383
17‐May ECE Ind P Mohta B 383
13‐May Amtek Auto Forbes Builders B 73
13‐May Amtek Auto Forbes Builders B 73
7‐May Aarti Drugs Aarti Ind S 51
7‐May Aarti Drugs R Gogri B 6
8‐May Amtek Auto Forbes Builders B 200
8‐May Amtek Auto Forbes Builders B 200
FII’s trades
Scrip name Volume ('000) Price (Rs) Prem/Disc (%)
Future Retail 0 143 5.2
South Ind. Bank 0 25 0.2
PNB 33 884 9.5
Indusind. Bank 0 496 0.6
Grasim 4 3,060 0.3
ADR/GDR
Latest (US$) Price % chg % Prem/Disc
Dr. Reddys 37.5 1.8 1.2
HDFC Bk 41.2 (1.8) 8.4
ICICI Bk 46.8 (0.4) 7.2
ITC 6.1 1.3 0.2
Infosys 43.1 (1.1) 0.1
Ranbaxy 7.5 (2.0) (3.0)
Reliance 29.6 (1.5) 0.2
Wipro 7.9 0.5 27.3
SBI 86.7 1.8 1.8
Tata Motors 26.3 (1.4) 0.2
Sterlite 6.9 (2.1) 0.6
L&T 28.2 (2.6) 3.3
5. NSE Derivatives
Nifty future which added ~0.76mn shares in open
interest has seen addition of short.
Bank Nifty future which added ~0.025mn shares
in open interest has seen short addition.
Nifty May 6,100 call which added ~0.64mn shares
in open interest has seen writing.
Nifty May 6,100 put which added ~0.41mn shares
in open interest has seen writing.
Fresh Short was seen in Capital goods, Cement
and Realty sector.
Stocks in Ban period: NA
Strategies
Long ICICI Bank May future below Rs1186 for the
Target price of Rs1216 with a Stop loss placed at
Rs1168.
Lot size: 250
Remarks: Net maximum profit of Rs7,500 and net
maximum loss of Rs3,750.
Nifty snapshot
Current % Chg
Near month price 6,104 (0.2)
Near month Pre/Disc 9.6 241.1
Mid month price 6,114 (0.2)
Mid month Pre/Disc 19.6 48.5
OI* (‘000) 28,874 2.7
Volume (‘000) 11,006 (11.9)
PCR (OI) 1.2 (1.0)
PCR (Vol) 1.0 (9.1)
Roll‐over (%) 7.9 3.4
VIX 17.7 (0.9)
FII derivative data
(Rs cr) Buy Sell Net Contracts OI % chg
Index Futures 1,991 1,429 561 28,951 5
Index Option 19,110 19,414 (304) (32,376) (2)
Stock Futures 1,835 2,102 (268) 6,698 1
Stock Options 2,251 2,224 27 1,870 1
Nifty strikes open interest
0
2,000
4,000
6,000
8,000
10,000
12,000
5800 5900 6000 6100 6200 6300 6400
OI in ('000)
Call Put
Sector‐wise OI
(4)
(2)
0
2
4
6
8
10
Auto
Banking
Finance
Capital
Goods
Cement
Fertilizers
FMCG
Technology
Infra
Realty
Media
Metals
Oil & Gas
Pharma
Power
Sugar
Textiles
Telecom
Hotels
% chg
Nifty open interest chart
0
200
400
600
22‐Feb‐13 19‐Mar‐13 15‐Apr‐13 11‐May‐13
OI cont('000)
4,400
4,600
4,800
5,000
5,200
5,400
5,600
5,800
6,000
Nifty
6. NSE Derivatives…
Futures open interest gainers
Scrip OI ('000) % change CMP (Rs) % change Volume ('000) % change Prem/Disc (Rs)
Ofss 952 61.9 2,444 1.0 1,357 677.7 (0.3)
Indiacem 5,140 34.6 76 (10.0) 6,108 332.6 (0.2)
Herohonda 1,760 14.1 1,655 (2.1) 629 111.6 (4.3)
Techm 1,375 12.9 948 3.7 2,695 124.3 (4.4)
Lt 5,620 12.8 1,520 (5.5) 16,231 532.1 (6.1)
Sail 21,148 11.8 59 (4.4) 7,068 101.5 (0.2)
Jpassociat 60,464 9.3 74 (4.3) 47,312 (0.7) (0.4)
Sunpharma 3,923 6.3 1,007 3.2 1,630 90.2 (4.8)
Dlf 24,737 6.2 227 (5.8) 21,237 70.9 0.1
Denabank 15,396 6.2 90 (3.5) 9,408 31.5 (0.3)
Bpcl 5,607 5.7 391 (3.3) 5,548 255.2 (1.0)
Futures open interest losers
Scrip OI ('000) % change CMP (Rs) % change Volume ('000) % change Prem/Disc (Rs)
Syndibank 4,080 (16.9) 130 (3.7) 4,228 (29.8) 0.7
Orientbank 1,772 (6.0) 263 (2.5) 1,074 (26.6) (0.0)
Dishtv 15,048 (5.8) 68 (3.6) 8,776 (24.5) 0.0
Ibrealest 15,780 (4.7) 80 (2.8) 14,272 (28.2) (0.1)
Suntv 1,646 (3.9) 419 (1.3) 725 (36.7) (0.8)
Cesc 724 (3.2) 323 (1.8) 324 (24.7) 0.7
Canbk 2,657 (3.2) 442 (0.6) 2,781 30.8 (0.0)
Hcltech 3,321 (2.9) 746 0.9 1,173 8.4 (2.1)
Colpal 130 (2.6) 1,416 (0.7) 72 0.0 (4.3)
Federalbnk 868 (2.5) 464 (1.0) 218 (14.2) (0.6)
Wipro 2,459 (2.4) 343 0.7 902 (37.4) (0.8)
Most active stock calls Most active nifty calls
Scrip Strike Expiry OI ('000) % change CMP(Rs) Strike Expiry OI ('000) % change CMP(Rs)
Lt 1650 May 530 60.8 3 6200 May 7,816 6.2 24
Lt 1600 May 626 199.3 6 6100 May 6,044 12.0 64
Sbin 2400 May 845 30.9 42 6300 May 6,283 (0.1) 7
Lt 1700 May 376 25.3 1 6400 May 4,549 (11.1) 2
Sbin 2500 May 927 21.4 19 6000 May 2,847 3.7 134
Dlf 240 May 4,096 22.1 2 6500 May 1,374 (2.7) 1
Mcdowell‐N 2500 May 321 (12.8) 62 6200 Jun 1,678 9.3 86
Infy 2400 May 384 (12.3) 19 6300 Jun 1,753 2.1 52
Sbin 2350 May 333 15.4 62 6500 Jun 944 29.0 16
Dlf 250 May 5,001 12.0 1 6400 Jun 903 7.3 30
Most active stock puts Most active nifty puts
Scrip Strike Expiry OI ('000) % change CMP(Rs) Strike Expiry OI ('000) % change CMP(Rs)
Lt 1500 May 374 28.7 23 6100 May 5,777 7.7 53
Lt 1550 May 215 (2.3) 49 6000 May 7,098 (7.7) 23
Sbin 2300 May 549 68.9 49 6200 May 3,181 (8.2) 110
Lt 1600 May 172 (7.0) 90 5900 May 8,291 5.7 9
Sbin 2200 May 548 4.6 21 5800 May 5,392 (1.7) 4
Sbin 2350 May 193 4.6 72 5700 May 6,510 (0.9) 2
Sbin 2250 May 386 45.8 32 6100 Jun 1,367 8.7 113
Dlf 230 May 1,358 (23.0) 8 6300 May 611 (23.7) 193
Mcdowell‐
N
2400 May 136 58.2 32 6000 Jun 2,057 3.8 77
Lt 1580 May 66 1.1 73 5900 Jun 1,423 5.7 51
*OI= Open Interest
7. Note: OI= Open Interest Cont= Contracts
BSE Derivatives
Sensex May future which shed 2595cont in open
interest has seen unwinding.
On option front, BSE100 May 6,300 strike call which
shed 8550cont in open interest has seen unwinding,
while put writing was seen at May 5,900 strike which
shed 17150cont in open interest.
Market summary
( Rs Lacs)
Cont
Traded
No. of
Trades Turnover OI (Cont)
Index Future 8,715 3,717 26,593 41,009
Index Option (Call) 1,56,153 3,447 5,04,755.09 22,415
Index Option (Put) 8,63,401 19,506 25,47,957.89 22,098
Equity Future 9,991 5,292 27,973 5,587
Equity Option (Call) 338 10 934 334
Equity Option (Put) 207 7 565 179
Sensex Fut vs NIFTY Fut
17,000
17,500
18,000
18,500
19,000
19,500
20,000
20,500
21,000
Feb‐13 Mar‐13 Apr‐13 May‐13
5,000
5,200
5,400
5,600
5,800
6,000
6,200
6,400
SENSEX futur NIFTY Future
BSE Derivatives snapshot
Current % Chg
Sensex future price 20,060 (0.6)
Sensex future Pre/Disc (2.2) (0.0)
BSE100 Future price 6,118 (0.2)
BSE100 Future Pre/Disc 11.1 0.2
BSE100 Future OI* (‘Cont) 484 (12.9)
Bse100 Future Vol (‘Cont) 2,890 (9.5)
FII derivative data
(Rs Lakhs) Buy Sell Net
OI
(Cont)
OI
Value
Index Futures 0 0 0 0 0
Index Option 0 0 0 5,548 15,431
Stock Futures 0 0 0 0 0
Stock Options 0 0 0 0 0
BSE100 Fut vs NIFTY Fut
5,100
5,200
5,300
5,400
5,500
5,600
5,700
5,800
5,900
6,000
6,100
6,200
6,300
Feb‐13 Mar‐13 Apr‐13 May‐13
BSE100 Future NIFTY Future
BSE100 Futures
10
2010
4010
6010
8010
10010
12010
14010
16010
22‐Feb‐13 19‐Mar‐13 16‐Apr‐13 13‐May‐13
4,400
4,600
4,800
5,000
5,200
5,400
5,600
5,800
6,000
6,200
6,400OI (Cont) Close
8. Mutual Funds
Fund focus
UTI Opportunities Fund Invest
Fund manager Anoop Bhaskar Min investment Rs5,000
Latest NAV Rs32.7 Entry load Nil
NAV 52 high/low Rs32.5/24.8 Exit load 1% before 1 year
Latest AUM Rs 3,609cr Benchmark BSE 100
Class Equity – diversified Asset allocation Equity (92%), Cash (8%)
Options Growth & dividend Expense ratio 1.94%
Top Recommended Funds (Absolute returns (in %) are based on previous close)
Equity – Diversified/Largecap
Assets
(Rs Cr)
NAV
(Rs) 1wk 1mth 3mth 6mth 1yr 2yr 3yr 5yr
Birla SL Frontline Equity Fund(G) 3,227 103.3 1.56 7.09 3.82 12.19 33.27 21.49 33.70 54.87
IIFL Dividend Opp Index Fund(G) 36 11.7 1.56 7.49 3.19 9.07
UTI Opportunities Fund(G) 3,609 32.7 1.34 6.38 4.04 7.16 22.76 22.90 42.00 73.65
Equity – Midcap
HDFC Mid‐Cap Opp Fund (G) 2,701 55.8 (0.36) 3.20 (0.37) 4.75 19.14 15.21 28.79 92.65
ICICI Pru Discovery(G) 2,753 18.4 1.90 5.54 1.59 5.40 19.81 20.07 39.80 82.32
IDFC Sterling Equity Fund (G) 1,369 21.1 2.09 6.44 (0.19) 2.14 18.06 17.52 27.64
Equity – Tax saving
Fidelity Tax Advantage (G) 731 19.1 2.02 6.83 2.81 8.51 26.90 16.18 23.13 35.57
HDFC Tax Saver (G) 3,354 238.9 1.88 4.79 0.25 6.03 17.01 6.46 18.12 51.80
ICICI Prudential Tax Plan (G) 1,436 154.5 1.07 5.10 (0.88) 4.16 21.76 12.55 24.88 49.16
Hybrid
DSP‐BR Balanced Fund (G) 594 71.3 1.56 4.73 1.63 4.44 14.85 10.03 19.14 42.13
HDFC Prudence Fund (G) 5,854 239.4 2.62 5.60 2.32 6.44 17.37 14.41 29.05 79.86
ICICI Pru Balanced Fund (G) 494 57.1 0.32 4.65 1.82 7.59 22.57 25.20 42.67 45.14
Debt – Money market
Birla SL Savings‐Ret(G) 6,061 220.1 0.20 0.79 2.38 4.47 9.27 19.64 27.84 44.81
Reliance Money Manager (G) 10,467 132.9 0.17 0.69 2.23 4.20 8.62 18.32 26.07
UTI Treasury Advantage‐Reg (G) 4,376 15.2 0.18 0.72 2.40 4.48 9.36 19.83 28.34 46.02
Debt – Floating rate
ICICI Pru Floating Rate ‐B (G) 1,346 193.2 0.19 0.70 2.20 4.11 8.45 17.84 25.53 41.25
Kotak Floater LTP (G) 4,467 18.9 0.23 0.85 2.62 4.71 9.70 20.13 28.79 47.06
Tata Floater Fund (G) 3,287 1,780.0 0.18 0.76 2.35 4.49 9.36 19.93 28.76 46.94
NFO Update Open Close Type Category
ICICI Prudential FMP Series 68 ‐ 366 Days Plan C 20‐May 23‐May CE Debt ‐ FMP
UTI Fixed Maturity Plan ‐ Yr Sr ‐ May 2013 16‐May 24‐May CE Debt ‐ FMP
UTI Fixed Maturity Plan ‐ Yr Sr ‐ May 2013 16‐May 24‐May CE Debt ‐ FMP
#OE: Open Ended, CE: Close Ended
Recent Actions
SBI Debt Fund Series 366 Days‐4 declares dividend. The record date has been fixed as May 23, 2013.
Franklin Templeton India Balanced Fund 366 Days‐4 declares dividend. The record date has been fixed as May 24,
2013.
Religare Invesco FMP Series X Plan D (18M) declares dividend. The quantum of dividend shall be Re 0.1 per unit. The
record date has been fixed as May 23, 2013.
ICICI Prudential FMP Series 60‐18M Plan F and ICICI Prudential FMP Series 64‐367D Plan F declares dividend. The
quantum of dividend shall be Re 0.3681 and 0.05 per unit respectively. The record date has been fixed as May 23,
2013.
Disclaimer: Mutual Fund is subject to market risk, please read the offer document carefully before investing.
9. Disclaimer: Mutual Fund is subject to market risk, please read the offer document carefully before investing.
Exchange Traded Funds (ETFs)
Fund focus
IIFL NIFTY ETF Invest
Fund manager Manish Bandi Options Growth
Latest NAV Rs623.7 Min investment 1 unit
NAV 52 week high/low Rs625.0/483.18 Benchmark S&P CNX NIFTY
Latest AUM Rs15.7 cr Downside risk 0.37%
Bloomberg code IIFLNFT IN Tracking error 1.48%
Type Open‐ended Expense ratio 0.25%
Class Equity ETF Exit load 0%
Top Recommended ETFs
Scheme Name
AUM
(Rs cr)
Bloomberg
Code
Latest
NAV(Rs)
Absolute (%)
SI* Benchmark
Name
1
mth
3
mth
6
mth 1 yr 2 yr 3 yr
SI*
Benchmark
Category: Equity Exchange Traded Funds
IIFL Nifty ETF 19 IIFLNFT IN 623.7 6.5 3.7 10.6 27.6 0.0 0.0 ‐ S&P CNX Nifty
GS Nifty BeES 541 NBEES IN 616.9 6.5 2.4 9.2 25.9 11.2 24.3 ‐ S&P CNX Nifty
Kotak Nifty ETF 42 KONIFTY IN 621.3 6.5 3.6 10.5 27.4 14.4 27.8 ‐ S&P CNX Nifty
MOSt Shares M50 84 MOSTM50 IN 81.7 6.2 1.4 6.9 23.0 8.4 0.0 ‐ S&P CNX Nifty
MOSt Shares Midcap
100 ETF
184 MOST100 IN 8.3 6.5 0.5 5.1 19.1 5.0 0.0 ‐ CNX Midcap
GS Junior BeES 89 JBEES IN 126.8 8.1 4.7 13.5 33.4 15.6 19.8 ‐ CNX Nifty Junior
MOSt Shares NASDAQ‐
100 ETF
62 MOSTNDX IN 165.8 10.3 10.2 16.2 21.6 55.7 0.0 ‐ Nasdaq‐100
Category: Gold Exchange Traded Funds
GS Gold BeES 3,334 GBEES IN 2,422.4 (1.0) (13.8) (20.1) (13.0) 13.4 36.1 ‐ Gold‐India
Reliance Gold ETF 3,040 REGOLD IN 2,375.8 (0.6) (13.5) (19.9) (12.8) 37.4 14.3 ‐ Gold‐India
Kotak GOLD ETF 1,251 KOGOLD IN 2,428.5 (1.1) (13.9) (20.3) (13.1) 13.8 36.6 ‐ Gold‐India
HDFC Gold ETF 790
HDFC GOLD
IN
2,478.6 (1.0) (13.9) (20.2) (13.1) 13.6 0.0 ‐ Gold‐India
ICICI Pru Gold ETF 201 ICPGOLD IN 2,507.5 (0.7) (13.4) (19.8) (12.7) 14.1 0.0 ‐ Gold‐India
SBI Gold ETF 1,337 SGETS IN 2,480.1 (1.0) (13.9) (20.2) (13.1) 14.0 37.1 ‐ Gold‐India
UTI Gold ETF 736 UTI GOL IN 2,431.9 (1.0) (13.8) (20.2) (13.1) 13.9 36.7 ‐ Gold‐India
Category: Liquid
GS Liquid BeES 551 LBEES IN 1,000.0 0.4 1.3 2.8 5.7 12.1 17.9 ‐
Crisil Liquid
Fund Index
Category: Banking ETF
Kotak PSU Bank ETF 11 KOPSUBIN 349.6 4.4 0.9 10.4 19.4 (7.7) 2.0 0.0 CNX PSU Bank
Reliance Banking ETF 12 RBETF IN 1,377.4 7.2 6.5 16.2 42.7 47.4 26.0 0.0 CNX Bank
* Since Inception
Calculation as on 20
th
May, 2013
About ETFs
ETFs are essentially index funds that are listed on an exchange and track the price performance of the target
index closely. The ETF trading value is based on the net asset value (NAV) of the underlying stocks in the target
index.E.g, a Nifty ETF will look to replicate CNX Nifty returns.
ETFs are popular world over with nearly 60% of trading volumes on the American Stock Exchange (AMEX)
captured by all types of ETFs. At the end of June 2011, the global ETF industry comprised 2,825 ETFs from 146
providers on 49 exchanges around the world with total assets of US$1.49 trillion.
ETF advantages
Diversification benefit ‐ In case of Nifty ETF, you own the complete basket of 50 stocks and remain
diversified.
Low cost of investment ‐ The passive investment style with low turnover helps keep costs low. ETFs are
known to have among the lowest expense ratios compared to others schemes.
10. House Recommendations
House Recommendations
The large cap Buys and Sells are relative outperformer and underperformer bets vis‐à‐vis the Nifty
respectively. Reduce portfolio weight in stocks with Sell rating. Midcap Buys are based on absolute return
expectations.
Top Large‐cap Buys
Stock Sector Sector View* CMP (Rs) M‐Cap (Rs bn)
Maruti Automobiles Equalweight 1,688 509.8
ICICI Bank Financials Overweight 1,210 1,396.2
Axis Bank Financials Overweight 1,513 708.9
ITC FMCG Equalweight 336 2,651.5
HCL Tech IT Equalweight 744 517.9
Dr Reddy's Pharmaceuticals Overweight 2,056 349.0
Cipla Pharmaceuticals Overweight 416 333.8
Cairn India Oil & Gas Overweight 289 551.2
Source: India Infoline Research
* Relative to Nifty composition
Best Mid‐cap Buys
Stock Sector CMP (Rs) M‐Cap (Rs bn)
Amara Raja Automobiles 244 41.7
ING Vysya Bank Financials 620 96.4
LIC Housing Finance Financials 276 139.3
JK Lakshmi Cement 101 11.8
MCX Exchanges 926 47.2
Petronet LNG Oil & Gas 142 106.4
Den Networks Media 218 31.9
Source: India Infoline Research
11.
Event Calendar
Monday Tuesday Wednesday Thursday Friday Saturday
May 01 May 02 May 03 May 04
IDFC
Apr HSBC Markit
manufacturing PMI
Can Bank, Bharti
Airtel, Kotak Bank
RBI Policy Meet
Apr HSBC Markit
service PMI
ACC, Titan, Ambuja
Cem
Grasim
May 06 May 07 May 08 May 09 May 10 May 11
Adani Ports, Adani
Power, ALBK, CEAT,
Dewan Housing,
Glenmark, Jubilant
Life, OFSS, Sintex,
Shriram Trans, Uco
Bank
ABB, Corp Bk, HDFC,
Future Cap, Jai Corp,
Lupin, Piramal Life,
Ranbaxy, Talwalkars
Asian Paints, Bajaj
Hind, EMCO, Escorts,
Godrej Prop, GTL
Infra, HCL Info,
Jublint Food, PNB,
Union Bank
India Mar IIP yoy
India Apr import &
export YoY% (10‐15
May)
Ashok Ley, Apollo
Tyres, Balrampur
Chini, Central Bk,
Essar Oil, NTPC, Punj
Lloyd, RCom, Sobha,
United Bk
JK Cem, Dena Bk,
Selan Exploration,
Unichem Labs
May 13 May 14 May 15 May 16 May 17 May 18
India Apr CPI yoy
Nestle, RPower, 3i
Infotech, Amara Raja,
Amtek Auto, Amtek
India, BOB, Bank of
India, Thomas Cook
India Apr inflation
data
Dr Reddy’s Labs,
Reliance Infra,
Satyam, Elder
Pharma, HT Media,
Bartronics, DCW,
Muthoot Fin,
Novartis, Pfizer,
Suven Life, United
Bank
Adani Ports, Bajaj
Finance, Bajaj
Finserv, Century Tex,
GVK Power, KTK
Bank, OnMobile
Bajaj Auto, Bajaj
Hold, Infinite Comp,
TTK Prestige,
Kalpataru Power,
Orbit Corp, Rel Cap,
TTK Prestige, Ucal
Fuel
Dhan Bank, Balaji
Tele, ITC, ENIL,
Motherson Sumi,
NIIT Tech, PTC India,
Sun TV
May 20 May 21 May 22 May 23 May 24 May 25
Adani Ent, India
Cemet, Divis Lab,
CUB, Coal India,
Hotel Leela, IFCI,
Shriram City Union,
Srei Infra, Voltas
Deccan Cement,
Dhampur Sug, JSW
Ispat, Mahindra Forg,
Tech M
Thermax, L&T, LMW,
Prakash Ind,
Redington, Thermax,
Zee Ent
Phillips Carbon, Tata
Steel, Dish TV, BHEL,
IGL, JSW Steel, NIIT,
Phillips Carbon, SBI,
Welcorp, Zee News
Britannia
May 27 May 28 May 29 May 30 May 31
Eight infrastructure
industries (27‐31
May)
Tata Chem
Colgate, Godrej Ind
BPCL, Anant Raj, Zee
Ent
M&M, Tata Power,
GMR Infra, SAIL
Q1 GDP yoy%
Annual Q1 govt GDP
estimates
India Apr Fiscal
deficit
Blue: Economic data, Black: results