SlideShare a Scribd company logo
1 of 23
Download to read offline
609 Ramona Street
Palo Alto, CA 94301
The Ramona
Bringing Life to Current Condition
Proposal
Pojing Liu
Table of Contents
Executive Summary
Market Overview
Power of 10
Stakeholder Analysis
Concept + Design
Site Plan
Design Details
Rooftop Garden
Interior Details
Placemaking
Construction Schedule
Precedence Network
LEED Certification
Feasibility Study
Comparables
Financial Analysis
Other Financial Considerations
Appendix
609 Ramona Street
Stanford University
Downtown Palo Alto
Executive Summary
Dear Mr. Allen and Prospective Investors,
We are pleased to present you an exciting opportunity to invest in what will be a timeless
structure in the dynamic economy of Silicon Valley. Silicon Valley is a breeding ground for
innovative technology giants and disruptive startups like Google, Facebook, Apple and
Tesla Motors. The epicenter of Silicon Valley is Palo Alto, home to Xerox, Hewlett Packard
and Stanford University. High paying technology and finance jobs are bringing in an influx
of well-educated professionals, pushing already high real estate prices even further into
the stratosphere.
Let us introduce you to The Ramona. Located at 609 Ramona Street in Downtown Palo
Alto (above right), this underappreciated property is located within three blocks of
several bus routes, Caltrain, public parks, Stanford University’s sprawling garden campus,
and locally-owned restaurants lining University Avenue. The existing structure was built
decades ago, and due to poor upkeep and marketing by the current owner, the
property has failed to attract lasting tenants in spite of it sitting in and around a bustling
area.
We propose purchasing 609 Ramona and the two adjoining properties, all of which are
for sale, and replacing the existing structures with a five story, mixed-use work of art. High
demand, high prices, and cap rates below 4% for quality properties warrant this a viable
strategy. The building will consist of three retail spaces on the main floor. To comply with
the city’s FAR, the building will be set back ten to twelve feet on each side, allowing us to
create an exciting sidewalk that will benefit our tenants. We will seek out and work with
businesses in hopes of making each of them a ‘third place’ for our residents and the
community. The residences will consist of 22 apartments in a variety of sizes ranging from
studio apartments to luxury lofts.
Acquisition, demolition and construction of the new property are expected to cost about
$18.9MM. With a 6% cap rate, which is higher than the market’s average of 4-5%, we
expect an IRR of 12%. However, with a 4.5% cap rate, which is more in line with the
market, the IRR is projected to be 22% upon exit.
Attached are design proposals, placemaking objectives and financial projections that
highlight this property’s potential. We believe that with your support, this venture will pay
large dividends to investors and the community.
Sincerely,
Brody Mulderig, Lyla Feinsod, Bedant Bhutia, Pojing Liu
Dear Mr. Allen and Prospective Investors,
We are pleased to present you an exciting opportunity to invest in what will be a timeless structure
in the dynamic economy of Silicon Valley. Silicon Valley is a breeding ground for innovative
technology giants and disruptive startups like Google, Facebook, Apple and Tesla Motors. The
epicenter of Silicon Valley is Palo Alto, home to Xerox, Hewlett Packard and Stanford University.
High paying technology and finance jobs are bringing in an influx of well-educated professionals,
pushing already high real estate prices even further into the stratosphere.
Let us introduce you to The Ramona. Located at 609 Ramona Street in Downtown Palo Alto
(above right), this underappreciated property is located within three blocks of several bus
routes, Caltrain, public parks, Stanford University’s sprawling garden campus, and locally-owned
restaurants lining University Avenue. The existing structure was built decades ago, and due to poor
upkeep and marketing by the current owner, the property has failed to attract lasting tenants in
spite of it sitting in and around a bustling area.
We propose purchasing 609 Ramona and the two adjoining properties, all of which are for sale,
and replacing the existing structures with a five story, mixed-use work of art. High demand, high
prices, and cap rates below 4% for quality properties warrant this a viable strategy. The building
will consist of three retail spaces on the main floor. To comply with the city’s FAR, the building will
be set back twelve to fifteen feet on each side, allowing us to create an exciting sidewalk that will
benefit our tenants. We will seek out and work with businesses in hopes of making each of them a
‘third place’ for our residents and the community. The residences will consist of 22 apartments in a
variety of sizes ranging from studio apartments to luxury lofts.
Acquisition, demolition and construction of the new property are expected to cost about
$18.9MM. With a 6% cap rate, which is higher than the market’s average of 4-5%, we expect
an IRR of 12%. However, with a 4.5% cap rate, which is more in line with the market, the IRR is
projected to be 22% upon exit.
Attached are design proposals, placemaking objectives and financial projections that highlight
this property’s potential. We believe that with your support, this venture will pay large dividends to
investors and the community.
Sincerely,
Pojing Liu
Executive Summary
...To Micro
Not far down the peninsula sits an expensive suburb of about 65,000 people
known as Palo Alto. Palo Alto earns the top spot in the US for the percentage of
the population holding advanced degrees. Ten of the Bay Area’s 44 billionaires
claim Palo Alto as their home (see map). The average home price for the city
has risen by 12.5% over the past year, and now sits at $1.8MM. Over the past
five years, rents have increased more than 45% in Palo Alto and are expected to
outpace the broader market.
To one unfamiliar with the market, a glance at the preceding data might draw
them to conclude that Palo Alto is a ritzy community like Beverly Hills where
sprawling estates consume the landscape. This is generally not the case as most
homes in the city are modest and would be considered middle-class in other
neighborhoods throughout the US. Lavish displays of wealth are relatively rare
unlike Palo Alto’s high-priced counterparts. Instead, residents are known for
embracing the most progressive technologies and ideas (think Segway and
Tesla). Given the housing shortage and progressive mindset, we believe our
proposal, which markets to these sentiments, will be well received by the city,
investors and surrounding community.
3 http://www.city-data.com – Top Cities with Master’s or Doctorate Degrees
4 Data provided by Zillow
5 http://www.chicagobusiness.com – April, 7 2014, ‘Inside Sam Zell’s low-rent Silicon Valley Housing Strategy’
Market Overview
From Macro...
The San Francisco Bay is a great place to be in 2014 for working
professionals. According to the Bay Area Council Economic Institute,
the area has a GDP of $535 billion, which ranks 19th when compared
to national economies. GDP is $74,815 per person, the highest in the
world, and almost twice the US national average. It is also one of the
most educated workforces in the country, with a high percentage of
residents holding advanced degrees. Economic forecasts predict that
the Bay Area will continue to outperform the broader economy.
All of this translates to a booming economy and expensive real estate.
San Francisco recently passed New York City as the most expensive
real estate in America on a per square foot basis. High prices aren’t
confined just to the city of San Francisco, as real estate prices for most of
the Bay are pushed upward by land constraints. There is a concentration
of Fortune 500 companies, diverse agriculture, and higher educational
institutions in the area.
In addition to so much industry, the Bay Area enjoys a comfortable
climate and provides year-round outdoor activities. It is within driving
distance to Yosemite and Redwood National Parks, Napa and Sonoma
Valley wineries, the Pacific Coast and world-class ski resorts. Given the
economic and lifestyle considerations, it is clear that there is a lot going
on in the area.
1 http://www.bayareaeconomy.org – 2013 Economic Forecast
2 http://www.slate.com – Andy Kiersz, March, 17 2014
Go across the street to shop for gifts and
local art at University Art.
The Palo Alto Public Library is less than a
block away.
San Francisco or down to San Jose.
Head across the street and grab a bus to
work or campus.
Or head two blocks the other way and buy
your produce at the Palo Alto Farmer’s
Market.
Walk two blocks and do your grocery
shopping at Whole Foods.
Grab a football and a picnic basket and
spend the afternoon at Heritage Park.
Walk to University Avenue and enjoy a
movie at the historic Stanford Theatre.
o the Caltrain Station and head up to
ancisco or down to San Jose.
cross the street and grab a bus to
campus.
a, or
n
or this
losest
Power of 10
Enjoy a summer twilight concert across the
street or watch from your balcony.
Walk outside an
dozens of othe
restaurants.
The Project for Public Spaces introduced the ‘Power of 1
making desirable public places. We could have easily m
location as there is so much to do within walking distanc
and most diverse features that will make The Ramona a
e Caltrain Station and head up to
sco or down to San Jose.
s the street and grab a bus to
mpus.
r
his
est
Power of 10
Enjoy
street
Go across the street to shop fo
local art at University Art.
The
bloc
Th
m
lo
a
Enjoy a summer twilight concert across the
street or watch from your balcony.
shop for gifts and
rt.
The Palo Alto Public Library is less than a
block away.
Walk to the Caltrain Station and head up to
San Francisco or down to San Jose.
Head across the street and grab a bus to
work or campus.
Walk outside and enjoy dinner at Nola, or
dozens of other highly rated local
restaurants.
Walk two blocks and do your grocery
shopping at Whole Foods.
The Project for Public Spaces introduced the ‘Power of 10’ framework to assist in
making desirable public places. We could have easily made a ‘Power of 20’ for this
location as there is so much to do within walking distance. We chose the ten closest
and most diverse features that will make The Ramona a great place to live.
Grab a football and a pic
spend the afternoon at H
The Palo Alto Public Library is less than a
block away.
Or head two blocks the other way and buy
your produce at the Palo Alto Farmer’s
Market.
Walk two blocks and do your grocery
shopping at Whole Foods.
nic basket and
eritage Park.
Walk to University Avenue and enjoy a
movie at the historic Stanford Theatre.
block away.
Or head two blo
your produce at
Market.
W
sh
Grab a football and a picnic basket and
spend the afternoon at Heritage Park.
Walk to University Avenue and enjoy a
movie at the historic Stanford Theatre.
oss the
han a
Walk to the Caltrain Station and head up to
San Francisco or down to San Jose.
Head across the street and grab a bus to
work or campus.
Walk outside and enjoy dinner at Nola, or
dozens of other highly rated local
restaurants.
Walk two blocks and do your grocery
o within walking distance. We chose the ten closest
will make The Ramona a great place to live.
Go across the street to shop for
gifts and local art at University Art.
Head a few blocks and buy your
produce at the Palo Alto Farmer’s
Market.
The Project for Public Spaces introduced the ‘Power of 10’
framework to assist in making desirable public places. All of these
sites are in addition to the placemaking efforts we have made
to the street and the property itself. Ten of the most desirable city
comforts are highlighted here.
Grab a football and a picnic
basket to spend the afternoon at
Heritage Park.
Head across the street and grab a
bus to work or campus.
The Palo Alto Public Library is less
than a block away.
Walk to University Avenue and
enjoy a movie at the historic
Stanford Theatre.
Walk outside and enjoy dinner
at Nola, or dozens of other highly
rated local restaurants.
Walk to the Caltrain Station and head
up to San Francisco or down to San
Jose.
Enjoy a summer twilight concert
across the street or watch from
your balcony.
Walk two blocks and do your
grocery shopping at Whole
Foods.
Power of 10 Why you want to be here!
Stakeholder Analysis
Stanford University Palo Alto City Hall Public Schools
Police and FirefightersStreet-level Retailers Local Residents
Stanford University is the city’s largest
employer with over 10,000 people on its
payrolls. The school has had difficulty in the
past recruiting staff because of the high cost
of living. Stanford even went so far to develop
part of its campus and sell homes at below
market prices to attract talent.
Palo Alto has a made it a point to support
developments that provide densification.
Environmental concerns, traffic, cost of living
and overall quality of life have led to the city
approving multiple story developments in the
downtown area.
Public teachers aren’t what one would
consider as high paid. This creates big
challenges for the school district as its
teachers face long commutes from more
affordable areas. More housing will help to
alleviate this concern over time.
Any retailer with a presence on the street
would be happy to have more people
walking past and spending time in front of
their stores. Our placemaking plans will not
only benefit our tenants, but neighbors as
well.
Local residents want great places to eat,
great places to walk, and great places to
shop. Additionally, attractive and timeless
architecture enhances the appeal of their
community and serves to protect their
property values.
Police officers and firefighters face the same
problems as teachers: cost of living. But a
development like The Ramona makes their
job easier as updated building codes may
prevent fires. Well lit, attractive properties
may help prevent petty crimes.
UP
3005
SF
re
ta
il
2
2
2243
SF
re
ta
il
3
3
2630
SF
re
ta
il
1
1
815
SFResid
entlo
bby
1
209
SF
Gara
ge
1
209
SF
Gara
ge
2
209
SF
Gara
ge
4
209
SF
Gara
ge
5
67
SF
Ele
vato
r
1
67
SF
Ele
vato
r
2
11'-7"
141'-119/16"
60'-59/16"
69'-11"
209
SF
Gara
ge
3
www.a
uto
desk.com
/revit
Scale
Date
Dra
wn
By
Checked
By
Pro
jectNum
ber
Consultant
Addre
ss
Addre
ss
Addre
ss
Phone
Consultant
Addre
ss
Addre
ss
Addre
ss
Phone
Consultant
Addre
ss
Addre
ss
Addre
ss
Phone
Consultant
Addre
ss
Addre
ss
Addre
ss
Phone
Consultant
Addre
ss
Addre
ss
Addre
ss
Phone
1/8
"=
1'-0"
4/1
3/2
014
1:2
4:2
7
PM
02
FloorPlan
Level1Owner
ProjectNam
e
Checker
Auth
or
Issue
Date
ProjectNum
ber
No.
Description
Date
1/8
"=
1'-0"
1
Level1
CreatingWOW!Architecture
Surrounding Architecture
The residents in this Palo Alto neighborhood
are very sensitive about new architecture
introducedtothecity.Thisdesignspeakstothe
surrounding buildings while adding modern
appeal to the residents it wishes to attract.
Ground Floor
Retail, Garages,
Residential Access
Residential
Retail
Horizontal
Vertical
Pedestrian
Residential lobby
Programmatic Blocking
Circulation
Concept Diagrams
Exciting Sidewalk Exciting Sidewalk
Height Relationship Greenery
There are three proposed retail units
at street level. One tenant exists
in the current group of buildings.
Reposado is a highly-rated, local
restaruant that we would love to
invite to occupy the corner unit.
This would provide outdoor dining,
greater street presence and more
square footage for Reposado.
There are five parking garages in
the back of the structure, each of
which will have hook-up capabilities
for electric and hybrid vehicles. As
developers interested in a more
sustainable community, we will give
precedence to residents with hybrid
vehicles for this desirable amenity.
Concept + Design
This site is a Walker’s
Paradise!
Private Patio
Outdoor Dining
Solar Panels
Green Roof
Overlook
CreatingaSenseofPlace
Walkscore:98
The intention of site design is to create
places that both the public and residents
of the building can enjoy. A revitalized
street design and a green roof garden are
incorporated into the design. Sustainable
features, such as a vegetation wall, solar
panels and rain gardens are also utilized to
create a sense of place.
Building
Green Roof
Residents Only
Public
Space
Outdoor
Dining
Site
Boundry Pedestrian
Circulation
Outdoor Living
Room
Site Plan
Wooden Slats,
Sun Shading
White Concrete
Double-Pane Glass
Permeable Pavers
The Ramona is set back fifteen
feet from the street which allows
for a strong pedestrian presence,
exciting the sidewalk and catering
to a walker-friendly community.
A white concrete and wood slat
facade brings an exciting modern
interpretation of the surrounding
architecture. Large overhangs
function as solar shading that assist
in the LEED Certification of the
building. The large glass facade on
the first floor opens up the building
to the street, inviting pedestrians to
enter from the sidewalk. Some of
the glass opens garage-door style to
blur the line between sidewalk and
building.
Design Details
Green Wall
Outdoor Living Room
Planters
Planting Bed and
Rain Garden
Aside from making The Ramona a more
desirable place to live, the green roof
has several practical applications. The
private resident outdoor living space
benefits our resident’s quality of life via:
Growing Local Produce
Reducing Heat Island Effect
Contributing to LEED Certification
Creating a Private Oasis
Saving on Energy Consumption
Conserving Rain Water
Developing Resident Community
RooftopGarden
Scale
Date
Drawn
By
Checked
By
Project Num
ber
1/4" =
1'-0"
4/13/2014
1:21:07
PM
A101
Unnam
ed
Owner
Project Nam
e
Checker
Author
Issue
Date
Project Num
ber
1/4" =
1'-0"
1
Level 1
Beautiful Polished
Concrete Countertops
Claw Foot Tub
We designed apartments of various
sizes to attract people in different
stages of life and income. Per floor,
there are two studios, two one-
bedrooms, and four two-bedrooms.
Each unit has at least one exterior
balcony to take advantage of the
street presence and fresh California
air. The top floor consists of lofts that
expand the one and two bedroom
apartments into luxurious three and
four bedroom units with 360 degree
views of downtown Palo Alto.Typical 2 bedroom
925 Sq.Ft.
2 bed, 2 bath
Reclaimed Wood
Floors
Modern Kitchen
Chic Exposed Brick
Walls
Modern Glass
Shower
Floor to Ceiling
Nanawall
Modern Fixtures
UP
UP
495
SF
studio
1
553
SF
studio
2
802
SF
2
bed
6
676
SF
1
bed
1809
SF
1
bed
2
883
SF
2
bed
1
1027
SF
2
bed
2
109'-119/16"
31' - 0 1/4"
134'-0"
85' - 6"
67
SF
Elevator
1
65
SF
Elevator
2
923
SF
2
bed
3
Scale
Date
Drawn
By
Checked
By
ProjectNum
ber
1/8"=
1'-0"
14
1:38:3
8
PM
01
FloorPlan
Level2Owner
ProjectNam
e
Checker
Author
Issue
Date
ProjectNum
ber
1/8
"=
1'-0"
1
Level2
Interior Details
Outdoor tables prioritize the
pedestrian presence on the street,
adding another layer of program to
the streetscape. Seating that spills
from the building entices people
from the sidewalk to enter inside.
Planters add nature to the sidewalk
as well as additional seating
space on raised planter beds. The
pedestrian is more comfortable in
urban settings where nature has a
strong presence.
Outdoor benches allow the
streetscape to become a pedestrian
rest point. It encourages street
conversation, people-watching, and
provides areas to rest and wait for
public transportation.
By widening the sidewalk, we are
able to incorporate many activities
beyond pedestrian circulation
such as outdoor seating, street art,
conversation spots, and nature.
Adding trees to the streetscape
provides shading which is essential
for the hot sun in Palo Alto. It also
adds the nature element to an urban
setting.
Outdoor solar lights provide light
to make the street accessible and
safe 24 hours per day. By using solar
panels, it is a low-cost, low-energy
investment.
A rooftop garden provides an area
of nature/refuge for the residents. It
will be used as a green roof as well
as community garden activities. It is a
substitute for the typical urban yard
in an urban setting.
A green wall located adjacent
to the community garden/green
roof creates a presence of nature
not often seen in urban settings.
This will add to the buildings LEED
Certification. It also is a marketing
strategy for young professionals who
are passionate about sustainability.
Outdoor Tables
Planters Green Wall
Benches
Wide Sidewalks, Street Art Outdoor Solar Lights
Trees/Nature Rooftop Garden
The Art of Placemaking
Construction Schedule
Timeline & Gantt Chart
The construction schedule shows a total
of 52 weeks as the project duration from
the date of the Notice to proceed to
date of completion. Critical activities are
subsequently represented.
The project construction schedule is
shown in three forms to give us a clear
idea about the activities in construction:
1. Timeline: This gives us a rough idea
about the duration of the project with
respect to the start and end date of the
project. We can clearly see that the start
date of the project is 4th April, 2014 and
the end date of the project is 18th June,
2015.
2. Gantt Chart: This gives us a detail
information regarding each activity of
the construction phase. The length of
horizontal bars represents the amount of
time for each activity. The red colored
bars denote the critical activities and
hence special emphasis should be given
to these activities so as to complete the
construction on time.
The construction schedule shows a
total of 52 weeks from the date of
the Notice to Proceed to the date
of completion. Critical activities
involved in the development of this
project are illustrated to the left and
outlined below:
The project construction schedule is
shown in three forms (continued
on following page) to clarify tasks
required to successfully construct a
project of this nature.
1. Timeline: The construction timeline
to the top left gives us a rough idea
of the duration of the project with
respect to the start and end dates.
We can clearly see that the start
date of the project is April 4, 2014
and the end date of the project is
June 18, 2015.
2. Gantt Chart: This gives us a
detailed information regarding each
step required during the construction
phase. The length of horizontal
bars represents the amount of time
expected for each task. The red
colored bars denote the critical
activities. Special emphasis should
be devoted to these assignments in
order to complete the construction
on time.
Residential
Retail
Horizontal
Vertical
Pedestrian
Residential lobby
Programmatic Blocking
Circulation
Exciting Sidewalk Exciting Sidewalk
Residential
Retail
Horizontal
Vertical
Pedestrian
Residential lobby
Programmatic Blocking
Circulation
Exciting Sidewalk Exciting Sidewalk
Residential
Retail
Horizontal
Vertical
Pedestrian
Residential lobby
Programmatic Blocking
Circulation
Concept Diagrams
Exciting Sidewalk Exciting Sidewalk
Height Relationship Greenery
Residential
Retail
Horizontal
Vertical
Pedestrian
Residential lobby
Programmatic Blocking
Circulation
Concept Diagrams
Exciting Sidewalk Exciting Sidewalk
Height Relationship Greenery
Construction Schedule
Precedence Network
3. Precedence Network: The precedence network was produced using Critical Path Method. This provides us with a systematic approach
and helps us to understand which activity we have to complete before proceeding to the next activity. The thickened lines in the
precedence network diagram links the critical activities, when delayed will delay the completion of the whole project.
Resources: Microsoft Project; Microsoft Visio
Precedence Network
3. Precedence Network: The precedence network was produced using Critical Path Method. This provides us with a systematic approach and
helps us to understand which activity we have to complete before proceeding to the next task. The thickened lines in the precedence network
diagram links the critical assignments. If this is delayed, it will postpone the completion of the whole project.1/8" = 1'-0"
1
Elevation 1 - a
1/8" = 1'-0"
2
Elevation 2 - a
Southwest Elevation Northeast Elevation
www.autodesk.com/revit
Scale
Date
Drawn By
Checked By
Project Number
Consultant
Address
Address
Address
Phone
Consultant
Address
Address
Address
Phone
Consultant
Address
Address
Address
Phone
Consultant
Address
Address
Address
Phone
Consultant
Address
Address
Address
Phone
1/8" = 1'-0"
4/13/20141:24:39PM
04
Front Elevation
Owner
Project Name
Checker
Author
Issue Date
Project Number
No. Description Date
1/8" = 1'-0"
1
Elevation 1 - a
1/8" = 1'-0"
2
Elevation 2 - a
1/8" = 1'-0"
3
Elevation 3 - a
would be applying for LEED Gold Certification.
Sustainable features:
1. Green roof: A Green roofing system of
about 3309 SF is provided on the second floor
of the building
Benefits:
Reduces the Urban Heat Island (UHI) Effect
Retains the rainwater and also moderates
the temperature of water
Prolongs the service life of heating,
ventilation, and HVAC systems in the
building
Helps improve air quality
White roof: White roofing of approximately
4823 SF will be provided on the fifth floor of
the building.
Benefits:
Reduces the energy use by about 20% in
hot sunny weather
Helps lower smog levels by lowering local
temperatures
3. Solar Shading: Solar shades have been
provided on the east and west side of the
building to maximize the use of natural
daylight.
Benefits:
Reduces the amount of energy required for
heating or cooling
Cuts down the amount of energy required
for lighting
Enhances indoor comfort and productivity
4. Solar Energy: Solar panels will be installed
on the white roof to harness solar energy.
Depending upon the requirement, the
energy harnessed will be used for a variety of
purposes.
Benefits:
Saves money
Provides energy reliability and security
Source: USGBC
The Ramona qualifies for LEED Gold
LEED Certification
Economic Cycles
- Robust market
- High demand, low
supply of housing
Environmental
- Contamination risk
is minimal
- Not in floodplain
Market Research
- Mixed use is
encouraged
- Influx of millenials
Wow Architecture
- Efficient design
- Solar ready
- Communal areas
Equity & Debt
- Approx. 70/30
debt to equity ratio
- DSCR must > 1.2
Political Approval
- City pushing for
densification
- FAR is within limits
Community Goals
- Walk Score of 98
- Attractive design
- Affordable space
Construction
- Deconstruct
existing structure
- Qualifies for LEED
Taxes
- Property tax
cannot exceed 1%
- LLC pass-thru
Sales & Leasing
- Pro forma based
on leasing only
- Sales increase IRR
Site Management
- Exciting sidewalk
benefits retailers
- Placemaking
Legal Relations
- Crowdfunding
- Local developers
- Local contractors
Feasibility Study
Right: These diagrams were compiled from dozens of recently marketed properties in
Palo Alto (see Appendix for more detail). The top diagram illustrates the ranges that
properties rented for on a per square foot basis (annually) for offices, retail storefronts,
apartments and individual homes while the bottom diagram illustrates sale prices for
the same types of properties. While prices can vary widely based on many factors, the
market data tells us that the average price per square foot across many property types
is still very high. If the project sells or rents for the average market price, will it still make
money? Yes. This is how we determined a baseline for construction type and mix.
Based on our analysis, we determined that a mix of residential units and retail would
provide the best long-term value. According data provided by REIS, of the 35 planned
or proposed construction projects in the area, 28 of them are for office space. Per the
diagram to the right, office space is clearly the most expensive type of space to rent.
However, because so many proposed development projects consist of office space,
we were concerned that the market may overbuild. Likewise, we feel that quality
residential spaces are being neglected and that demand for well-planned residential
developments will remain high. Finally, one of our goals is to help build a great
community. Office space does little to excite the sidewalk and does not contribute in
the same way residences and retail do in building an urban village.
Below: Quantitative analysis of a project is important but only takes us so far. We used
Peter Allen’s real estate development chart to map risks and opportunities from a
holistic perspective. The Palo Alto market is very strong and has had an influx of high-
paid millenials working in the technology industry. There is little concern for the site
environmentally as there are no gas stations nearby and it does not sit in a floodplain.
Palo Alto is a very progressive city that is pushing for densification. Our building will be
LEED certified, have attractive design and provide for placemaking. Therefore, we
expect that getting the city’s blessing will not be difficult.
The Marc
Circle Palo Alto
165 Forest Avenue
Analysis: Closest Comparables
The Marc is a luxury high rise off of University Avenue in Palo Alto that boasts some of
the highest rental prices of any apartment complex in Palo Alto at about $80 annually
per square foot. This means that a 675 square foot leases for upwards of $4500 per
month.
Pluses: On site gym and swimming pool. Two blocks from University Avenue and a short
walk from Caltrain and bus stops.
Minuses: Little to nothing to excite the sidewalk. Property is not mixed use. While there
are a lot of ‘third places’ nearby, none are right next to the property. Location is inferior
to The Ramona in terms of transit, shopping and dining.
Circle Palo Alto is an ultra high-end mixed use property at the entrance to downtown.
There are three condos sitting on top of two floors of Class A office space. Like we
proposed for the top floor condos in The Ramona, the condos of Circle Palo Alto are
two floors with access to a private rooftop garden. These condos recently sold
between $3.7MM and $5.4MM each, depending on their size, which translates to about
$1,250 per square foot.
Pluses: Each unit has access to two underground parking spaces. The architecture
allows for views on at least two sides of each condo, essentially making each condo a
corner unit.
Minuses: While the property sits directly on University Avenue, there has been no effort
to excite the sidewalk at or near the property. Also, it sits right next to the Caltrain
station and El Camino Real, potentially making traffic and noise a nuisance.
165 Forest Avenue is a mixed use property consisting of 2 bedroom 2 bathroom condos
on top of a mix of retail and office. Several 1,285 square foot units were recently sold at
$1.3MM each, putting the condos at just over $1,000 per square foot.
Pluses: Fantastic location as it is two blocks from Caltrain, one block from a bus route,
three blocks from a park, and it is adjacent to restaurants and retail shopping. Yet it is
far enough away from high traffic areas to avoid traffic noise and congestion.
Minuses: The street level real estate is lackluster as there are no big windows and no
curb appeal to excite the sidewalk. The property lacks desirable communal areas like
a garden or swimming pool.
As already noted, we ran a detailed analysis of comparable properties to determine
the range of sale prices and rents per square foot in Palo Alto. As no two properties are
completely comparable, we selected the three closest comparables and noted their
advantages and disadvantages with respect to The Ramona:
Type End of Month Financing Fees Land Costs Hard Costs Soft Costs Contingency Interest Expense
Equity
Investment
End of Month Loan
Balance
Assumptions Values
CONSTRUCTIONLOAN
0 (250,000) (10,587,500) - - - - 6,408,437 (4,429,063) Total Hard Costs (6,626,181)
1 - - (552,182) (107,811) (33,000) (36,909) - (5,158,965) Total Soft Costs (1,293,737)
2 - - (552,182) (107,811) (33,000) (42,991) - (5,894,949) Contingency (395,996)
3 - - (552,182) (107,811) (33,000) (49,125) - (6,637,066) Land Costs (10,587,500)
4 - - (552,182) (107,811) (33,000) (55,309) - (7,385,368) Total Construction (18,903,413)
5 - - (552,182) (107,811) (33,000) (61,545) - (8,139,905)
6 - - (552,182) (107,811) (33,000) (67,833) - (8,900,731) Building Value (6% Cap) 21,361,457
7 - - (552,182) (107,811) (33,000) (74,173) - (9,667,896) LTV Limit 14,953,020
8 - - (552,182) (107,811) (33,000) (80,566) - (10,441,455) Loan Amount (13,600,692)
9 - - (552,182) (107,811) (33,000) (87,012) - (11,221,460) Equity Investment 6,408,437
10 - - (552,182) (107,811) (33,000) (93,512) - (12,007,964)
11 - - (552,182) (107,811) (33,000) (100,066) - (12,801,024) Closing Costs And Fees (250,000)
12 - - (552,182) (107,811) (33,000) (106,675) - (13,600,692) Annual Interest Rate 10.0%
TOTAL FLOWS (250,000) (10,587,500) (6,626,181) (1,293,737) (395,996) (855,715) 6,408,437 (13,600,692) Monthly Interest Rate 0.8%
Construction - The sum of the
three lots is about 15,000 square
feet with structure totaling about
43,000 square feet. Cost of
construction in Palo Alto is high
compared to the national
average. We referenced Reed
Construction Data in addition to
their online tool, RS Means.
Excluding land acquisition costs,
hard and soft costs of
construction are projected at
$183 per square foot, with an
added contingency of $9 per
square foot for a total of $193 to
construct this building.
Financing - Based on a 6% cap
rate, this building has an
estimated value of $21.3MM.
With 70% debt financing we
would be allowed to borrow just
under $15MM. However, most
banks require a DSCR of 1.2, and
based on our conservative pro
forma statements, the total
amount borrowed will be less.
We assume a 10% interest rate
on a loan with a monthly draw
over the 12 month construction
period. The loan will then be
converted to a conventional
commercial mortgage with an
interest rate of 6% and closing
costs of $250k. The final loan
amount of $13.6MM will satisfy
the bank’s DSCR of 1.2.
Construction Cost Estimating
Property Location: 609 Ramona Street Palo Alto, CA
Approximate Lot Size (SF) : 15,125
Total Development Area (SF): 43,071
Floor - Area Ratio (FAR): 2.85
Palo Alto Cost Modifier: 178
Development Description Total Area (SF) Base Cost ($)/SF Total Base Cost ($) Cost/SF Cost/SF
Condos / Apartments (Low Rise 2nd to 3rd Floor) 14,910 $ 93.23 $ 2,474,305.55 $ 165.95 $ 57.45
Condos / Apartments (Mid Rise 4th to 5th Floor) 12,268 $ 107.62 $ 2,350,102.24 $ 191.56 $ 54.56
Retail Stores 7,650 $ 90.73 $ 1,235,470.41 $ 161.50 $ 28.68
Residential Lobby 815 $ 85.50 $ 124,034.85 $ 152.19 $ 2.88
Green space: Social Area (Landscaping) 3,309 $ 3.32 $ 19,554.87 $ 5.91 $ 0.45
Hardscape 3,256 $ 9.32 $ 54,015.74 $ 16.59 $ 1.25
Parking Lot 863 $ 60.70 $ 93,243.70 $ 108.05 $ 2.16
Base Construction Cost Estimate 43,071 $ 6,350,727.36 $ 147.45
Total Base Cost of Construction Estimate $ 6,350,727.36 $ 147.45
Asbestos Abatement ($100,000 allowance) $ 100,000.00 $ 2.32
Demolition of Existing Building $ 67,813.20 $ 1.57
Site Work and Underground Utility Work (10 / SF of lot) $ 107,640.00 $ 2.50
Sub-Total of Hard Construction Costs $ 6,626,180.56 $ 153.84
Construction Management (4.0% of Hard Construction Costs) $ 265,047.22 $ 6.15
Initial Site Survey $ 6,000.00 $ 0.14
Foundation Analysis $ 45,000.00 $ 1.04
Architecture and Engineering Fees (8.2 % of Hard Construction Costs) $ 520,759.64 $ 12.09
Developer Fees (4% of Hard Construction Costs) $ 254,029.09 $ 5.90
LEED Costs & Certification (1% of Hard Construction Costs) $ 63,507.27 $ 1.47
Legal Fees (1% of Hard Construction Costs) $ 63,507.27 $ 1.47
Permit Fees (Per city of Palo Alto Schedule) $ 42,159.03 $ 0.98
Plan Review Fees (Per city of Palo Alto Schedule) $ 33,727.22 $ 0.78
Sub-Total of Soft Construction Costs $ 1,293,736.76 $ 30.04
Total Project Hard and Soft Construction Costs $ 7,919,917.32 $ 183.88
Contingency (5%) $ 395,995.87 $ 9.19
Total Construction Costs w/ Contingency $ 8,315,913.18 $ 193.07
Financial Analysis
Net Operating Income
Period: Construction Phase 1 2 3 4 5
Gross potential rent: Retail $ - $ 397,800 $ 413,712 $ 430,260 $ 447,471 $ 465,370
Gross potential rent: Apartment - 1,727,418 1,796,515 1,868,375 1,943,110 2,020,835
Gross potential rent: Parking - 30,000 31,200 32,448 33,746 35,096
= Total gross potential income: - 2,155,218 2,241,427 2,331,084 2,424,327 2,521,300
- Vacancy: Retail - 27,846 28,960 30,118 31,323 32,576
- Vacancy: Apartment - 120,919 125,756 130,786 136,018 141,458
- Vacancy: Parking - 2,100 2,184 2,271 2,362 2,457
= - Total revenue lost to vacancy - 150,865 156,900 163,176 169,703 176,491
- Collection loss: Retail - 19,890 20,686 21,513 22,374 23,268
- Collection loss: Apartment - 86,371 89,826 93,419 97,156 101,042
- Collection loss: Parking - 1,500 1,560 1,622 1,687 1,755
= - Total revenue lost to collections - 107,761 112,071 116,554 121,216 126,065
- Concessions: Retail - 15,912 20,686 21,513 22,374 23,268
- Concessions: Apartment - 69,097 89,826 93,419 97,156 101,042
- Concessions: Parking - 1,200 1,560 1,622 1,687 1,755
= - Total revenue lost to concessions - 86,209 112,071 116,554 121,216 126,065
+ Expense recovery: Retail - 23,868 20,686 21,513 22,374 23,268
+ Expense recovery: Apartment - 103,645 89,826 93,419 97,156 101,042
+ Expense recovery: Parking - 1,800 1,560 1,622 1,687 1,755
= + Total expense recovery - 129,313 112,071 116,554 121,216 126,065
= Effective gross income: - 1,939,696 1,972,456 2,051,354 2,133,408 2,218,744
- Operating expenses: Retail - 100,980 105,019 109,220 113,589 118,132
- Operating expenses: Apartment - 296,129 307,974 320,293 333,105 346,429
- Operating expenses: Parking - 900 936 973 1,012 1,053
= - Total operating expenses - 398,009 413,929 430,486 447,706 465,614
- Property taxes 105,875 200,000 208,000 216,320 224,973 233,972
= Net operating income: (105,875) 1,341,687 1,350,526 1,404,547 1,460,729 1,519,158
- Replacement reserve - 40,000 41,600 43,264 44,995 46,794
- Tenant improvements - 20,000 20,800 21,632 22,497 23,397
= NOI after reserves: $ (105,875) $ 1,281,687 $ 1,288,126 $ 1,339,651 $ 1,393,237 $ 1,448,967
Capitalized NOI at 6% $ 21,361,457 $ 21,468,773 $ 22,327,524 $ 23,220,625 $ 24,149,450
Potential Sources of Equity
It is our opinion that equity holders in this project should be local as there is an added incentive to create real estate
that enhances the community above the status quo. For that reason, we will seek equity through crowdfunding
and/or partnering with local developers.
Crowdfunding
By the nature of US securities laws, crowdfunding is forced to ‘be local’. Investors must invest in
the state in which they reside. Crowdfunding has become an ever more popular way for small
investors to take part in the real estate market and now raises millions of dollars for single projects.
Local Developers
Local developers know the market best and can provide invaluable insight into a project of this
scale. Peery Arrillaga is one of the largest landowners in Silicon Valley and the co-founders, Messrs.
Peery and Arrillaga reside in the area. Thus, they have a vested interest in creating a great community
through real estate.
Key Data Assumptions
Retail Rent ($/SF) - Annual $ 52
Residential Rent ($/SF) - Annual $ 77
Parking ($/Space) - Monthly $ 500
Vacancy: Retail 7%
Vacancy: Apartment 7%
Vacancy: Parking 7%
Collection Loss: Retail 5%
Collection Loss: Apartment 5%
Collection Loss: Parking 5%
Concessions: Retail 4%
Concessions: Apartment 4%
Concessions: Parking 4%
Expense Recovery: Retail 6%
Expense Recovery: Apartment 6%
Expense Recovery: Parking 6%
Operating Expenses: Retail ($/SF - Monthly) $ 1.10
Operating Expenses: Apartment ($/SF - Monthly) $ 1.10
Operating Expenses: Parking ($/Space - Monthly) $ 15
Property Taxes 1%
Financial Analysis
Cap Rate
Exit Price
4.50% 5.00% 5.50% 6.00% 6.50% 7.00% 7.50%
NOI
$ 1,148,967 25,532,599 22,979,339 20,890,309 19,149,450 17,676,415 16,413,814 15,319,560
$ 1,248,967 27,754,822 24,979,339 22,708,490 20,816,116 19,214,876 17,842,385 16,652,893
$ 1,348,967 29,977,044 26,979,339 24,526,672 22,482,783 20,753,338 19,270,957 17,986,226
$ 1,448,967 32,199,266 28,979,339 26,344,854 24,149,450 22,291,800 20,699,528 19,319,560
$ 1,548,967 34,421,488 30,979,339 28,163,036 25,816,116 23,830,261 22,128,100 20,652,893
$ 1,648,967 36,643,710 32,979,339 29,981,218 27,482,783 25,368,723 23,556,671 21,986,226
$ 1,748,967 38,865,933 34,979,339 31,799,399 29,149,450 26,907,184 24,985,242 23,319,560
Cash Flow: Conventional Financing
0 1 2 3 4 5
Year of Operations Construction Phase 1 2 3 4 5
= NOI after reserves: $ (105,875) $ 1,281,687 $ 1,288,126 $ 1,339,651 $ 1,393,237 $ 1,448,967
+ Income from Sale of Property - - - - - -
- Debt Service (6% fixed loan) - 1,051,553 1,051,553 1,051,553 1,051,553 1,051,553
= Before-tax Cash Flow (105,875) 230,134 236,573 288,098 341,684 397,414
Debt Service Coverage Ratio
(Covenant = 1.2) N/A 1.22 1.22 1.27 1.32 1.38
+ Principal repayment - 242,098 257,029 272,882 289,713 307,581
- Depreciation (structure) - 302,397 302,397 302,397 302,397 302,397
- Depreciation (TI) - 2,857 2,857 2,857 2,857 2,857
Accumulated Depreciation - 305,254 610,508 915,762 1,221,016 1,526,270
- Amortization (of points) 12,500 12,500 12,500 12,500 12,500 12,500
Accumulated amortization 12,500 25,000 37,500 50,000 62,500 75,000
+ Replacement reserve - 40,000 41,600 43,264 44,995 46,794
+ Tenant improvements - 20,000 20,800 21,632 22,497 23,397
= Taxable income from operations (118,375) 214,478 238,248 308,122 381,135 457,432
* Tax rate (income from operations) 39.6% 39.6% 39.6% 39.6% 39.6% 39.6%
= Tax bill from operations (46,877) 84,933 94,346 122,016 150,930 181,143
Before-tax cash flow (105,875) 230,134 236,573 288,098 341,684 397,414
- Tax bill (46,877) 84,933 94,346 122,016 150,930 181,143
= After-tax cash flow (58,999) 145,201 142,227 166,082 190,754 216,270
Payment - 1,051,553 1,051,553 1,051,553 1,051,553 1,051,553
Interest - 809,455 794,524 778,671 761,840 743,972
Principal - 242,098 257,029 272,882 289,713 307,581
Loan balance 13,600,692 13,358,593 13,101,564 12,828,681 12,538,968 12,231,387
Amortization of fees paid at closing 12,500 12,500 12,500 12,500 12,500 12,500
Remaining amortization $ 237,500 $ 225,000 $ 212,500 $ 200,000 $ 187,500 $ 175,000
Cash Flow at Sale
Period: Beginning of Year 6
Gross sale price (6% Cap) $ 24,149,450
- Deductible sales expenses 1,207,472
= Net sale price 22,941,977
- Mortgage balance 12,231,387
= BTCF at sale 10,710,590
- Tax bill at sale 1,158,030
- Original cost 18,903,413
- Capital improvements -
- Points/fees 250,000
= Appreciation component 3,788,564
Accumulated depreciation 1,526,270
+ Total amortization 75,000
= Depreciation component 1,601,270
Appreciation tax (20%) 757,713
Depreciation tax (25%) 400,317
= Net cash after taxes 9,552,560
Cap Rate Levered IRR
4.5 22%
5 18%
5.5 15%
6 12%
6.5 8%
7 6%
7.5 3%
Financial Analysis
Other Financial Considerations
The financial models on the previous pages we believe are conservative and provide us a
base case. The big question we had in our due diligence was “If this building were operated
in the least profitable way in the current market conditions, would it make money?” Based
on our conservative models, the answer is ‘yes’.
In the current market, it costs less to rent a home than it does to purchase the same home
with a conventional mortgage. The two examples to the right illustrate this phenomenon.
Should either of these properties provide a tenant the option to buy, the monthly mortgage
payment alone (after 20% down; this does not include taxes or insurance) is higher than the
listed rental price. This is the scenario modeled in our financial projections.
It is visually and quantifiably evident from our feasibility study that selling residential square
footage yields a higher price than renting. We will illustrate the impact that selling off the top
floor lofts (keeping the rest as rental) has on The Ramona’s financial returns below:
88 Roosevelt Circle
3 beds, 2 baths, 1,318 Square Feet
Listed Rent: $4,400/month
Estimated Value: $1,500,000
Mortgage (4.5%, 30 yr., 20% down): $6,228/month
2 beds, 2 baths, 1,632 Square Feet
Listed Rent: $5,500/month
Estimated Value: $1,400,000
Mortgage (4.5%, 30 yr., 20% down): $5,674/month
483 Forest Avenue Apartment D
Source: Zillow
Loft Sale $/SQFT
    $800 $900 $1,000 $1,100 $1,200
9,902 SQFT $7,921,600 $8,911,800 $9,902,000 $10,892,200 $11,882,400
Selling the top floors, even at $800 per square foot, a price well below market, allows the
investors to recapture all of their equity ($6.4MM) plus about $1.5MM. Current market
conditions create a selling environment where $1,100 per square foot is closer to the
average. Additionally, The Ramona is a premium property that has an outstanding location
and trendy amenities. Because of these features, we believe this property will sell for above
the average price per square foot. At $1,200 per square foot, investors would enjoy a 2x
return on their investment from the sale of the lofts alone.
  Lofts Sold at $1,000/SQFT
Cap Rate 6.0% 5.5% 5.0% 4.5%
IRR 67% 69% 70% 71%
If all of the top floor lofts were sold at $1,000 per square foot and all other property
assumptions remained equal (the remainder remains as rental units), IRR jumps dramatically.
We feel this makes the project very exciting financially and provides the developer with
some space to explore other options for the property, such as an affordable housing
component. Suffice it to say, this project is financially viable in the current market and is
likely to remain viable even if the Palo Alto real estate market softens.
Appendix
Comparable Properties for 609 Ramona Street, Palo Alto, CA 94301
Low Average High Low Average High $58.39
Office $75.00 $92.71 $107.34 $497.00 $1,075.75 $1,940.00
Retail $30.60 $37.78 $57.00 $366.00 $772.38 $1,073.00 Average Sale Price per Square Foot of All Mixed-use Property Types $918.01
Apartment $34.79 $57.37 $88.92 $348.40 $593.45 $977.60
House $33.12 $45.72 $62.86 $882.58 $1,230.46 $1,565.87
Recent Transactions
Comparable Retail Properties
Comparable Offices
Comparable Apartments
Comparable Single Family Homes
277 Bryant Street 277 Bryant Street $882.58
221 Kipling Street 221 Kipling Street $1,084.79
11 Philips Road 11 Philips Road $1,565.87
1435 Channing Avenue 1435 Channing Avenue $1,482.28
864 Barron Avenue 864 Barron Avenue $969.86
316 Ramona Street
$788.00
420 Ramona 420 Ramona Street
Towle Apartments 696 Towle Way
$1,145.00
316 Ramona Street $1,422.76
Name Address Price/SF
780 Palo Alto Avenue 780 Palo Alto Avenue $961.46
670 Gilman Street $268.00
164 Hamilton 164 Hamliton Avenue $1,068.00
The Hamlet 4962 El Camino Real $1,940.00
2200 El Camino Real 2200 El Camino Real
$937.00
Address Price/SF
Name Address Price/SF
Lytton 130 Lytton Avenue $1,186.00
Hamilton
441 Emerson 441 Emerson Street $647.00
536 Ramona Street $900.00
Retail Space 564 University Avenue $366.00
El Camino Real 2401 El Camino Real
$1,073.00
Emerson 530 Emerson Street $900.00
University Avenue 370 University Avenue
$2.23
Webster
Ventura
Gilman
Everett
555 Hamilton Avenue $996.00
New Hamilton 550 Hamilton Avenue $733.00
Bryant 661 Bryant Street
$5.70
$4.50
Forest 430 Forest Avenue $1,041.00
Park 2555 Park Boulevard $497.00
$432.00
$568.00
Address Price/SF
255 Everett Avenue $578.00
Ramona 219 Ramona Street $752.00
628 Forest Avenue
$4.31
$4.00
$3.15
444 Webster Street $505.00
$377.00
330 Ventura Avenue $367.00
925 Waverley Street $373.00
425 Hale Street 425 Hale Street $1,474.10
$3.50
$3.36
$3.63
$3.20
$3.30
Rental Properties
Name
Forest Avenue
Waverley Palms
Name
Ramona
Matadero Street
Mark Twain Street
Tennyson Avenue
Price/SF (Monthly)
$5.24
$4.60
$3.22
$2.76
$3.20
Matadero
Mark Twain
Tennyson
Address
1450 Byron Street
Addison and Fife
4238 Rickeys Way
Magnolia Drive
544 Forest Avenue
Name
Byron
Addison
Rickeys Way
Magnolia
Forest
1735 Woodland Avenue
301 Curtner Avenue
Stanford Gardens
Greentree
501 Forest Avenue
1600 Sand Hill Road
861 University Avenue
1094 Tanland Drive
3875 Park Blvd
724 Arastradero Road
The Marc
Oak Creek Apartments
University Garden
Parker Palo Alto
Boardwalk Park Place
Arastradero West
Address Price/SF
1035 El Monte Avenue
249 State Street
$57.00
$30.60
$38.10
$34.75
$30.67
$31.60
$46.50
$33.02
855 El Camino Real
3990 El Camino Real
3920 Middlefield Road
4546 El Camino Real
1000 North Rengstorff Avenue
580 North Rengstorff Avenue
Name Address Price/SF (Monthly)
Town + Country Village
Blockbuster
330 Hillview Avenue
900 San Antonio Road
444 High Street
$106.20
$102.62
$84.46
$107.34
$91.83
$75.00
$96.79
Comparable Retail Properties
Charleston Shopping Center
Village Court
Rengstorff
Monta Loma Plaza
El Monte Center
First Shopping Center
$77.42
Name
Rent/SF (Annual) Sale Price/SF
Average Rent per Square Foot of All Mixed-use Property Types
Comparable Offices
Comparable Apartments
Comparable Single Family Homes
Name Address
Hillview
San Antonio
High Street
600 Hansen Way
Price/SF
300 Hamilton Ave.
Stanford Square
101 University Ave.
Bryant
Clocktower Square
300 Hamilton Avenue
100 Hamilton Avenue
101 University Avenue
335 Bryant Street
Sources: REIS, Zillow, Trulia
1/8" = 1'-0"
1
Elevation 1 - a
Retail
Horizontal
Vertical
Pedestrian
Residential lobby
Programmatic Blocking
Circulation
Concept Diagrams
Exciting Sidewalk Exciting Sidewalk
Height Relationship Greenery
Northwest Elevation
Design, Cont.

More Related Content

Viewers also liked

Report Marketing territoriale 24-07-15
Report Marketing territoriale 24-07-15Report Marketing territoriale 24-07-15
Report Marketing territoriale 24-07-15MINDBOOK
 
Architecture Tradeoff Analysis Method
Architecture Tradeoff Analysis MethodArchitecture Tradeoff Analysis Method
Architecture Tradeoff Analysis MethodCS, NcState
 
聆聽的方式 Ways of Listening
聆聽的方式 Ways of Listening聆聽的方式 Ways of Listening
聆聽的方式 Ways of Listening柏豪 紀
 
GFMP-The-future-of-internal-communication-Report-2016
GFMP-The-future-of-internal-communication-Report-2016GFMP-The-future-of-internal-communication-Report-2016
GFMP-The-future-of-internal-communication-Report-2016GFMP Management Consultants
 

Viewers also liked (6)

Report Marketing territoriale 24-07-15
Report Marketing territoriale 24-07-15Report Marketing territoriale 24-07-15
Report Marketing territoriale 24-07-15
 
Architecture Tradeoff Analysis Method
Architecture Tradeoff Analysis MethodArchitecture Tradeoff Analysis Method
Architecture Tradeoff Analysis Method
 
聆聽的方式 Ways of Listening
聆聽的方式 Ways of Listening聆聽的方式 Ways of Listening
聆聽的方式 Ways of Listening
 
GFMP-The-future-of-internal-communication-Report-2016
GFMP-The-future-of-internal-communication-Report-2016GFMP-The-future-of-internal-communication-Report-2016
GFMP-The-future-of-internal-communication-Report-2016
 
2.2 reflexion
2.2 reflexion2.2 reflexion
2.2 reflexion
 
Adaptació conte
Adaptació conteAdaptació conte
Adaptació conte
 

Similar to Pojingliu Work Sample

Landbanking in California - Best Retirement Solution - post by Sameer Pimpalk...
Landbanking in California - Best Retirement Solution - post by Sameer Pimpalk...Landbanking in California - Best Retirement Solution - post by Sameer Pimpalk...
Landbanking in California - Best Retirement Solution - post by Sameer Pimpalk...Sameer Pimpalkhute
 
Palatine Real Estate and Community Information
Palatine Real Estate and Community InformationPalatine Real Estate and Community Information
Palatine Real Estate and Community InformationCorinne Guest
 
Caruso_Temple,StreetRetail_101915
Caruso_Temple,StreetRetail_101915Caruso_Temple,StreetRetail_101915
Caruso_Temple,StreetRetail_101915Champaign Williams
 
Trending developments vol 3, issue 9
Trending developments vol 3, issue 9Trending developments vol 3, issue 9
Trending developments vol 3, issue 9froed
 
University of Missouri HEEF Real Estate Proposal
University of Missouri HEEF Real Estate ProposalUniversity of Missouri HEEF Real Estate Proposal
University of Missouri HEEF Real Estate ProposalJoshua Vaslie
 
Riverwalk Marketing Plan
Riverwalk Marketing PlanRiverwalk Marketing Plan
Riverwalk Marketing Plancyph4legend
 
2018 LA Tech & Venture Scene | Amplify.LA
2018 LA Tech & Venture Scene | Amplify.LA2018 LA Tech & Venture Scene | Amplify.LA
2018 LA Tech & Venture Scene | Amplify.LAEric Pakravan
 
Net lease-7-eleven-property-for-sale
Net lease-7-eleven-property-for-saleNet lease-7-eleven-property-for-sale
Net lease-7-eleven-property-for-saleThe Boulder Group
 
City of Palo Alto: A look at 2013's year in review
City of Palo Alto: A look at 2013's year in reviewCity of Palo Alto: A look at 2013's year in review
City of Palo Alto: A look at 2013's year in reviewpaloaltomanager
 
Morson St. Tap House.pdf
Morson St. Tap House.pdfMorson St. Tap House.pdf
Morson St. Tap House.pdfJanaGough
 
South Park Development Presentation
South Park Development PresentationSouth Park Development Presentation
South Park Development PresentationJordan Dias
 
Investment webinar about Oklahoma City real estate investment
Investment webinar about Oklahoma City real estate investmentInvestment webinar about Oklahoma City real estate investment
Investment webinar about Oklahoma City real estate investmentJoe Pryor
 
FourYear_ThirdPlace_UofFlorida
FourYear_ThirdPlace_UofFloridaFourYear_ThirdPlace_UofFlorida
FourYear_ThirdPlace_UofFloridaSteven Harrison
 
The New American Dream: Why People Are Choosing to Rent
The New American Dream: Why People Are Choosing to RentThe New American Dream: Why People Are Choosing to Rent
The New American Dream: Why People Are Choosing to RentSuong Nguyen
 
Fargo Open House
Fargo Open HouseFargo Open House
Fargo Open Housetthenne
 
ASSET PROTECTION NEWSLETTER JANUARY 2016 ISSUE
ASSET PROTECTION NEWSLETTER JANUARY 2016 ISSUEASSET PROTECTION NEWSLETTER JANUARY 2016 ISSUE
ASSET PROTECTION NEWSLETTER JANUARY 2016 ISSUESteven Rich
 
Ameriholdings LakePoint Brochure FINAL 3.2.15 hi-res READER
Ameriholdings LakePoint Brochure FINAL 3.2.15 hi-res READERAmeriholdings LakePoint Brochure FINAL 3.2.15 hi-res READER
Ameriholdings LakePoint Brochure FINAL 3.2.15 hi-res READERMichael Woyan
 

Similar to Pojingliu Work Sample (20)

Landbanking in California - Best Retirement Solution - post by Sameer Pimpalk...
Landbanking in California - Best Retirement Solution - post by Sameer Pimpalk...Landbanking in California - Best Retirement Solution - post by Sameer Pimpalk...
Landbanking in California - Best Retirement Solution - post by Sameer Pimpalk...
 
Palatine Real Estate and Community Information
Palatine Real Estate and Community InformationPalatine Real Estate and Community Information
Palatine Real Estate and Community Information
 
Caruso_Temple,StreetRetail_101915
Caruso_Temple,StreetRetail_101915Caruso_Temple,StreetRetail_101915
Caruso_Temple,StreetRetail_101915
 
Net Lease Property For Sale
Net Lease Property For SaleNet Lease Property For Sale
Net Lease Property For Sale
 
Trending developments vol 3, issue 9
Trending developments vol 3, issue 9Trending developments vol 3, issue 9
Trending developments vol 3, issue 9
 
University of Missouri HEEF Real Estate Proposal
University of Missouri HEEF Real Estate ProposalUniversity of Missouri HEEF Real Estate Proposal
University of Missouri HEEF Real Estate Proposal
 
Riverwalk Marketing Plan
Riverwalk Marketing PlanRiverwalk Marketing Plan
Riverwalk Marketing Plan
 
Sky_BusinessClass
Sky_BusinessClassSky_BusinessClass
Sky_BusinessClass
 
2018 LA Tech & Venture Scene | Amplify.LA
2018 LA Tech & Venture Scene | Amplify.LA2018 LA Tech & Venture Scene | Amplify.LA
2018 LA Tech & Venture Scene | Amplify.LA
 
Net lease-7-eleven-property-for-sale
Net lease-7-eleven-property-for-saleNet lease-7-eleven-property-for-sale
Net lease-7-eleven-property-for-sale
 
City of Palo Alto: A look at 2013's year in review
City of Palo Alto: A look at 2013's year in reviewCity of Palo Alto: A look at 2013's year in review
City of Palo Alto: A look at 2013's year in review
 
Morson St. Tap House.pdf
Morson St. Tap House.pdfMorson St. Tap House.pdf
Morson St. Tap House.pdf
 
South Park Development Presentation
South Park Development PresentationSouth Park Development Presentation
South Park Development Presentation
 
Investment webinar about Oklahoma City real estate investment
Investment webinar about Oklahoma City real estate investmentInvestment webinar about Oklahoma City real estate investment
Investment webinar about Oklahoma City real estate investment
 
FourYear_ThirdPlace_UofFlorida
FourYear_ThirdPlace_UofFloridaFourYear_ThirdPlace_UofFlorida
FourYear_ThirdPlace_UofFlorida
 
The New American Dream: Why People Are Choosing to Rent
The New American Dream: Why People Are Choosing to RentThe New American Dream: Why People Are Choosing to Rent
The New American Dream: Why People Are Choosing to Rent
 
Moving to Charlotte NC
Moving to Charlotte NCMoving to Charlotte NC
Moving to Charlotte NC
 
Fargo Open House
Fargo Open HouseFargo Open House
Fargo Open House
 
ASSET PROTECTION NEWSLETTER JANUARY 2016 ISSUE
ASSET PROTECTION NEWSLETTER JANUARY 2016 ISSUEASSET PROTECTION NEWSLETTER JANUARY 2016 ISSUE
ASSET PROTECTION NEWSLETTER JANUARY 2016 ISSUE
 
Ameriholdings LakePoint Brochure FINAL 3.2.15 hi-res READER
Ameriholdings LakePoint Brochure FINAL 3.2.15 hi-res READERAmeriholdings LakePoint Brochure FINAL 3.2.15 hi-res READER
Ameriholdings LakePoint Brochure FINAL 3.2.15 hi-res READER
 

Pojingliu Work Sample

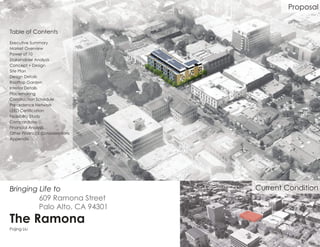
  • 1. 609 Ramona Street Palo Alto, CA 94301 The Ramona Bringing Life to Current Condition Proposal Pojing Liu Table of Contents Executive Summary Market Overview Power of 10 Stakeholder Analysis Concept + Design Site Plan Design Details Rooftop Garden Interior Details Placemaking Construction Schedule Precedence Network LEED Certification Feasibility Study Comparables Financial Analysis Other Financial Considerations Appendix
  • 2. 609 Ramona Street Stanford University Downtown Palo Alto Executive Summary Dear Mr. Allen and Prospective Investors, We are pleased to present you an exciting opportunity to invest in what will be a timeless structure in the dynamic economy of Silicon Valley. Silicon Valley is a breeding ground for innovative technology giants and disruptive startups like Google, Facebook, Apple and Tesla Motors. The epicenter of Silicon Valley is Palo Alto, home to Xerox, Hewlett Packard and Stanford University. High paying technology and finance jobs are bringing in an influx of well-educated professionals, pushing already high real estate prices even further into the stratosphere. Let us introduce you to The Ramona. Located at 609 Ramona Street in Downtown Palo Alto (above right), this underappreciated property is located within three blocks of several bus routes, Caltrain, public parks, Stanford University’s sprawling garden campus, and locally-owned restaurants lining University Avenue. The existing structure was built decades ago, and due to poor upkeep and marketing by the current owner, the property has failed to attract lasting tenants in spite of it sitting in and around a bustling area. We propose purchasing 609 Ramona and the two adjoining properties, all of which are for sale, and replacing the existing structures with a five story, mixed-use work of art. High demand, high prices, and cap rates below 4% for quality properties warrant this a viable strategy. The building will consist of three retail spaces on the main floor. To comply with the city’s FAR, the building will be set back ten to twelve feet on each side, allowing us to create an exciting sidewalk that will benefit our tenants. We will seek out and work with businesses in hopes of making each of them a ‘third place’ for our residents and the community. The residences will consist of 22 apartments in a variety of sizes ranging from studio apartments to luxury lofts. Acquisition, demolition and construction of the new property are expected to cost about $18.9MM. With a 6% cap rate, which is higher than the market’s average of 4-5%, we expect an IRR of 12%. However, with a 4.5% cap rate, which is more in line with the market, the IRR is projected to be 22% upon exit. Attached are design proposals, placemaking objectives and financial projections that highlight this property’s potential. We believe that with your support, this venture will pay large dividends to investors and the community. Sincerely, Brody Mulderig, Lyla Feinsod, Bedant Bhutia, Pojing Liu Dear Mr. Allen and Prospective Investors, We are pleased to present you an exciting opportunity to invest in what will be a timeless structure in the dynamic economy of Silicon Valley. Silicon Valley is a breeding ground for innovative technology giants and disruptive startups like Google, Facebook, Apple and Tesla Motors. The epicenter of Silicon Valley is Palo Alto, home to Xerox, Hewlett Packard and Stanford University. High paying technology and finance jobs are bringing in an influx of well-educated professionals, pushing already high real estate prices even further into the stratosphere. Let us introduce you to The Ramona. Located at 609 Ramona Street in Downtown Palo Alto (above right), this underappreciated property is located within three blocks of several bus routes, Caltrain, public parks, Stanford University’s sprawling garden campus, and locally-owned restaurants lining University Avenue. The existing structure was built decades ago, and due to poor upkeep and marketing by the current owner, the property has failed to attract lasting tenants in spite of it sitting in and around a bustling area. We propose purchasing 609 Ramona and the two adjoining properties, all of which are for sale, and replacing the existing structures with a five story, mixed-use work of art. High demand, high prices, and cap rates below 4% for quality properties warrant this a viable strategy. The building will consist of three retail spaces on the main floor. To comply with the city’s FAR, the building will be set back twelve to fifteen feet on each side, allowing us to create an exciting sidewalk that will benefit our tenants. We will seek out and work with businesses in hopes of making each of them a ‘third place’ for our residents and the community. The residences will consist of 22 apartments in a variety of sizes ranging from studio apartments to luxury lofts. Acquisition, demolition and construction of the new property are expected to cost about $18.9MM. With a 6% cap rate, which is higher than the market’s average of 4-5%, we expect an IRR of 12%. However, with a 4.5% cap rate, which is more in line with the market, the IRR is projected to be 22% upon exit. Attached are design proposals, placemaking objectives and financial projections that highlight this property’s potential. We believe that with your support, this venture will pay large dividends to investors and the community. Sincerely, Pojing Liu Executive Summary
  • 3. ...To Micro Not far down the peninsula sits an expensive suburb of about 65,000 people known as Palo Alto. Palo Alto earns the top spot in the US for the percentage of the population holding advanced degrees. Ten of the Bay Area’s 44 billionaires claim Palo Alto as their home (see map). The average home price for the city has risen by 12.5% over the past year, and now sits at $1.8MM. Over the past five years, rents have increased more than 45% in Palo Alto and are expected to outpace the broader market. To one unfamiliar with the market, a glance at the preceding data might draw them to conclude that Palo Alto is a ritzy community like Beverly Hills where sprawling estates consume the landscape. This is generally not the case as most homes in the city are modest and would be considered middle-class in other neighborhoods throughout the US. Lavish displays of wealth are relatively rare unlike Palo Alto’s high-priced counterparts. Instead, residents are known for embracing the most progressive technologies and ideas (think Segway and Tesla). Given the housing shortage and progressive mindset, we believe our proposal, which markets to these sentiments, will be well received by the city, investors and surrounding community. 3 http://www.city-data.com – Top Cities with Master’s or Doctorate Degrees 4 Data provided by Zillow 5 http://www.chicagobusiness.com – April, 7 2014, ‘Inside Sam Zell’s low-rent Silicon Valley Housing Strategy’ Market Overview From Macro... The San Francisco Bay is a great place to be in 2014 for working professionals. According to the Bay Area Council Economic Institute, the area has a GDP of $535 billion, which ranks 19th when compared to national economies. GDP is $74,815 per person, the highest in the world, and almost twice the US national average. It is also one of the most educated workforces in the country, with a high percentage of residents holding advanced degrees. Economic forecasts predict that the Bay Area will continue to outperform the broader economy. All of this translates to a booming economy and expensive real estate. San Francisco recently passed New York City as the most expensive real estate in America on a per square foot basis. High prices aren’t confined just to the city of San Francisco, as real estate prices for most of the Bay are pushed upward by land constraints. There is a concentration of Fortune 500 companies, diverse agriculture, and higher educational institutions in the area. In addition to so much industry, the Bay Area enjoys a comfortable climate and provides year-round outdoor activities. It is within driving distance to Yosemite and Redwood National Parks, Napa and Sonoma Valley wineries, the Pacific Coast and world-class ski resorts. Given the economic and lifestyle considerations, it is clear that there is a lot going on in the area. 1 http://www.bayareaeconomy.org – 2013 Economic Forecast 2 http://www.slate.com – Andy Kiersz, March, 17 2014
  • 4. Go across the street to shop for gifts and local art at University Art. The Palo Alto Public Library is less than a block away. San Francisco or down to San Jose. Head across the street and grab a bus to work or campus. Or head two blocks the other way and buy your produce at the Palo Alto Farmer’s Market. Walk two blocks and do your grocery shopping at Whole Foods. Grab a football and a picnic basket and spend the afternoon at Heritage Park. Walk to University Avenue and enjoy a movie at the historic Stanford Theatre. o the Caltrain Station and head up to ancisco or down to San Jose. cross the street and grab a bus to campus. a, or n or this losest Power of 10 Enjoy a summer twilight concert across the street or watch from your balcony. Walk outside an dozens of othe restaurants. The Project for Public Spaces introduced the ‘Power of 1 making desirable public places. We could have easily m location as there is so much to do within walking distanc and most diverse features that will make The Ramona a e Caltrain Station and head up to sco or down to San Jose. s the street and grab a bus to mpus. r his est Power of 10 Enjoy street Go across the street to shop fo local art at University Art. The bloc Th m lo a Enjoy a summer twilight concert across the street or watch from your balcony. shop for gifts and rt. The Palo Alto Public Library is less than a block away. Walk to the Caltrain Station and head up to San Francisco or down to San Jose. Head across the street and grab a bus to work or campus. Walk outside and enjoy dinner at Nola, or dozens of other highly rated local restaurants. Walk two blocks and do your grocery shopping at Whole Foods. The Project for Public Spaces introduced the ‘Power of 10’ framework to assist in making desirable public places. We could have easily made a ‘Power of 20’ for this location as there is so much to do within walking distance. We chose the ten closest and most diverse features that will make The Ramona a great place to live. Grab a football and a pic spend the afternoon at H The Palo Alto Public Library is less than a block away. Or head two blocks the other way and buy your produce at the Palo Alto Farmer’s Market. Walk two blocks and do your grocery shopping at Whole Foods. nic basket and eritage Park. Walk to University Avenue and enjoy a movie at the historic Stanford Theatre. block away. Or head two blo your produce at Market. W sh Grab a football and a picnic basket and spend the afternoon at Heritage Park. Walk to University Avenue and enjoy a movie at the historic Stanford Theatre. oss the han a Walk to the Caltrain Station and head up to San Francisco or down to San Jose. Head across the street and grab a bus to work or campus. Walk outside and enjoy dinner at Nola, or dozens of other highly rated local restaurants. Walk two blocks and do your grocery o within walking distance. We chose the ten closest will make The Ramona a great place to live. Go across the street to shop for gifts and local art at University Art. Head a few blocks and buy your produce at the Palo Alto Farmer’s Market. The Project for Public Spaces introduced the ‘Power of 10’ framework to assist in making desirable public places. All of these sites are in addition to the placemaking efforts we have made to the street and the property itself. Ten of the most desirable city comforts are highlighted here. Grab a football and a picnic basket to spend the afternoon at Heritage Park. Head across the street and grab a bus to work or campus. The Palo Alto Public Library is less than a block away. Walk to University Avenue and enjoy a movie at the historic Stanford Theatre. Walk outside and enjoy dinner at Nola, or dozens of other highly rated local restaurants. Walk to the Caltrain Station and head up to San Francisco or down to San Jose. Enjoy a summer twilight concert across the street or watch from your balcony. Walk two blocks and do your grocery shopping at Whole Foods. Power of 10 Why you want to be here!
  • 5. Stakeholder Analysis Stanford University Palo Alto City Hall Public Schools Police and FirefightersStreet-level Retailers Local Residents Stanford University is the city’s largest employer with over 10,000 people on its payrolls. The school has had difficulty in the past recruiting staff because of the high cost of living. Stanford even went so far to develop part of its campus and sell homes at below market prices to attract talent. Palo Alto has a made it a point to support developments that provide densification. Environmental concerns, traffic, cost of living and overall quality of life have led to the city approving multiple story developments in the downtown area. Public teachers aren’t what one would consider as high paid. This creates big challenges for the school district as its teachers face long commutes from more affordable areas. More housing will help to alleviate this concern over time. Any retailer with a presence on the street would be happy to have more people walking past and spending time in front of their stores. Our placemaking plans will not only benefit our tenants, but neighbors as well. Local residents want great places to eat, great places to walk, and great places to shop. Additionally, attractive and timeless architecture enhances the appeal of their community and serves to protect their property values. Police officers and firefighters face the same problems as teachers: cost of living. But a development like The Ramona makes their job easier as updated building codes may prevent fires. Well lit, attractive properties may help prevent petty crimes.
  • 6. UP 3005 SF re ta il 2 2 2243 SF re ta il 3 3 2630 SF re ta il 1 1 815 SFResid entlo bby 1 209 SF Gara ge 1 209 SF Gara ge 2 209 SF Gara ge 4 209 SF Gara ge 5 67 SF Ele vato r 1 67 SF Ele vato r 2 11'-7" 141'-119/16" 60'-59/16" 69'-11" 209 SF Gara ge 3 www.a uto desk.com /revit Scale Date Dra wn By Checked By Pro jectNum ber Consultant Addre ss Addre ss Addre ss Phone Consultant Addre ss Addre ss Addre ss Phone Consultant Addre ss Addre ss Addre ss Phone Consultant Addre ss Addre ss Addre ss Phone Consultant Addre ss Addre ss Addre ss Phone 1/8 "= 1'-0" 4/1 3/2 014 1:2 4:2 7 PM 02 FloorPlan Level1Owner ProjectNam e Checker Auth or Issue Date ProjectNum ber No. Description Date 1/8 "= 1'-0" 1 Level1 CreatingWOW!Architecture Surrounding Architecture The residents in this Palo Alto neighborhood are very sensitive about new architecture introducedtothecity.Thisdesignspeakstothe surrounding buildings while adding modern appeal to the residents it wishes to attract. Ground Floor Retail, Garages, Residential Access Residential Retail Horizontal Vertical Pedestrian Residential lobby Programmatic Blocking Circulation Concept Diagrams Exciting Sidewalk Exciting Sidewalk Height Relationship Greenery There are three proposed retail units at street level. One tenant exists in the current group of buildings. Reposado is a highly-rated, local restaruant that we would love to invite to occupy the corner unit. This would provide outdoor dining, greater street presence and more square footage for Reposado. There are five parking garages in the back of the structure, each of which will have hook-up capabilities for electric and hybrid vehicles. As developers interested in a more sustainable community, we will give precedence to residents with hybrid vehicles for this desirable amenity. Concept + Design
  • 7. This site is a Walker’s Paradise! Private Patio Outdoor Dining Solar Panels Green Roof Overlook CreatingaSenseofPlace Walkscore:98 The intention of site design is to create places that both the public and residents of the building can enjoy. A revitalized street design and a green roof garden are incorporated into the design. Sustainable features, such as a vegetation wall, solar panels and rain gardens are also utilized to create a sense of place. Building Green Roof Residents Only Public Space Outdoor Dining Site Boundry Pedestrian Circulation Outdoor Living Room Site Plan
  • 8. Wooden Slats, Sun Shading White Concrete Double-Pane Glass Permeable Pavers The Ramona is set back fifteen feet from the street which allows for a strong pedestrian presence, exciting the sidewalk and catering to a walker-friendly community. A white concrete and wood slat facade brings an exciting modern interpretation of the surrounding architecture. Large overhangs function as solar shading that assist in the LEED Certification of the building. The large glass facade on the first floor opens up the building to the street, inviting pedestrians to enter from the sidewalk. Some of the glass opens garage-door style to blur the line between sidewalk and building. Design Details
  • 9. Green Wall Outdoor Living Room Planters Planting Bed and Rain Garden Aside from making The Ramona a more desirable place to live, the green roof has several practical applications. The private resident outdoor living space benefits our resident’s quality of life via: Growing Local Produce Reducing Heat Island Effect Contributing to LEED Certification Creating a Private Oasis Saving on Energy Consumption Conserving Rain Water Developing Resident Community RooftopGarden
  • 10. Scale Date Drawn By Checked By Project Num ber 1/4" = 1'-0" 4/13/2014 1:21:07 PM A101 Unnam ed Owner Project Nam e Checker Author Issue Date Project Num ber 1/4" = 1'-0" 1 Level 1 Beautiful Polished Concrete Countertops Claw Foot Tub We designed apartments of various sizes to attract people in different stages of life and income. Per floor, there are two studios, two one- bedrooms, and four two-bedrooms. Each unit has at least one exterior balcony to take advantage of the street presence and fresh California air. The top floor consists of lofts that expand the one and two bedroom apartments into luxurious three and four bedroom units with 360 degree views of downtown Palo Alto.Typical 2 bedroom 925 Sq.Ft. 2 bed, 2 bath Reclaimed Wood Floors Modern Kitchen Chic Exposed Brick Walls Modern Glass Shower Floor to Ceiling Nanawall Modern Fixtures UP UP 495 SF studio 1 553 SF studio 2 802 SF 2 bed 6 676 SF 1 bed 1809 SF 1 bed 2 883 SF 2 bed 1 1027 SF 2 bed 2 109'-119/16" 31' - 0 1/4" 134'-0" 85' - 6" 67 SF Elevator 1 65 SF Elevator 2 923 SF 2 bed 3 Scale Date Drawn By Checked By ProjectNum ber 1/8"= 1'-0" 14 1:38:3 8 PM 01 FloorPlan Level2Owner ProjectNam e Checker Author Issue Date ProjectNum ber 1/8 "= 1'-0" 1 Level2 Interior Details
  • 11. Outdoor tables prioritize the pedestrian presence on the street, adding another layer of program to the streetscape. Seating that spills from the building entices people from the sidewalk to enter inside. Planters add nature to the sidewalk as well as additional seating space on raised planter beds. The pedestrian is more comfortable in urban settings where nature has a strong presence. Outdoor benches allow the streetscape to become a pedestrian rest point. It encourages street conversation, people-watching, and provides areas to rest and wait for public transportation. By widening the sidewalk, we are able to incorporate many activities beyond pedestrian circulation such as outdoor seating, street art, conversation spots, and nature. Adding trees to the streetscape provides shading which is essential for the hot sun in Palo Alto. It also adds the nature element to an urban setting. Outdoor solar lights provide light to make the street accessible and safe 24 hours per day. By using solar panels, it is a low-cost, low-energy investment. A rooftop garden provides an area of nature/refuge for the residents. It will be used as a green roof as well as community garden activities. It is a substitute for the typical urban yard in an urban setting. A green wall located adjacent to the community garden/green roof creates a presence of nature not often seen in urban settings. This will add to the buildings LEED Certification. It also is a marketing strategy for young professionals who are passionate about sustainability. Outdoor Tables Planters Green Wall Benches Wide Sidewalks, Street Art Outdoor Solar Lights Trees/Nature Rooftop Garden The Art of Placemaking
  • 12. Construction Schedule Timeline & Gantt Chart The construction schedule shows a total of 52 weeks as the project duration from the date of the Notice to proceed to date of completion. Critical activities are subsequently represented. The project construction schedule is shown in three forms to give us a clear idea about the activities in construction: 1. Timeline: This gives us a rough idea about the duration of the project with respect to the start and end date of the project. We can clearly see that the start date of the project is 4th April, 2014 and the end date of the project is 18th June, 2015. 2. Gantt Chart: This gives us a detail information regarding each activity of the construction phase. The length of horizontal bars represents the amount of time for each activity. The red colored bars denote the critical activities and hence special emphasis should be given to these activities so as to complete the construction on time. The construction schedule shows a total of 52 weeks from the date of the Notice to Proceed to the date of completion. Critical activities involved in the development of this project are illustrated to the left and outlined below: The project construction schedule is shown in three forms (continued on following page) to clarify tasks required to successfully construct a project of this nature. 1. Timeline: The construction timeline to the top left gives us a rough idea of the duration of the project with respect to the start and end dates. We can clearly see that the start date of the project is April 4, 2014 and the end date of the project is June 18, 2015. 2. Gantt Chart: This gives us a detailed information regarding each step required during the construction phase. The length of horizontal bars represents the amount of time expected for each task. The red colored bars denote the critical activities. Special emphasis should be devoted to these assignments in order to complete the construction on time. Residential Retail Horizontal Vertical Pedestrian Residential lobby Programmatic Blocking Circulation Exciting Sidewalk Exciting Sidewalk Residential Retail Horizontal Vertical Pedestrian Residential lobby Programmatic Blocking Circulation Exciting Sidewalk Exciting Sidewalk Residential Retail Horizontal Vertical Pedestrian Residential lobby Programmatic Blocking Circulation Concept Diagrams Exciting Sidewalk Exciting Sidewalk Height Relationship Greenery Residential Retail Horizontal Vertical Pedestrian Residential lobby Programmatic Blocking Circulation Concept Diagrams Exciting Sidewalk Exciting Sidewalk Height Relationship Greenery Construction Schedule
  • 13. Precedence Network 3. Precedence Network: The precedence network was produced using Critical Path Method. This provides us with a systematic approach and helps us to understand which activity we have to complete before proceeding to the next activity. The thickened lines in the precedence network diagram links the critical activities, when delayed will delay the completion of the whole project. Resources: Microsoft Project; Microsoft Visio Precedence Network 3. Precedence Network: The precedence network was produced using Critical Path Method. This provides us with a systematic approach and helps us to understand which activity we have to complete before proceeding to the next task. The thickened lines in the precedence network diagram links the critical assignments. If this is delayed, it will postpone the completion of the whole project.1/8" = 1'-0" 1 Elevation 1 - a 1/8" = 1'-0" 2 Elevation 2 - a Southwest Elevation Northeast Elevation www.autodesk.com/revit Scale Date Drawn By Checked By Project Number Consultant Address Address Address Phone Consultant Address Address Address Phone Consultant Address Address Address Phone Consultant Address Address Address Phone Consultant Address Address Address Phone 1/8" = 1'-0" 4/13/20141:24:39PM 04 Front Elevation Owner Project Name Checker Author Issue Date Project Number No. Description Date 1/8" = 1'-0" 1 Elevation 1 - a 1/8" = 1'-0" 2 Elevation 2 - a 1/8" = 1'-0" 3 Elevation 3 - a
  • 14. would be applying for LEED Gold Certification. Sustainable features: 1. Green roof: A Green roofing system of about 3309 SF is provided on the second floor of the building Benefits: Reduces the Urban Heat Island (UHI) Effect Retains the rainwater and also moderates the temperature of water Prolongs the service life of heating, ventilation, and HVAC systems in the building Helps improve air quality White roof: White roofing of approximately 4823 SF will be provided on the fifth floor of the building. Benefits: Reduces the energy use by about 20% in hot sunny weather Helps lower smog levels by lowering local temperatures 3. Solar Shading: Solar shades have been provided on the east and west side of the building to maximize the use of natural daylight. Benefits: Reduces the amount of energy required for heating or cooling Cuts down the amount of energy required for lighting Enhances indoor comfort and productivity 4. Solar Energy: Solar panels will be installed on the white roof to harness solar energy. Depending upon the requirement, the energy harnessed will be used for a variety of purposes. Benefits: Saves money Provides energy reliability and security Source: USGBC The Ramona qualifies for LEED Gold LEED Certification
  • 15. Economic Cycles - Robust market - High demand, low supply of housing Environmental - Contamination risk is minimal - Not in floodplain Market Research - Mixed use is encouraged - Influx of millenials Wow Architecture - Efficient design - Solar ready - Communal areas Equity & Debt - Approx. 70/30 debt to equity ratio - DSCR must > 1.2 Political Approval - City pushing for densification - FAR is within limits Community Goals - Walk Score of 98 - Attractive design - Affordable space Construction - Deconstruct existing structure - Qualifies for LEED Taxes - Property tax cannot exceed 1% - LLC pass-thru Sales & Leasing - Pro forma based on leasing only - Sales increase IRR Site Management - Exciting sidewalk benefits retailers - Placemaking Legal Relations - Crowdfunding - Local developers - Local contractors Feasibility Study Right: These diagrams were compiled from dozens of recently marketed properties in Palo Alto (see Appendix for more detail). The top diagram illustrates the ranges that properties rented for on a per square foot basis (annually) for offices, retail storefronts, apartments and individual homes while the bottom diagram illustrates sale prices for the same types of properties. While prices can vary widely based on many factors, the market data tells us that the average price per square foot across many property types is still very high. If the project sells or rents for the average market price, will it still make money? Yes. This is how we determined a baseline for construction type and mix. Based on our analysis, we determined that a mix of residential units and retail would provide the best long-term value. According data provided by REIS, of the 35 planned or proposed construction projects in the area, 28 of them are for office space. Per the diagram to the right, office space is clearly the most expensive type of space to rent. However, because so many proposed development projects consist of office space, we were concerned that the market may overbuild. Likewise, we feel that quality residential spaces are being neglected and that demand for well-planned residential developments will remain high. Finally, one of our goals is to help build a great community. Office space does little to excite the sidewalk and does not contribute in the same way residences and retail do in building an urban village. Below: Quantitative analysis of a project is important but only takes us so far. We used Peter Allen’s real estate development chart to map risks and opportunities from a holistic perspective. The Palo Alto market is very strong and has had an influx of high- paid millenials working in the technology industry. There is little concern for the site environmentally as there are no gas stations nearby and it does not sit in a floodplain. Palo Alto is a very progressive city that is pushing for densification. Our building will be LEED certified, have attractive design and provide for placemaking. Therefore, we expect that getting the city’s blessing will not be difficult.
  • 16. The Marc Circle Palo Alto 165 Forest Avenue Analysis: Closest Comparables The Marc is a luxury high rise off of University Avenue in Palo Alto that boasts some of the highest rental prices of any apartment complex in Palo Alto at about $80 annually per square foot. This means that a 675 square foot leases for upwards of $4500 per month. Pluses: On site gym and swimming pool. Two blocks from University Avenue and a short walk from Caltrain and bus stops. Minuses: Little to nothing to excite the sidewalk. Property is not mixed use. While there are a lot of ‘third places’ nearby, none are right next to the property. Location is inferior to The Ramona in terms of transit, shopping and dining. Circle Palo Alto is an ultra high-end mixed use property at the entrance to downtown. There are three condos sitting on top of two floors of Class A office space. Like we proposed for the top floor condos in The Ramona, the condos of Circle Palo Alto are two floors with access to a private rooftop garden. These condos recently sold between $3.7MM and $5.4MM each, depending on their size, which translates to about $1,250 per square foot. Pluses: Each unit has access to two underground parking spaces. The architecture allows for views on at least two sides of each condo, essentially making each condo a corner unit. Minuses: While the property sits directly on University Avenue, there has been no effort to excite the sidewalk at or near the property. Also, it sits right next to the Caltrain station and El Camino Real, potentially making traffic and noise a nuisance. 165 Forest Avenue is a mixed use property consisting of 2 bedroom 2 bathroom condos on top of a mix of retail and office. Several 1,285 square foot units were recently sold at $1.3MM each, putting the condos at just over $1,000 per square foot. Pluses: Fantastic location as it is two blocks from Caltrain, one block from a bus route, three blocks from a park, and it is adjacent to restaurants and retail shopping. Yet it is far enough away from high traffic areas to avoid traffic noise and congestion. Minuses: The street level real estate is lackluster as there are no big windows and no curb appeal to excite the sidewalk. The property lacks desirable communal areas like a garden or swimming pool. As already noted, we ran a detailed analysis of comparable properties to determine the range of sale prices and rents per square foot in Palo Alto. As no two properties are completely comparable, we selected the three closest comparables and noted their advantages and disadvantages with respect to The Ramona:
  • 17. Type End of Month Financing Fees Land Costs Hard Costs Soft Costs Contingency Interest Expense Equity Investment End of Month Loan Balance Assumptions Values CONSTRUCTIONLOAN 0 (250,000) (10,587,500) - - - - 6,408,437 (4,429,063) Total Hard Costs (6,626,181) 1 - - (552,182) (107,811) (33,000) (36,909) - (5,158,965) Total Soft Costs (1,293,737) 2 - - (552,182) (107,811) (33,000) (42,991) - (5,894,949) Contingency (395,996) 3 - - (552,182) (107,811) (33,000) (49,125) - (6,637,066) Land Costs (10,587,500) 4 - - (552,182) (107,811) (33,000) (55,309) - (7,385,368) Total Construction (18,903,413) 5 - - (552,182) (107,811) (33,000) (61,545) - (8,139,905) 6 - - (552,182) (107,811) (33,000) (67,833) - (8,900,731) Building Value (6% Cap) 21,361,457 7 - - (552,182) (107,811) (33,000) (74,173) - (9,667,896) LTV Limit 14,953,020 8 - - (552,182) (107,811) (33,000) (80,566) - (10,441,455) Loan Amount (13,600,692) 9 - - (552,182) (107,811) (33,000) (87,012) - (11,221,460) Equity Investment 6,408,437 10 - - (552,182) (107,811) (33,000) (93,512) - (12,007,964) 11 - - (552,182) (107,811) (33,000) (100,066) - (12,801,024) Closing Costs And Fees (250,000) 12 - - (552,182) (107,811) (33,000) (106,675) - (13,600,692) Annual Interest Rate 10.0% TOTAL FLOWS (250,000) (10,587,500) (6,626,181) (1,293,737) (395,996) (855,715) 6,408,437 (13,600,692) Monthly Interest Rate 0.8% Construction - The sum of the three lots is about 15,000 square feet with structure totaling about 43,000 square feet. Cost of construction in Palo Alto is high compared to the national average. We referenced Reed Construction Data in addition to their online tool, RS Means. Excluding land acquisition costs, hard and soft costs of construction are projected at $183 per square foot, with an added contingency of $9 per square foot for a total of $193 to construct this building. Financing - Based on a 6% cap rate, this building has an estimated value of $21.3MM. With 70% debt financing we would be allowed to borrow just under $15MM. However, most banks require a DSCR of 1.2, and based on our conservative pro forma statements, the total amount borrowed will be less. We assume a 10% interest rate on a loan with a monthly draw over the 12 month construction period. The loan will then be converted to a conventional commercial mortgage with an interest rate of 6% and closing costs of $250k. The final loan amount of $13.6MM will satisfy the bank’s DSCR of 1.2. Construction Cost Estimating Property Location: 609 Ramona Street Palo Alto, CA Approximate Lot Size (SF) : 15,125 Total Development Area (SF): 43,071 Floor - Area Ratio (FAR): 2.85 Palo Alto Cost Modifier: 178 Development Description Total Area (SF) Base Cost ($)/SF Total Base Cost ($) Cost/SF Cost/SF Condos / Apartments (Low Rise 2nd to 3rd Floor) 14,910 $ 93.23 $ 2,474,305.55 $ 165.95 $ 57.45 Condos / Apartments (Mid Rise 4th to 5th Floor) 12,268 $ 107.62 $ 2,350,102.24 $ 191.56 $ 54.56 Retail Stores 7,650 $ 90.73 $ 1,235,470.41 $ 161.50 $ 28.68 Residential Lobby 815 $ 85.50 $ 124,034.85 $ 152.19 $ 2.88 Green space: Social Area (Landscaping) 3,309 $ 3.32 $ 19,554.87 $ 5.91 $ 0.45 Hardscape 3,256 $ 9.32 $ 54,015.74 $ 16.59 $ 1.25 Parking Lot 863 $ 60.70 $ 93,243.70 $ 108.05 $ 2.16 Base Construction Cost Estimate 43,071 $ 6,350,727.36 $ 147.45 Total Base Cost of Construction Estimate $ 6,350,727.36 $ 147.45 Asbestos Abatement ($100,000 allowance) $ 100,000.00 $ 2.32 Demolition of Existing Building $ 67,813.20 $ 1.57 Site Work and Underground Utility Work (10 / SF of lot) $ 107,640.00 $ 2.50 Sub-Total of Hard Construction Costs $ 6,626,180.56 $ 153.84 Construction Management (4.0% of Hard Construction Costs) $ 265,047.22 $ 6.15 Initial Site Survey $ 6,000.00 $ 0.14 Foundation Analysis $ 45,000.00 $ 1.04 Architecture and Engineering Fees (8.2 % of Hard Construction Costs) $ 520,759.64 $ 12.09 Developer Fees (4% of Hard Construction Costs) $ 254,029.09 $ 5.90 LEED Costs & Certification (1% of Hard Construction Costs) $ 63,507.27 $ 1.47 Legal Fees (1% of Hard Construction Costs) $ 63,507.27 $ 1.47 Permit Fees (Per city of Palo Alto Schedule) $ 42,159.03 $ 0.98 Plan Review Fees (Per city of Palo Alto Schedule) $ 33,727.22 $ 0.78 Sub-Total of Soft Construction Costs $ 1,293,736.76 $ 30.04 Total Project Hard and Soft Construction Costs $ 7,919,917.32 $ 183.88 Contingency (5%) $ 395,995.87 $ 9.19 Total Construction Costs w/ Contingency $ 8,315,913.18 $ 193.07 Financial Analysis
  • 18. Net Operating Income Period: Construction Phase 1 2 3 4 5 Gross potential rent: Retail $ - $ 397,800 $ 413,712 $ 430,260 $ 447,471 $ 465,370 Gross potential rent: Apartment - 1,727,418 1,796,515 1,868,375 1,943,110 2,020,835 Gross potential rent: Parking - 30,000 31,200 32,448 33,746 35,096 = Total gross potential income: - 2,155,218 2,241,427 2,331,084 2,424,327 2,521,300 - Vacancy: Retail - 27,846 28,960 30,118 31,323 32,576 - Vacancy: Apartment - 120,919 125,756 130,786 136,018 141,458 - Vacancy: Parking - 2,100 2,184 2,271 2,362 2,457 = - Total revenue lost to vacancy - 150,865 156,900 163,176 169,703 176,491 - Collection loss: Retail - 19,890 20,686 21,513 22,374 23,268 - Collection loss: Apartment - 86,371 89,826 93,419 97,156 101,042 - Collection loss: Parking - 1,500 1,560 1,622 1,687 1,755 = - Total revenue lost to collections - 107,761 112,071 116,554 121,216 126,065 - Concessions: Retail - 15,912 20,686 21,513 22,374 23,268 - Concessions: Apartment - 69,097 89,826 93,419 97,156 101,042 - Concessions: Parking - 1,200 1,560 1,622 1,687 1,755 = - Total revenue lost to concessions - 86,209 112,071 116,554 121,216 126,065 + Expense recovery: Retail - 23,868 20,686 21,513 22,374 23,268 + Expense recovery: Apartment - 103,645 89,826 93,419 97,156 101,042 + Expense recovery: Parking - 1,800 1,560 1,622 1,687 1,755 = + Total expense recovery - 129,313 112,071 116,554 121,216 126,065 = Effective gross income: - 1,939,696 1,972,456 2,051,354 2,133,408 2,218,744 - Operating expenses: Retail - 100,980 105,019 109,220 113,589 118,132 - Operating expenses: Apartment - 296,129 307,974 320,293 333,105 346,429 - Operating expenses: Parking - 900 936 973 1,012 1,053 = - Total operating expenses - 398,009 413,929 430,486 447,706 465,614 - Property taxes 105,875 200,000 208,000 216,320 224,973 233,972 = Net operating income: (105,875) 1,341,687 1,350,526 1,404,547 1,460,729 1,519,158 - Replacement reserve - 40,000 41,600 43,264 44,995 46,794 - Tenant improvements - 20,000 20,800 21,632 22,497 23,397 = NOI after reserves: $ (105,875) $ 1,281,687 $ 1,288,126 $ 1,339,651 $ 1,393,237 $ 1,448,967 Capitalized NOI at 6% $ 21,361,457 $ 21,468,773 $ 22,327,524 $ 23,220,625 $ 24,149,450 Potential Sources of Equity It is our opinion that equity holders in this project should be local as there is an added incentive to create real estate that enhances the community above the status quo. For that reason, we will seek equity through crowdfunding and/or partnering with local developers. Crowdfunding By the nature of US securities laws, crowdfunding is forced to ‘be local’. Investors must invest in the state in which they reside. Crowdfunding has become an ever more popular way for small investors to take part in the real estate market and now raises millions of dollars for single projects. Local Developers Local developers know the market best and can provide invaluable insight into a project of this scale. Peery Arrillaga is one of the largest landowners in Silicon Valley and the co-founders, Messrs. Peery and Arrillaga reside in the area. Thus, they have a vested interest in creating a great community through real estate. Key Data Assumptions Retail Rent ($/SF) - Annual $ 52 Residential Rent ($/SF) - Annual $ 77 Parking ($/Space) - Monthly $ 500 Vacancy: Retail 7% Vacancy: Apartment 7% Vacancy: Parking 7% Collection Loss: Retail 5% Collection Loss: Apartment 5% Collection Loss: Parking 5% Concessions: Retail 4% Concessions: Apartment 4% Concessions: Parking 4% Expense Recovery: Retail 6% Expense Recovery: Apartment 6% Expense Recovery: Parking 6% Operating Expenses: Retail ($/SF - Monthly) $ 1.10 Operating Expenses: Apartment ($/SF - Monthly) $ 1.10 Operating Expenses: Parking ($/Space - Monthly) $ 15 Property Taxes 1% Financial Analysis
  • 19. Cap Rate Exit Price 4.50% 5.00% 5.50% 6.00% 6.50% 7.00% 7.50% NOI $ 1,148,967 25,532,599 22,979,339 20,890,309 19,149,450 17,676,415 16,413,814 15,319,560 $ 1,248,967 27,754,822 24,979,339 22,708,490 20,816,116 19,214,876 17,842,385 16,652,893 $ 1,348,967 29,977,044 26,979,339 24,526,672 22,482,783 20,753,338 19,270,957 17,986,226 $ 1,448,967 32,199,266 28,979,339 26,344,854 24,149,450 22,291,800 20,699,528 19,319,560 $ 1,548,967 34,421,488 30,979,339 28,163,036 25,816,116 23,830,261 22,128,100 20,652,893 $ 1,648,967 36,643,710 32,979,339 29,981,218 27,482,783 25,368,723 23,556,671 21,986,226 $ 1,748,967 38,865,933 34,979,339 31,799,399 29,149,450 26,907,184 24,985,242 23,319,560 Cash Flow: Conventional Financing 0 1 2 3 4 5 Year of Operations Construction Phase 1 2 3 4 5 = NOI after reserves: $ (105,875) $ 1,281,687 $ 1,288,126 $ 1,339,651 $ 1,393,237 $ 1,448,967 + Income from Sale of Property - - - - - - - Debt Service (6% fixed loan) - 1,051,553 1,051,553 1,051,553 1,051,553 1,051,553 = Before-tax Cash Flow (105,875) 230,134 236,573 288,098 341,684 397,414 Debt Service Coverage Ratio (Covenant = 1.2) N/A 1.22 1.22 1.27 1.32 1.38 + Principal repayment - 242,098 257,029 272,882 289,713 307,581 - Depreciation (structure) - 302,397 302,397 302,397 302,397 302,397 - Depreciation (TI) - 2,857 2,857 2,857 2,857 2,857 Accumulated Depreciation - 305,254 610,508 915,762 1,221,016 1,526,270 - Amortization (of points) 12,500 12,500 12,500 12,500 12,500 12,500 Accumulated amortization 12,500 25,000 37,500 50,000 62,500 75,000 + Replacement reserve - 40,000 41,600 43,264 44,995 46,794 + Tenant improvements - 20,000 20,800 21,632 22,497 23,397 = Taxable income from operations (118,375) 214,478 238,248 308,122 381,135 457,432 * Tax rate (income from operations) 39.6% 39.6% 39.6% 39.6% 39.6% 39.6% = Tax bill from operations (46,877) 84,933 94,346 122,016 150,930 181,143 Before-tax cash flow (105,875) 230,134 236,573 288,098 341,684 397,414 - Tax bill (46,877) 84,933 94,346 122,016 150,930 181,143 = After-tax cash flow (58,999) 145,201 142,227 166,082 190,754 216,270 Payment - 1,051,553 1,051,553 1,051,553 1,051,553 1,051,553 Interest - 809,455 794,524 778,671 761,840 743,972 Principal - 242,098 257,029 272,882 289,713 307,581 Loan balance 13,600,692 13,358,593 13,101,564 12,828,681 12,538,968 12,231,387 Amortization of fees paid at closing 12,500 12,500 12,500 12,500 12,500 12,500 Remaining amortization $ 237,500 $ 225,000 $ 212,500 $ 200,000 $ 187,500 $ 175,000 Cash Flow at Sale Period: Beginning of Year 6 Gross sale price (6% Cap) $ 24,149,450 - Deductible sales expenses 1,207,472 = Net sale price 22,941,977 - Mortgage balance 12,231,387 = BTCF at sale 10,710,590 - Tax bill at sale 1,158,030 - Original cost 18,903,413 - Capital improvements - - Points/fees 250,000 = Appreciation component 3,788,564 Accumulated depreciation 1,526,270 + Total amortization 75,000 = Depreciation component 1,601,270 Appreciation tax (20%) 757,713 Depreciation tax (25%) 400,317 = Net cash after taxes 9,552,560 Cap Rate Levered IRR 4.5 22% 5 18% 5.5 15% 6 12% 6.5 8% 7 6% 7.5 3% Financial Analysis
  • 20. Other Financial Considerations Other Financial Considerations The financial models on the previous pages we believe are conservative and provide us a base case. The big question we had in our due diligence was “If this building were operated in the least profitable way in the current market conditions, would it make money?” Based on our conservative models, the answer is ‘yes’. In the current market, it costs less to rent a home than it does to purchase the same home with a conventional mortgage. The two examples to the right illustrate this phenomenon. Should either of these properties provide a tenant the option to buy, the monthly mortgage payment alone (after 20% down; this does not include taxes or insurance) is higher than the listed rental price. This is the scenario modeled in our financial projections. It is visually and quantifiably evident from our feasibility study that selling residential square footage yields a higher price than renting. We will illustrate the impact that selling off the top floor lofts (keeping the rest as rental) has on The Ramona’s financial returns below: 88 Roosevelt Circle 3 beds, 2 baths, 1,318 Square Feet Listed Rent: $4,400/month Estimated Value: $1,500,000 Mortgage (4.5%, 30 yr., 20% down): $6,228/month 2 beds, 2 baths, 1,632 Square Feet Listed Rent: $5,500/month Estimated Value: $1,400,000 Mortgage (4.5%, 30 yr., 20% down): $5,674/month 483 Forest Avenue Apartment D Source: Zillow Loft Sale $/SQFT     $800 $900 $1,000 $1,100 $1,200 9,902 SQFT $7,921,600 $8,911,800 $9,902,000 $10,892,200 $11,882,400 Selling the top floors, even at $800 per square foot, a price well below market, allows the investors to recapture all of their equity ($6.4MM) plus about $1.5MM. Current market conditions create a selling environment where $1,100 per square foot is closer to the average. Additionally, The Ramona is a premium property that has an outstanding location and trendy amenities. Because of these features, we believe this property will sell for above the average price per square foot. At $1,200 per square foot, investors would enjoy a 2x return on their investment from the sale of the lofts alone.   Lofts Sold at $1,000/SQFT Cap Rate 6.0% 5.5% 5.0% 4.5% IRR 67% 69% 70% 71% If all of the top floor lofts were sold at $1,000 per square foot and all other property assumptions remained equal (the remainder remains as rental units), IRR jumps dramatically. We feel this makes the project very exciting financially and provides the developer with some space to explore other options for the property, such as an affordable housing component. Suffice it to say, this project is financially viable in the current market and is likely to remain viable even if the Palo Alto real estate market softens.
  • 22. Comparable Properties for 609 Ramona Street, Palo Alto, CA 94301 Low Average High Low Average High $58.39 Office $75.00 $92.71 $107.34 $497.00 $1,075.75 $1,940.00 Retail $30.60 $37.78 $57.00 $366.00 $772.38 $1,073.00 Average Sale Price per Square Foot of All Mixed-use Property Types $918.01 Apartment $34.79 $57.37 $88.92 $348.40 $593.45 $977.60 House $33.12 $45.72 $62.86 $882.58 $1,230.46 $1,565.87 Recent Transactions Comparable Retail Properties Comparable Offices Comparable Apartments Comparable Single Family Homes 277 Bryant Street 277 Bryant Street $882.58 221 Kipling Street 221 Kipling Street $1,084.79 11 Philips Road 11 Philips Road $1,565.87 1435 Channing Avenue 1435 Channing Avenue $1,482.28 864 Barron Avenue 864 Barron Avenue $969.86 316 Ramona Street $788.00 420 Ramona 420 Ramona Street Towle Apartments 696 Towle Way $1,145.00 316 Ramona Street $1,422.76 Name Address Price/SF 780 Palo Alto Avenue 780 Palo Alto Avenue $961.46 670 Gilman Street $268.00 164 Hamilton 164 Hamliton Avenue $1,068.00 The Hamlet 4962 El Camino Real $1,940.00 2200 El Camino Real 2200 El Camino Real $937.00 Address Price/SF Name Address Price/SF Lytton 130 Lytton Avenue $1,186.00 Hamilton 441 Emerson 441 Emerson Street $647.00 536 Ramona Street $900.00 Retail Space 564 University Avenue $366.00 El Camino Real 2401 El Camino Real $1,073.00 Emerson 530 Emerson Street $900.00 University Avenue 370 University Avenue $2.23 Webster Ventura Gilman Everett 555 Hamilton Avenue $996.00 New Hamilton 550 Hamilton Avenue $733.00 Bryant 661 Bryant Street $5.70 $4.50 Forest 430 Forest Avenue $1,041.00 Park 2555 Park Boulevard $497.00 $432.00 $568.00 Address Price/SF 255 Everett Avenue $578.00 Ramona 219 Ramona Street $752.00 628 Forest Avenue $4.31 $4.00 $3.15 444 Webster Street $505.00 $377.00 330 Ventura Avenue $367.00 925 Waverley Street $373.00 425 Hale Street 425 Hale Street $1,474.10 $3.50 $3.36 $3.63 $3.20 $3.30 Rental Properties Name Forest Avenue Waverley Palms Name Ramona Matadero Street Mark Twain Street Tennyson Avenue Price/SF (Monthly) $5.24 $4.60 $3.22 $2.76 $3.20 Matadero Mark Twain Tennyson Address 1450 Byron Street Addison and Fife 4238 Rickeys Way Magnolia Drive 544 Forest Avenue Name Byron Addison Rickeys Way Magnolia Forest 1735 Woodland Avenue 301 Curtner Avenue Stanford Gardens Greentree 501 Forest Avenue 1600 Sand Hill Road 861 University Avenue 1094 Tanland Drive 3875 Park Blvd 724 Arastradero Road The Marc Oak Creek Apartments University Garden Parker Palo Alto Boardwalk Park Place Arastradero West Address Price/SF 1035 El Monte Avenue 249 State Street $57.00 $30.60 $38.10 $34.75 $30.67 $31.60 $46.50 $33.02 855 El Camino Real 3990 El Camino Real 3920 Middlefield Road 4546 El Camino Real 1000 North Rengstorff Avenue 580 North Rengstorff Avenue Name Address Price/SF (Monthly) Town + Country Village Blockbuster 330 Hillview Avenue 900 San Antonio Road 444 High Street $106.20 $102.62 $84.46 $107.34 $91.83 $75.00 $96.79 Comparable Retail Properties Charleston Shopping Center Village Court Rengstorff Monta Loma Plaza El Monte Center First Shopping Center $77.42 Name Rent/SF (Annual) Sale Price/SF Average Rent per Square Foot of All Mixed-use Property Types Comparable Offices Comparable Apartments Comparable Single Family Homes Name Address Hillview San Antonio High Street 600 Hansen Way Price/SF 300 Hamilton Ave. Stanford Square 101 University Ave. Bryant Clocktower Square 300 Hamilton Avenue 100 Hamilton Avenue 101 University Avenue 335 Bryant Street Sources: REIS, Zillow, Trulia
  • 23. 1/8" = 1'-0" 1 Elevation 1 - a Retail Horizontal Vertical Pedestrian Residential lobby Programmatic Blocking Circulation Concept Diagrams Exciting Sidewalk Exciting Sidewalk Height Relationship Greenery Northwest Elevation Design, Cont.