VIP Kolkata Call Girl Entally 👉 8250192130 Available With Room
Petrobras at a Glance: Pre-Salt Reservoirs
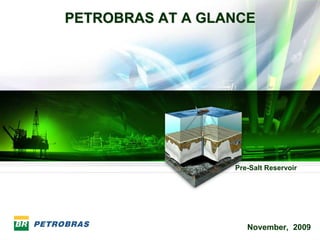
1. PETROBRAS AT A GLANCE
Pre-Salt Reservoir
November, 2009
1
2. DISCLAIMER
The presentation may contain forecasts CAUTIONARY STATEMENT
about future events. Such forecasts merely FOR US INVESTORS
reflect the expectations of the Company's
management. Such terms as "anticipate", The United States Securities and Exchange
"believe", "expect", "forecast", "intend", Commission permits oil and gas companies,
"plan", "project", "seek", "should", along with in their filings with the SEC, to disclose only
similar or analogous expressions, are used proved reserves that a company has
to identify such forecasts. These predictions demonstrated by actual production or
evidently involve risks and uncertainties,
whether foreseen or not by the Company. conclusive formation tests to be
Therefore, the future results of operations economically and legally producible under
may differ from current expectations, and existing economic and operating conditions.
readers must not base their expectations We use certain terms in this
exclusively on the information presented presentation, such as oil and gas
herein. The Company is not obliged to resources, that the SEC’s guidelines
update the presentation/such forecasts strictly prohibit us from including in
in light of new information or future filings with the SEC.
developments.
2
3. PETROBRAS: AN INVESTMENT GRADE, PUBLICLY
TRADED, MAJOR INTERNATIONAL OIL COMPANY
Incorporated in 1953 as government Government maintains controlling
monopoly for all hydrocarbon activities interest with 55% of voting shares
in Brazil
Originally established as a refinery of Market cap of approximately US$ 216
imported crude oil billion as of November 17, 2009
Became net exporter in 2006
Foreign currency ratings from Moody’s
60% of total equity capital (common and (Baa1), Standard & Poors (BBB-), and
preferred) is now publicly traded Fitch (BBB).
Crossed the Brazil Self 2MM bpd, A New E&P
Brazilian First Public Petrobras Full Upgraded to
$100 billion Sufficient in $200MM market Regulatory
Constitution Auction of Oil NYSE Listing Deregulation Investment
dollar Market Oil cap, Discovery Framework.
Amended Exploration Grade Issuer
Cap mark of new oil Pre-Salt and
Areas frontier: Pre Strategic
Salt (Tupi field) Areas
Nov 1995 June 1999 Aug 2000 Jan 2002 Oct 2005 2006 Apr 2006 2007 Aug 2009
3
4. DIVERSIFIED SHAREHOLDER BASE
60% of the economic value of Petrobras in private hands, but Government maintains control with 55% of
voting shares
More than 1,00,000 investors in Brazil and abroad
9 ,5 %
2 0 ,3 % 2 6 ,4 % Foreign
10 ,9 % 3 1,2 % 2 9 ,5 %
4 6 ,4 % 10 ,3 % 37,4%
18 ,0 % 9 ,9 % 8 ,0 % 7 ,9 % Bovespa
2 5 ,1%
2 3 ,1% 2 0 ,7 % 2 2 ,8 % 30,7%
53,6% 61,6%
44,4% 40,6% 40,1% 39,8%
Oct/1992 Jul/2000 After Aug/00 After Jul/01 Dec/2003 Nov /2009
offering offering
Gov ernment (1) Bov espa Brazil Bov espa Foreign ADRs
Free Float
46.4 38.4 55.6 59.4 59.9 60.2
(1) Includes BNDES / BNDESPAR
4
5. PETROBRAS IS THE MOST LIQUID STOCK IN VALUE
TRADED ON BOTH THE BOVESPA AND NYSE
Turnover NYSE & Bovespa
(Daily Average Turnover)
Turnover 2009YTD/2005 = 512%
(US$ MM) (% category and US$MM)
2000 1,930
1800 100%
90%
1600
80%
43% 43%
1400 1,344 47% 50% 53%
70%
1200 Nyse
PBR
992 60%
PBR/A
1000
Nyse 50%
PBR 20%
800 25% 21%
PBR/A 40% 20%
19%
600 6%
483 30%
6% 5% 5%
5% Bovespa
400 20%
219 Bovespa
PETR3 31%
PETR3
25% 27% 26% PETR4
200 PETR4 10% 22%
0 0%
2005 2006 2007 2008 2009 YTD 2005 2006 2007 2008 2009 YTD
PETR4 (Bovespa) PETR3 (Bovespa) PBR/A (Nyse) PBR (Nyse)
Turnover of PBR 3 times the volume of PBRA on the NYSE
Turnover of PN 5 times the volume of the ON
Probable explanation: Cultural. Brazilians familiar with PN´s and would not pay premium for ON´s
5
6. CORPORATE ORGANIZATION AND KEY
OPERATING RESULTS
Exploration & Downstream Gas &
Production Distribution Energy International Biofuels
(Supply)
Petrochemicals
Income from Operations
Summary Financials
G&E Distribution
(US$ billion- USGAAP)
2007 2008 1H09 2,7% 2,9%
Net Revenues 87.7 118.3 39.8
EBITDA 25.6 31.3 13.6 Domestic
41,8%
Net Income 13.1 18.9 6.6 Downstream 52,6% E&P
Capex 21.0 29.9 14.3
Total Debt(1) 21.9 27.4 34.6
Cash & Cash Equivalents 7.0 6.5 4.9
Net Debt 14.9 20.9 29.8
Total Equity 65.2 61.9 79.2
Total Assets 129.7 125.7 157.4
(1) Includes capital leases
6
7. A WORLD-CLASS, PUBLIC, INTEGRATED
ENERGY COMPANY
2008 Oil & Gas Production
3.9 3.8
Gas Production boe/d
3.2
Oil Production boe/d
2.5
(mmboe/d)
2.4 2.4
2.3
1.8
83%
(oil) 0.6
XOM BP RDS CVX PBR COP Total ENI BG
Source: Evaluate Energy and Company reports
5,675 2008 Refining Capacity Market Value as of November 17, 2009
356
3,905
(mcb/d)
3,119 2,917
(US$ bn)
2,600 216
2,223 2,083 192 186
158 149
828 104
83 80
299
XOM RDS BP COP TOT PBR CVX ENI STL
X OM P BR RDS BP CV X T OT E NI ST L C OP
Source: PFC Energy WRMS
(barrels per calendar day, considering company % shareholding and including JVs) Source: Bloomberg
7 Note: Peer companies selected above have a majority of capital traded in the public markets.
8. DOMESTIC E&P PROFILE
2008 Production 2008 Proven Reserves (SPE)
15% 9% 10%
14% 13%
23%
58% 58%
2,176 thousand boed 14.09 billion boe
Onshore Shallow water (0-300m) Deep water (300-1500m) Ultra-deep water (> 1500m)
8 Source: Petrobras
10. DOMESTIC PROVEN RESERVES PROFILE
Proven Reserves as of Dec/2008 (SPE)
(14.09 billion boe)
Oil + Condensate
< 22º API
22º 85%
(heavy)
22 – 31 º API 10% 5%
50% (intermediate)
29%
15% 6% Associated Gas
Non-Associated Gas
Gas > 31 º API (light)
45%
Undeveloped 55%
Proven Reserves
Developed
Proven Reserves
10 Source: Petrobras
11. ENHANCING RESERVES
Santos Pre-Salt announced recoverable volumes including the
transfer of rights, can more than double Brazilian reserves.
million boe ~ 30-35 bn boe
35,000
+5,000
30,000
Higher estimates
25,000 +5,400
20,000 Lower estimates
10,600
15,000
10,000
5,000
14,093
0
2008 Proven Santos and Campos Basins Transfer of Proven Reserves*
Reserves* Pre-Salt Rights with +
(Tupi, Iara, Guará and Whale’s Compensation Santos and Campos Basins
Park)** Pre-Salt
(Tupi, Iara, Guará and Whale’s Park)**
*SPE Criteria +
Transfer of Right
** include Petrobras and Partners
11
12. IMPRESSIVE RECORD OF
ACCELERATING DEVELOPMENT
2.000.000
1.800.00
16 anos
54 anos
1.600.00
Production (bpd)
22 anos
1.200.00
1.000.00
27 anos
12 anos
45 anos
800.00
400.00
0
1 3 5 7 9 11 13 15 17 19 21 23 25 27 29 31 33 35 37 39 41 43 45 47 49 51 53 55
Numbers of Years
Production since Discovery of giant fields in Campos
Discovery of Garoupa in Discovery of the Pre-Salt,
incorporation of Petrobras basin including Albacora/Marlim
the Campos basin (1974) since Parati (2006)
(1953) (80´s & 90’s)
12
13. INDUSTRY-LEADING PRODUCTION GROWTH
CAGR (2004-2008) - %
7,75
5,33
4,40 4,38
2,48
1,36
-1,02 -1,79 -2,57 -3,71 -3,78
ExxonMobil
Chevron
Repsol YPF
BP
PetroChina
Lukoil
Total
RD Shell
ConocoPhillips
Petrobras
ENI
Petrobras Oil and Gas Production (000 boe/d)
2,400
2,297 2,301
2,217
4.4% CAGR
2,020
2004 2005 2006 2007 2008
Source: Evaluate Energy (2004-2008 CAGR)
13
14. STRATEGIC VISION: TO BE ONE OF THE WORLD’S
FIVE LARGEST PUBLICLY TRADED OIL PRODUCERS
30,000 Production
Target: 2020
25,000
R es erves (m m boe)
Production
Target: 2013 XO M
20,000
BP
Production
15,000 Target: 2009
PBR
10,000 CVX R DS
TO T C OP
5,000
2,000 2,500 3,000 3,500 4,000 4,500 5,000 5,500 6,000
2007 (SEC) reserves and production
P roduc tion (m boe /d)
14
15. BRAZILIAN ECONOMY IS GROWING WITH
STABILITY AND FISCAL RESPONSIBILITY
GDP Growth (%) Trade Balance (US$ Billion)
250.0 Exports Imports Forecast
6 5.7 5.7 Forecast
5.1 198
5 4.7 200.0
173 170
4.0 161 155 155
GDP Growth (%)
4 150.0 138
3.2 130
119 121
3 97 91
100.0
73 74
2 63
1.2 48
50.0
1
0.2
0 0.0
2003 2004 2005 2006 2007 2008 2009 2010 2003 2004 2005 2006 2007 2008 2009 2010
International Reserves (US$ billion) Brazilian Debt (as % of GDP)
Nominal Fiscal Deficit/GDP (%)
2008 2009 20 60
53,5
Nominal Debt/GDP (%)
250,0
Net Debt/GDP (%)
Net Debt/GDP (%)
212
48,2 48,0 45,9 43,9 50
207 15 44,0
200,0 180
38,8 40
150,0 10 30
4,7 3,9
20
100,0 86 5 2,8 3,4 3,5
49 53 54
2,8 10
50,0 2,0
0 0
2003
2004
2005
2006
2007
2008
ago/09
0,0
dez
abr
mai
jul
abr
mai
jul
mar
ago
mar
jan
jun
jan
jun
out
set
nov
fev
fev
2003
2004
2005
2006
2007
15 Source: Brazilian Central Bank
16. INCREASING INVESTMENTS WITH CAREFULLY
CRAFTED SPENDING PROGRAM
Business Plan 2009-2013
PN 2009-13 | Brazil/International
2% 2% 2%
3% US$ 174.4 billion 9%
7% 5.6 3.0 E&P
16.2 US$ 174.4 billion
11.8 2.8
RTC
3.2 Brazil
G&E
International
Petrochemicals
158.2
43.4 104.6 (*) Distribution
25% 59%
Biofuels
91%
Corporate
(*) US$ 17.0 billion allocated to Exploration
Business Plan 2008-12
2% 1% 2%
4% US$ 112.4 billion
6% 4.3 2.6
• Petrobras strategy gives first priority to 6.7 1.5
E&P
RTC
meeting production targets 2.5
G&E
Petrochemicals
• E&P accounts for 76% of new project 26% 29.6 65.1
Distribution
59%
spending (US$ 28.9 bn for pre-salt) Biofuels
Corporate
16
17. PEERS CAPEX
Capex by segment
(3Q09 vs. 3Q08)
Source: Evaluate Energy Chemicals Others
17
18. PETROBRAS RESEARCH CENTER: TECHNOLOGICAL
INNOVATION FOR THE NEXT DECADES
Partnership with over 120 universities and research
centers in Brazil, and 70 Institutions abroad.
Technological Strategy
Expanding Limits
Investments in Technology
2009-2013
Medium Offshore
Pre-Salt Distillates Natural Gas
US$ 4.0 billion Ultra-deep
Maximization Transportation
Novas Advanced Water
25% fronteiras Recuperation
Exploratórias
Sustainability
1.0
1.9 47% Enhance Product Mix
5% 0.2
0.9
23%
E&P Downstream Biomass 2nd Generation CO2 Water
Refining Biofuels Energy
Management Management Efficiency
G&E Corp. (Cenpes)
18
20. CONSISTENTLY DELIVERING RESERVES
GROWTH
Maintained a ~120% reserve
Targeting a reserves to
replacement rate in 2008. Over the
production life of 15 years
past decade, reserve replacement
has principally been driven by
internal additions in Brazil
13.75 13.92 14.09
13.02 13.23 0,92
1,23 0,88
0,88
Production Production Production Production
(0.67 bn boe) (0.70 bn boe) (0.70 bn boe) (0.75 bn boe)
Reserves Reserves Reserves Reserves
Replacement 12,35 Replacement 12,52 Replacement 13,04 Replacement 13,17
Index Index Index Index
(131%) (174%) (124%) (123%)
2004 2005 2006 2007 2008
20 * According to SPE (Society of Petroleum Engineers) criteria
21. PURSUING NEW PROJECTS WHILE MAXIMIZING
PRODUCTION FROM EXISTING ASSETS
Petrobras Total Production (x 1000 boe/d) 5,729
223
7.5% p.y. 409
1.177
3,655
5.6% p.y. 8.8% p.y. 131
2,758 210
634
2,400 103
2,217 2,297 2,301
142
1,810 2,037 2,020 101 110 100
1,635 96 124 463
22 85 94 142 126
24 163 321
35 161 168 277 273 3.920
44 274
252 251 265
232 2.680
1.855 2.050*
1.684 1.778 1.792
1.500 1.540
1.493
1.335
2001 2002 2003 2004 2005 2006 2007 2008 2009 ..... 2013 ..... 2020
Oil production - Brazil Gas production - Brazil Oil production - International Gas production - International
* Consider +- 2,5%
21
22. ESTIMATED OIL PRODUCTION IN BRAZIL
Out of the 824 kb/d in The biggest The PN 2008-2012 Brazil
domestic production contribution in the oil target for 2015 was
growth through 2013, 566 domestic production 2,812 k b/d. The new
kb/d will come from fields growth of 1,240 kb/d target represents an
where we have already between 2013 and increase of 19% (+528
declared commerciality 2020 will come from kb/d)
pre salt production
Petrobras Total Production (000 b/d)
3,920
3,340
2,680
2,050
1,855
2008 2009 2013 2015 2020
Light Oil ≥ 31º API Medium Oil Heavy Oil ≤ 22º API
22
23. ROBUST PROJECT PIPELINE: 2010-2013
CANAPU
MANATI
expansion URUGUÁ JURUÁ
TAMBAÚ ARACANGA
LAGOSTA
3.32
MEXILHÃO 3.20 Oil and gas
CAMARUPIM
3.02
URUCU 2.79
million boe/d
2.68
2.51 2.58 Oil
2.43
P-62
2.25 RONCADOR
2.05 P55
RONCADOR
P-57
BALEIA AZUL
JUBARTE P-61
JABUTI PAPA-TERRA
TUPI P-56
MARLIM SUL P-63
EWT Tupi Pilot
PAPA-TERRA
P-51 CACHALOTE.
MARLIM SUL BALEIA FRANCA, GUARÁ 1
BALEIA ANÃ
FRADE
TUPI 1
PARQUE DAS Pilot Expansion
CONCHAS
2009 2010 2011 2012 2013
Pre-salt Heavy oil Natural Gas
23
24. RESERVES IN ULTRA-DEEP WATER CAN BE
DEVELOPED AT A RELATIVELY LOW COST
Expected Costs of Production
140
Deepwater and
Production costs (US$/bbl-2008)
120
Ultra-deep water
100
Oil Gas to Coal to
80 Shales liquids liquids
Arctic
CO₂ - EOR
60
EOR
Heavy oil
and
bitumen
40
Other
20 Produced
convention Petrobras expected
MENA al oil maximum break-even cost
0 1000 2000 3000 4000 5000 6000 7000 8000 9000 10000
Reserves (bn bbls)
24 Source: IEA – Outlook 2008
25. LIFTING COSTS STABLE, IN SPITE OF
HIGHER OIL PRICES
R$/barrel US$/barrel
114.78
68.28
54.40 54.91 58.79
41.62 44.40
41.48 38.86
36.79 34.24
22.39 16.33 21.28 24.78 30.27
18.11 19.50 22.86
20.06 14.69 13.84
17.61 19.09 17.91 17.58 16.84 9.87 6.87 10.78
10.21 8.24 7.82 8.72 9.02
3Q08 4Q08 1Q09 2Q09 3Q09 3Q08 4Q08 1Q09 2Q09 3Q09
Lifting Cost Gov. Take
Lifting Cost Gov. Take Brent
• Lower lifting costs without government take, in Reais, despite increase in international
oil prices
• In Dollars, the increase was due to FX rate appreciation
• Increase in the government take due to higher international oil prices and increase in
tax rates applied to certain fields, especially Marlim Sul e Marlim Leste
25
26. DISTRIBUTION OF UPSTREAM REVENUES
Distribution of the Realization Price of a Barrel of Domestically
Produced Oil
$85,00
$75,00 95,0%
$ per Barrel Realization Price
% Share of Realization Price
$65,00
75,0%
$55,00
$45,00
55,0%
$35,00
35,0%
$25,00
$15,00
15,0%
$5,00
2005 2006 2007 2008 1H09 2005 2006 2007 2008 1H09
$(5,00) -5,0%
Lifting Other COGS DD&A Income Tax Other
SG&A Net Income R&D Exploratory Costs Government Take
26
27. NEW PRODUCTION UNITS
Project Start up Type Oil and Gas Capacity Shipyard Leased
Uruguá-Tambaú 25,000 bpd
1Q/10 FPSO Modec
Cidade de Santos 10.0 MM m3/d
Mexilhão 2Q/10 Fix 15 MM m3/d Mauá Jurong
Cachalote/Baleia Franca 100,000 bpd
2Q/10 FPSO SBM
FPSO Capixaba 3.2 MM m3/d
Tupi Pilot 100,000 bpd
4Q/10 FPSO Cosco (China) Modec
Cidade de Angra dos Reis 5.0 MM m3/d
Marlim Sul Mod. 3 - P-56 (P- 100,000 bpd Brasfels-Keppel
2H/11 SS
51 Clone) 6.0 MM m3/d Angra
180,000 bpd
Jubarte Mod. 2 - P-57 2H/11 FPSO SBM Cingapura
2.0 MM m3/d
100,000 bpd
Papa Terra - P-61 2H/13 TLWP Bid in progress
1.0 MM m3/d
150,000 bpd
Papa Terra - P-63 2H/13 FPSO Bid in progress
1.0 MM m3/d
120,000 bpd
Guará Pilot 2H/13 FPSO Bid in progress
5.0 MM m3/d
Atlântico Sul
180,000 bpd
Roncador Mod 3 - P-55 2H/13 SS (Suape) and Rio
6.0 MM m3/d
Grande
27
28. NEW TECHNOLOGIES TO INCREASE
RECOVERY FACTOR
Vertical Annular Separation and
ESP in a skid on the sea-bed Pumping System
4D Seismic (Espadarte-Fase III)
(Marlim; Marlim Sul; (Congro; Malhado; Corvina) (Parque dos
Albacora) VASPS Temperos; )
Bonito
CAISSON
2011
2009 2010 2012
Oil Water
Subsea Christmas
Subsea
Tree.
Separation
“Piggy-back” (Marlim)
(Marimbá; Barracuda) TLWP
(Papa-terra)
SBMS - Subsea RWI – Raw
Multiphase Pumping Water Injection Multifractured Well
System
(Albacora) (Bonito)
(Marlim)
28
29. EXPLORING TO LEVERAGE EXCITING
FRONTIER PLAYS IN OUR OWN BACKYARD
Exploration
Capex
US$ mm
70%
2.750 Success Rate
2.500 60%
2.250
50%
2.000
1.750
40%
1.500
1.250 30%
1.000
20%
750
500
10%
250
0 0%
2002 2003 2004 2005 2006 2007 2008 2009-2013
29
30. MAIN DISCOVERIES IN THE POST-SALT REGION *
Date Field Participation Fluids Water
Depth (m)
Nov-2009 Rig Fence Light Oil 400
BR(100%)
Marimbá
Aug-2009 BM-C-36 BR (100%) Light Oil 976
Aruanã
May-2009 BM-S-48 BR(35%), Repsol(40%), N. Gas and 161
Panoramix Vale(12,5%),Voodside(12,5%) Condensate
Marimbá
BM-J-3 Aruanã
Nov-2008 BR (60%), STATOIL (40%) Oil 2,354 (BM-C-36)
Jequitinhonha
Sep-2008 BM-S-40/Sidon BR (100%) Light Oil 274
Jul-2008 Golfinho BR (100%) Light Oil 1,374
May-2008 BM-S-40/Tiro BR (100%) Light Oil 235
Dec-2007 BM-ES-5/ BR (65%), EL PASO (35%) N. Gas and 708
Camarupim Condensate
May-2007 BM-ES-5/ BR (65%), EL PASO (35%) N. Gas and 763
Camarupim Condensate
Mar-2007 BC-60/Caxaréu BR (100%) Light Oil 1,011
30 * 2007 to 2009
31. EXPLORATION PORTFOLIO AT DIFFERENT
STAGES OF DEVELOPMENT
Margem Equatorial Brazil
Ceara & Potiguar Exploration:
2009-13 US$
Solimões 13.8 bn
Potiguar Exploratory Area:
155.0 thousand
SEAL& REC & TUC
km²
Bahia Sul
265 exploratory
São Francisco blocks
Espírito
Santo 35 appraisal
plans
Campos
Petrobras Santos 313 production
Others concessions
Pelotas
31
32. INCREASE IN THE NUMBER OF FIELDS ANDS
BLOCKS HELD WITH PARTNERS
Petrobras’ current domestic production comes mainly from concessions
(97%) owned by the company alone
For the areas under development, the percentage of concession held
without partners falls to 62%
More than half (53%) of the blocks under exploration or appraisal are
joint ventures
Concessions Under Production Production Development Exploration + Evaluation
(247) Concessions (66) Concessions (54)
97% 53%
38%
62%
47%
3%
Petrobras (100%)
Petrobras in Partnerships 34 Oil and Gas Companies (2008)
32 SINN, July 2009
34. PRE-SALT JOINT VENTURES
• Total Area: 149,000 km2
• Area Under Concession: 41,772 km2 (28%)
• Area Not Under Concession: 107,228 km² (72%)
• Area With Petrobras Interest: 35,739 km2 (24%)
JUBARTE
ESS-103 CHL-4
BFR-1
Blocks Consortium
1-2
Bi boer
BAZ-1 BC-60 BR (100%)
Jubarte
Cachalote
Shore Distance = 60 km Balia Franca
Total Area = 3.000 km2 Baleia Azul
Baleia Anã
Blocks Consortium
BMS-8 BR (66%), SH (20%) e PTG (14%)
BMS-9 BR (45%), BG (30%) e RPS (25%)
BM-S-11
BM-
(Tupi) BMS-10 BR (65%), BG (25%) e PAX (10%)
BMS-11 BR (65%), BG (25%) e PTG (10%)
BMS-21 BR (80%), PTG (20%)
1.1-2 bi BMS-22 EXX (40%), HES (40%) e BR (20%)
Shore Distance = 300 km boer
BMS-24 BR (80%), PTG (20%)
Total Area = 15.000 km2
34
36. PRE-SALT ACTIVITIES ACCELERATING, REAFIRMING
POTENTIAL AND INCREASING UNDERSTANDING
Drilling of the 4th well of the
BM-S-10 BM-S-11 Evaluation Plan of Tupi was
BR 65% BR 65% concluded, confirming the
potential of the area
Iara
BM-S-8
Parati
BR 66% Iracema Excellent performance of
Tupi EWT, with production
Tupi NE of approximately 20
Tupi Júpiter
thousand bpd
Extensão - Tupi
Carioca Tupi P1 Formation Test in wells Iara,
Bem-te-vi
Guará
Iracema and Tupi Northeast
Iguaçu BM-S-24
Abaré BR 80% Drilling and completion of the
1st well in the Tupi pilot
Guarani
Azulão BM-S-9
Caramba
BR 45% Legend:
BM-S-21
BM-S-22 Drilled Wells
BR 80%
BR 20%
Formation Test
Next steps: new wells in the Tupi pilot; new exploratory wells in BMS-9, BMS-11
and BMS-10 Drilling and
Rigs: 3 new drilling rigs until 1H/2010 Completion
Ongoing biddings: (i) FPSO chartered for the Guará pilot; (ii) 8 hulls for the Pre-salt
project in Santos Basin
36
37. INVESTMENT PROGRAM FORECAST
Total Investments of US$ 104.6 billion in Investment (Program %)
E&P through 2013, of which US$ 92 billion
will be spent in Brazil Oil Transfer Exploratory Appraisal
4.7% 1.9%
Gas Transfer
5.2%
Production
12% 13% Infrastructure
0.5%
Production
17% Development
87.7%
58%
19%
Subsea
49%
32% Wells
Exploration Development
Units
Santos Pre-salt International
37
38. DEVELOPMENT STRATEGY (example: TUPI)
1st Oil – EWT 1st Oil – Tupi Significant
Tupi (Mar/09) Pilot (Dec/10)) production level
..... ..... t
2007 2009 2010 2012 2017
Information Acquisition Definitive Development
Phases
Phase 0 Phase 1A Phase 1B
EWT (Mar/2009), Tupi Implementation of “X” production units Implementation of
Focus
Pilot and appraisal wells (Replicated FPSOs) “Y” production units
• Area Delimitation
• Analyze water and gas/CO2 injection behavior
• Analyze reservoir flow
• Test adjustments on FPU related to CO2
• Fractured well
• Test improvements in well projects
performance
Objective • Apply previous dominated concepts and technologies with
• Complete sampled
necessary adjustments to reach significant production by 2017
core
• Aggregate innovative technical solutions to optimize project
• Material analysis vs.
performance
CO2
38
39. PRE-SALT ACCOMPLISHMENTS TIMELINE
2008 Phase 0 2013 Phase 1A 2017 Phase 1B 2020
…
Phase 1A - Projects
Phase 0:Information gathering
Phase 1a: 1st phase of definitive development, use of
Appraisal wells, Small scale consolidated or rapidly-consolidating technologies to
production (EWTs) achieve production targets, generate cash-flow to
support Phase 1b
First 2 FPSOs to be chartered (2013-2014)
• Oil Production: 120,000 bpd
Phase 1B - Projects • Gas Compression: 5 M m³/d
• 2nd phase of definitive development Additional 8 FPSOs (2015-2016)
• Construction of the hulls at the Rio Grande
• Significant production increase Shipyard
• All identical units, manufactured in series
• Innovation acceleration • Process plant under study:
• Massive use of new technologies specially − Oil Production: 150,000 bpd
tailored for Pre-Salt conditions − Gas Compression: 5.5 M m³/d
− Water-Alternating-Gas injection capability
39
40. MAJOR TECHNOLOGICAL DEVELOPMENTS
UNDER EVALUATION
PLANSAL - Pre-Salt Development Master Plan
Offshore
logistical hub
Water-alternating- Offshore
gas (HC or CO2) produced fluid
injection handling hubs
CO2 storage in
Extended-reach saline aquifers,
and deviated depleted fields, salt
wells (salt) caves
Pre-Salt
Flow Assurance
Definitive Deepwater
and formation
CALM buoy
damage control Development
Dry completion
systems (SPAR, Reservoir
TLP, FPDSO, …) Characterization
Offshore gas
Floating LNG storage in salt
caves
CO2 separation /
capture technology
40
41. ESPÍRITO SANTO PRE SALT
n to UTG Cacimbas Infrastructure in-place: diversified and flexible portfolio;
Sa
Linhares
Rio Doce Cangoá
MG Peroá P-34 at Jubarte field, first pre-salt production (Sep/08):
ito
UPGN Lagoa Parda
excellent results/light oil (30ºAPI);
p ír
24” – 66 km
Aracruz 25 MM m3/d
Es
Terminal Barra do Riacho
Camarupim
FPSO Seillean started in dec/08 as pilot system of
Canapu
Cachalote (CHT) field;
Golfinho
VITÓRIA
2 wells were reallocated from FPSO Capixaba to
Carapó
Vila Velha FPSO Cidade de Vitória;
UTG Sul Capixaba
Sul-Norte Capixaba
Gas pipeline
Developing new discoveries in the Ring Fence of
Guarapari Sul Capixaba
Gas pipeline 12 a 24” – 160 km
12” – 83 km 7 a 15 MM m3/d Golfinho using FPSO Cidade de Vitória;
Anchieta 4,5 MM m3/d
Presidente Marataizes
FPSO Capixaba (100 Mb/d) moved from Golfinho field
Kennedy
ARG
CHT Baleia Franca and is being adapted to produce in Cachalote
JUB OST
RJ Baleia Azul
NAU (CHT)/Baleia Franca (BFR) in 1H10;
ABA
CXR
PRB
Baleia Azul first definitive production unit by 4Q12;
Catuá
Natural gas production transported via pipeline.
Whales Park*
41 *Whales Park comprehends the fields: Jubarte, Cachalote, Baleia Franca, Baleia Azul and Baleia Anã
44. NEW REGULATORY MODEL
Production Transfer
Sharing of Rights with
Agreement compensation
Pre-salt
Petrobras 100% and
Petrobras Operator
Strategic
Other companies
Areas
Up to 5 billion boe
Trough Bidding
Process
Other Areas Current
Concession Model
There will be no regulatory changes in the areas under concession, including
the pre-salt area already granted
44
45. PRODUCTION SHARING AGREEMENTS
Production sharing agreements
Petrobras will operate all blocks under this regime, with a minimum stake of 30%
Consortium between Petrobras, Petro-sal and the winning bidder will be managed by the
Operational Committee
Petrobras will be able to participate in the bidding process to increase its stake
The winning bidder will be the
Companies company that offers the highest
percentage of “profit oil” for the
Profit Brazilian Government
Oil Petrobras will have to follow
Government the same percentage offered
by the winning bidder
The Brazilian Government will not
assume the risks of the activities,
except when it decides to invest
Cost directly
Oil Prior to contracting, the Government
may evaluate the potential of the
areas and may contract Petrobras
directly
Graphs are showing only hypothetical values
45
46. E&P TRANSFER OF RIGHTS
WITH COMPENSATION
Government may transfer to Petrobras, for compensation, without bidding, the
rights to explore and produce oil in the pre-salt areas not under concession.
These areas may or may not be contiguous
Transfer of rights limited to a maximum produced of 5 billion boe. Petrobras
will be the owner of produced volumes
Oil values shall be determined by technical reports prepared by qualified
third parties contracted by the government (ANP) and Petrobras, taking
into account best industry practices
The transaction includes a clause of reappraisal of reserves value
If the value of appraisal rises, Petrobras will pay the difference to the
Government. If price falls, the contrary will happen
Royalties will be paid by Petrobras and distributed according to the Law nº
9.478/97. No special participation payment is expected
46
47. TRANSFER OF RIGHTS APPRAISAL
Appraisal need to consider
Production Capex
Curve
Production
Oil Volume Costs
Oil reservoir
Future Oil Discount
prices Rate
Reserves Fiscal
development/ Environment
Knowledge (government
participation)
47
48. PETROBRAS’ CAPITALIZATION
The value of capitalization could be:
• Minimum: the same value of the transfer of rights with compensation
• Maximum: up to 3 times this value
Petrobras will receive
cash from minority
Petrobras’ increase shareholders
in capital
Petrobras will pay the
(to be approved by transfer of rights with
Appraisal of the ESM) compensation to the
reserves in R$ federal govt
• Brazilian Government could pay the capital contribution to Petrobras with
public debt issuances, priced at market value
• Petrobras may pay the Brazilian Government the transfer of rights with
compensation, using the same securities arising from the capitalization
48 Graphs are showing only hypothetical values
50. USING CONTRACTS AND LEASES TO SECURE
NEEDED DRILLING ASSETS
Water Depth 2008 2009 2010 2011 2012 2013 - 2018
0-999m 11 1
1000-
18 2
1999m
≥ 2000m 5 5 9 6 + 28 to be leased
Total per 34 7 9* 7 9 28**
year
Rigs Available in
7 17 6
the market > 2400m
30 RIGS CONTRACTED PLUS 28 TO BE LEASED UP TO 2018, MAKING A TOTAL OF 58
DRILLING RIGS:
- 23 being delivered between 2009 and 2011
- 9 will be chartered via international bidding, being delivered in 2012 – Meeting Petrobras’
short-term needs, while the national industry prepares itself for additional orders.
- 28 will be built in Brazil, being delivered between 2013 and 2018
* 2 rigs will be dismissed in 2013
50 **30 rigs contracted plus 28 to be leased up to 2018, making a total of 58 new drilling rigs
51. COMPETITIVE NATIONAL SUPPLY OF GOODS
AND SERVICES
Adequacy of The National Supply Industrial Complex
GOOD AND SERVICES SUPPLY PATH
5. Incentive for international
imports companies to establish operations in
Brazill
4. Incentive for association
between national and
Increase in international companies
National Supply
Capacity of G&S 3. Incentive for new national
imports entrants
2. Develop competition among
medium competitive sectors
1. Increase productivity capacity of
National
highly competitive sectors
Industry
Current Demand Future Demand
Source: Promimp, 2008
51
52. NEW EQUIPMENT TO BE CONTRACTED
Items Un. TOTAL Items Un. TOTAL
Wet Christmas Tree un 500 Pumps un 8.000
Well Head un 500 Compressors un 700
Flexible Lines km 4.000 Winch un 450
Manifolds un 30 Crane un 200
Producing pipes t 42.000 Engines un 1.000
Umbilical km 2.200 Turbines un 350
Dry Christmas Tree un 1.700 Structure Steal (Hull) t 240.000
Onshore well head un 1.700 Structure Steal (Platforms Hull) t 700.000
Itens Un. TOTAL Itens Un. TOTAL
Reactors un 280 Power Generators un 500
Oil and water splitter un 50 Filters un 300
Storage Tankers un 1.800 Flares un 30
Turrets un 550
52
53. LONG TERM HR CHALLENGES
2007 2008 2009 2010 2011 2012 2013 2014 2015 2016
120.000
Projects on Business
Plan 2008 – 2012
28 Offshore Drilling
100.000
Rigs
146 Supply Vessels
New Production
Platforms
80.000 Promef II*
19 Chartered Ships
Premium Refinery II
60.000
Premium Refinery I
40.000
20.000
243.000
43.000 Business Plan
2009-2013
Professionals
0 Qualified
Shortage of trained human resources and demand for local-content increase
Competition with other projects for people
53
55. DOMINANT POSITION IN A LARGE AND
GROWING EMERGING MARKET
2008 Total Oil Consumption by Country (mmbo/d)
19.4
10
9
8.0
8
7
6
Brazil is world’s seventh-
5
4.8
largest oil consumer.
4
2.9 2.8
3 2.5 2.4 2.3 2.3 2.2 2.0 1.9 1.7 1.7 1.7
2
1
-
S. Korea
China
India
Russia
Canada
Italy
US
Germany
Japan
Mexico
Iran
Saudi
Brazil
France
UK
Total Oil Consumption mb/d (index)
125
Brazil US OECD World
120
Brazil oil consumption 115
growing at 1.99% p.a; 110
OECD oil consumption 105
growing at 0.17% p.a.
100
1997
1998
1999
2000
2001
2002
2003
2004
2005
2006
2007
2008
55 Source: BP Statistical Review 2009, PFC Energy
56. VERTICALLY INTEGRATED SYSTEM TO
CAPTURE SYNERGIES WITHIN THE VALUE CHAIN
Upstream Operations Downstream Operations
Existing Pipelines
Refineries
Petrobras Marine Terminal
Other Companies In Land Terminal
Access to raw material • Logistic and infrastructure developed
Access to oil products market • Near the biggest market in Brazil
56
57. ADDRESSING THE NEED TO INCREASE
THROUGHPUT CAPACITY AND COMPLEXITY
Average Refinery Throughput Capacity (000 b/d)
240
220
200
180
160
140
120
100
1 2 3 4 5 6 7 8 9 10
PFC Energy Complexity Index
57 Source: PFC Energy