Toothpaste consumeption matrix across India
•
1 like•461 views

This is a simple document which establishes some of the seminal work which a marketer can do to establish category growth and pointers across the various states of India ..

Recommended
More Related Content
Viewers also liked
Viewers also liked (12)
More from PESHWA ACHARYA
More from PESHWA ACHARYA (20)
Recently uploaded
Recently uploaded (20)
Toothpaste consumeption matrix across India
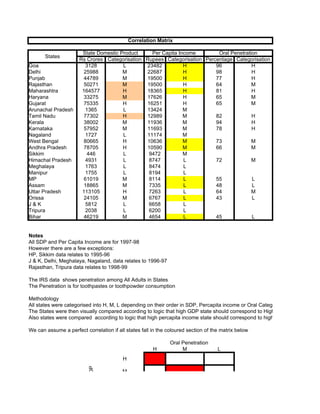
- 1. Correlation Matrix State Domestic Product Per Capita Income Oral Penetration States Rs Crores Categorisation Rupees Categorisation Percentage Categorisation Goa 3128 L 23482 H 96 H Delhi 25988 M 22687 H 98 H Punjab 44789 M 19500 H 77 H Rajasthan 50271 M 19500 H 64 M Maharashtra 164577 H 18365 H 81 H Haryana 33275 M 17626 H 65 M Gujarat 75335 H 16251 H 65 M Arunachal Pradesh 1365 L 13424 M Tamil Nadu 77302 H 12989 M 82 H Kerala 38002 M 11936 M 94 H Karnataka 57952 M 11693 M 78 H Nagaland 1727 L 11174 M West Bengal 80665 H 10636 M 73 M Andhra Pradesh 78705 H 10590 M 66 M Sikkim 446 L 9472 M Himachal Pradesh 4931 L 8747 L 72 M Meghalaya 1763 L 8474 L Manipur 1755 L 8194 L MP 61019 M 8114 L 55 L Assam 18865 M 7335 L 48 L Uttar Pradesh 113105 H 7263 L 64 M Orissa 24105 M 6767 L 43 L J&K 5812 L 6658 L Tripura 2038 L 6200 L Bihar 46219 M 4654 L 45 L Notes All SDP and Per Capita Income are for 1997-98 However there are a few exceptions: HP, Sikkim data relates to 1995-96 J & K, Delhi, Meghalaya, Nagaland, data relates to 1996-97 Rajasthan, Tripura data relates to 1998-99 The IRS data shows penetration among All Adults in States The Penetration is for toothpastes or toothpowder consumption Methodology All states were categorised into H, M, L depending on their order in SDP, Percapita income or Oral Category Penetration as al The States were then visually compared according to logic that high GDP state should correspond to High Oral Penetration Also states were compared according to logic that high percapita income state should correspond to high oral penetration We can assume a perfect correlation if all states fall in the coloured section of the matrix below Oral Penetration H M L H SDP M
- 2. SDP M L Findings Though none GDP or Percapita income correlates perfectly with Oral Penetration. Some findings are unique 1) GDP turns to be a poor correlation with oral category penetration. Only 4 out of 18 states whose IRS data are available fall i 2) Percapita income though not perfect correlates much better with oral category penetration. 10 out of 18 data points fall in th This clearly brings out the fact that percapita income is just one of the factors to explain oral category penetration. We must continue our efforts to find other factors
- 3. r Oral Category Penetration as also clearly visible kinks in data points spond to High Oral Penetration spond to high oral penetration
- 4. ings are unique whose IRS data are available fall in the conventional boxes . 10 out of 18 data points fall in the conventional zones category penetration.