ADMINISTRACIÓN TRIBUTARIA (DEBERES Y OBLIGACIONES, NORMAS Y PROCEDIMIENTOS
Poster3
1. NEW AND INNOVATIVE MEASURING METHOD COMBINING FTIR-ATR SPECTROSCOPY AND
STABLE ISOTOPES TO INVESTIGATE THE KINETICS OF NITROGEN TRANSFORMATIONS IN SOILS
Oz Kira, Avi Shaviv and Raphael Linker
Faculty of Civil and Environmental Engineering, Technion, Haifa, Israel
1 Introduction 2 Gross reaction rates
Immobilization
3 Measuring method : FTIR-ATR
Investigation of nitrogen (N) transformations in The technique commonly used for measuring the various N-species and their
Mineralization NH3 volatilization
the soil is required to improve the quantification NH4 Plant uptake
+ isotopic forms, isotope ratio mass spectrometer – IRMS, is expensive and the
and understanding of the mechanisms through Denitrification sample preparation is both tedious and destructive and thus does not allow
Nitrification Leaching
which polluting N-species are discharged to the NO3- Immobilization online and continuous measurements. Using FTIR-ATR (Fourier Transform
environment. Methods using stable N-isotopes Plant uptake Infra Red- Attenuated Total Reflectance) device, as an alternative for the
were developed in order to estimate gross Fig 2: “Sink and Source” reaction regarding the ammonium and nitrate IRMS, allows measuring isotopic N-species concentrations directly in soil
pool in the soil (master 2003 with alterations).
mineralization and nitrification rates. Determining the reaction rates of the different N pastes.
NH3
transformations, which occurs concomitantly,
Organic matter crop
residues & native soil OM
Fertilizer provides deeper insight on their mechanisms. Since
Volatilization
N-species like nitrate or ammonium are involved in
several "source-sink" reactions, monitoring the
N2 Immobilization
Biomass NH4+
concentration change of each one of them allows
the calculation of "net" rate only. “Real rate" of a
specific reaction is commonly denoted as "gross
Fixation
Nitrification
NO2- rate". For example: Fig 3: An ATR crystal (Perkin-Elmer).
“Gross mineralization rate” accounts for the
Clay minerals
change in ammonium (formation) pool size caused Fig 4: Band shift of both 15NO3- and 15NH4+ signals from 14NO3- and
14NH + (respectively) as viewed using the FTIR-ATR.
N2O NO3- purely by mineralization as if all other consuming 4
processes were not present. Both nitrate and ammonium have a band shift between the labeled and
Leaching
“Net mineralization rate" accounts for all the unlabeled species, allowing to differentiate between their signals with the
changes (consumption and formation) caused by use of chemometric tools such as partial least squares (PLS) and neural
Fig 1: N transformations in the soil (Stevens).
immobilization, nitrification, and plant uptake. network (NN).
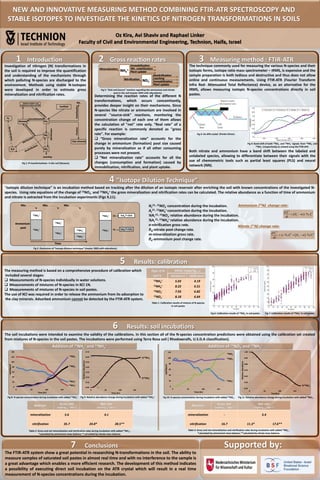
4 ”Isotope Dilution Technique”
"Isotopic dilution technique" is an incubation method based on tracking after the dilution of an isotopic reservoir after enriching the soil with known concentrations of the investigated N-
species. Using rate equations of the change of 15NO3- and 15NH4+ the gross mineralization and nitrification rates can be calculated. The relative abundance as a function of time of ammonium
and nitrate is extracted from the incubation experiments (Figs 9,11).
Min. Min. Min. Nt15- 15NO3- concentration during the incubation. Ammonium (15N) change rate-
At15- 15NH4+ concentration during the incubation. dAt15
14NH + 14NH + 25 %A014=25% %Nt 15- 15NO - relative abundance during the incubation. A m % At15
4 4 3 dt
14NH +
%At15- 15NH4+ relative abundance during the incubation.
Ammonium 4
n-nitrification gross rate. Nitrate (15N) change rate-
pool 15NH +
4
14NH +
4
15NH +
4
75 %A015=75% θN-nitrate pool change rate.
dN t15
n % At15 N n % N t15
15NH +
4
15NH +
m-mineralization gross rate.
4 dt
θA-ammonium pool change rate.
Time
Fig 5: Illustration of “Isotope dilution technique” (master 2003 with alterations).
5 Results: calibration
The measuring method is based on a comprehensive procedure of calibration which Type of N RMSE (mgN/kgsoil)
included several stages: specie Validation Calibration
Measurements of N-species individually in water solutions. 14NH +
4 5.03 4.19
Measurements of mixtures of N-species in KCl 1N. 15NH + 8.22 6.51
4
Measurements of mixtures of N-species in soil pastes. 14NO - 7.93 6.82
3
The use of KCl was required in order to release the ammonium from its adsorption to 15NO -
3 8.18 6.64
the clay minerals. Adsorbed ammonium cannot be detected by the FTIR-ATR system.
Table 1: Calibration results of mixture of N-species
in soil pastes
Fig 6: Calibration results of 15NO3- in soil pastes Fig 7: Calibration results of 15NH4+ in soil pastes
6 Results: soil incubations
The soil incubations were intended to examine the validity of the calibrations. In this section all of the N-species concentration predictions were obtained using the calibration set created
from mixtures of N-species in the soil pastes. The incubations were performed using Terra Rosa soil ( Rhodoxeralfs, U.S.D.A classification).
Addition of 15NH4+ and 14NH4+ Addition of 15NO3- and 14NH4+
140 0.70 120 1.00
14NO -
3
15NO -
120 3 0.60 %15NO3- 100 15NO - 0.90
3
Relative abundance
100
Relative abundance
0.50
80 0.80
mgN/kgsoil
mgN/kgsoil
14NO -
80 3 0.40
60 0.70
60 0.30
40
40 0.60
0.20 %15NH4+
14NH + 20 14NH +
20 4 0.10 4 0.50
15NH +
4 0 %15NO3-
0 0.00
0 50 100 150 0.40
0 50 100 150 0 50 100 150 0 50 100 150
Time (hr) Time (hr) Time (hr)
Time(hr)
Fig 8: N species concentration during incubation with added 15NH4+. Fig 9: Relative abundance change during incubation with added 15NH4+. Fig 10: N species concentration during incubation with added 15NO3-. Fig 11: Relative abundance change during incubation with added 15NO3-.
Reaction Gross rate Net rate Reaction Gross rate Net rate
(mgN.kgsoil-1.day-1) (mgN.kgsoil-1.day-1) (mgN.kgsoil-1.day-1) (mgN.kgsoil-1.day-1)
mineralization 5.6 4.1 mineralization - 5.4
nitrification 35.7 24.8* 28.5** nitrification 16.7 11.3* 17.6**
Table 2: Gross and net mineralization and nitrification rates during incubation with added 15NH4+. Table 3: Gross and net mineralization and nitrification rates during incubation with added 15NO3-.
*calculated by ammonium mass balance.**calculated by nitrate mass balance. *calculated by ammonium mass balance.**calculated by nitrate mass balance.
7 Conclusions Supported by:
The FTIR-ATR system show a great potential in researching N-transformations in the soil. The ability to
.
measure samples of saturated soil pastes in almost real time and with no interference to the sample is
a great advantage which enables a more efficient research. The development of this method indicates
a possibility of executing direct soil incubation on the ATR crystal which will result in a real time
measurement of N-species concentrations during the incubation.