Strategic Capability and Performance of NGOs in Nairobi, Kenya
Analysis of Real Income and Household Consumption in Kenya
1. ANALYSIS OF REAL INCOME ON HOUSEHOLD CONSUMPTION: CASE STUDY
OF KENYA
BY
ORINA RICHARD ONDIGO
K14/5668/2011
A RESEARCH PAPER SUBMITTED TO THE SCHOOL OF ECONOMICS IN
PARTIAL FULLFILMENT OF THE AWARD OF THE UNDERGRATUATE
BACHELORS DEGREE IN ECONOMICS IN KENYATTA UNIVERSITY
SUPERVISOR: MR.MWAURA
30TH MARCH ,2015
2. i
DECLARATION
I the undersigned do declare that this is my own work and has never been presented for a degree
award in any university .All information from other sources are dully cited and acknowledged .I
accept to take full responsibility of errors of omission ,commission and principle should they be
found therein.
Signature………………………………………..Date………………………………..
ORINA RICHARD ONDIGO BA.ECON
K14/5668/2011
I confirm that the work reported in this thesis was carried out by the student under my
supervision.
Signature………………………………………..Date………………………………..
Dr…………………………………………………………………………………………………
Department of Applied Economics
School of Economics
3. ii
DEDICATION
I dedicate this work of my hands to my dear mum Monicah ,my sisters and brothers especially
my immediate brother Evans ,uncle Henry, aunt Naomi for their sacrifice and commitment to
ensure that the research was done authentically and professionally without forgetting my
supervisor Dr. Mwiraria. You are highly appreciated.
4. iii
ACKNOWLEDGEMENT
My warmest gratitude goes to the almighty God for His knowledge and wisdom He bestowed in
me and guidance. I wish also to express my profound thanks to my supervisor Dr .Mwiraria all
the staff of the school of Economics. I profoundly appreciate Dr. Njaramba for her immense
support and advice. My sincere gratitude also goes to my mum Monicah for her input and critical
review of my work made this write up a success. My thanks also goes to my brother Evans for
editing this work and making sure it’s presentable. Finally special thanks to my family, my
relatives and friends for their support and encouragement during this write up. May God bless
you all.
5. iv
Table of Contents
DECLARATION ..........................................................................................................................i
DEDICATION .............................................................................................................................ii
ACKNOWLEDGEMENT ..........................................................................................................iii
TABLE OF CONTENTS...........................................................Error! Bookmark not defined.
LIST OF FIGURES.....................................................................................................................vi
LIST OF TABLES .....................................................................................................................vii
Table 3.1 Model specification table ...........................................................................................vii
OPERATIONAL DEFINATION OF TERMS ......................................................................... viii
ABSTRACT.................................................................................................................................x
CHAPTER ONE ......................................................................................................................... 1
1.0 INTRODUCTION................................................................................................................. 1
1.1BACKGROUND OF THE STUDY ...................................................................................... 1
1.2 STATEMENT OF THE PROBLEM .................................................................................... 1
1.3 RESEARCH QUESTIONS................................................................................................... 2
1.4 RESEARCH OBJECTIVES ................................................................................................. 2
I) MAIN OBJECTIVE ................................................................................................................ 2
i)SPECIFIC OBJECTIVE........................................................................................................... 2
1.5 SIGNIFICANCE OF THE STUDY...................................................................................... 2
1.6 SCOPE AND LIMITATIONS OF THE STUDY................................................................. 3
2.0 LITERATURE REVIEW................................................................................................... 4
2.1 INTRODUCTION................................................................................................................. 4
2.2 THEORETICAL LITERATURE.......................................................................................... 4
ASSUMPTIONS OF THE KEYNESIAN THEORY ................................................................. 4
2.3 EMPIRICAL LITERATURE................................................................................................ 5
CHAPTER THREE: RESEARCH METHODOLOGY.............................................................. 8
3.1 INTRODUCTION................................................................................................................. 8
3.1 RESEARCH DESIGN ......................................................................................................... 8
3.2 THEORETICAL FRAMEWORK ........................................................................................ 8
6. v
3.4 WORKING HYPOTHESIS .................................................................................................. 9
3.5 MODEL SPECIFICATION .................................................................................................. 9
3.6 NATURE AND TYPE OF DATA...................................................................................... 10
3.7 QUANTITATIVE RESEARCH ........................................................................................ 10
3.8QUALITATIVE RESEARCH ............................................................................................. 11
3.9 DATA COLLECTION PROCESS ..................................................................................... 11
3.10 DATA PROCESSING AND ANALYSING .................................................................... 11
3.11 DATA ANALYSIS .......................................................................................................... 12
3.7 ETHICAL CONSIDERATIONS ........................................................................................ 13
4.0 CHAPTER FOUR: RESEARCH FINDINGS AND ANALYSIS ...................................... 14
4.1 INTRODUCTION............................................................................................................... 14
4.2RESEARCH FINDINGS ................................................................................................... 19
4.3 CORRELATION ANALYSIS .......................................................................................... 20
4.4 REGRESSION ANALYSIS ............................................................................................... 21
4.5CONCLUSION .................................................................................................................... 22
CHAPTER FIVER: RESEARCH SUMMARY, CONLUSIONS AND
RECOMMENDATIONS.......................................................................................................... 23
5.1 INTRODUCTION............................................................................................................... 23
5.2 SUMMARY FINDINGS..................................................................................................... 23
5.3 CONCLUSIONS................................................................................................................. 24
5.4 RECOMMENDATIONS.................................................................................................... 24
5.5 SUGGESTIONS FOR THE FUTURE ............................................................................... 25
REFERENCES.......................................................................................................................... 26
7. vi
LIST OF FIGURES
Figure 4.11 Graph of income in agricultural industry (rural areas)
Figure 4.22 Graph of income in urban areas( Nairobi, Kisumu,Mombasa)
Figure 4.33 Graph of consumption in Kenya.
8. vii
LIST OF TABLES
Table 3.1 Model specification table
Table4.1 Monthly Basic minimum wages for agricultural industry (rural areas)
Table 4.2 Monthly basic minimum wage for urban areas ( Nairobi,Kisumu ,Mombasa)
Table 4.3 Kenya household consumption in Kshs.
Table 4.4 Spearman’s Rank matrix
Table 4.5 Analysis of Variance.
9. viii
OPERATIONAL DEFINITION OF TERMS
Regression …This is the study of cause-and –effect between two or more variables
Correlation …This is the study of association between two variables
11. x
ABSTRACT
The relationship between income and consumption has been a point of discussion for almost a
century now since the times of John Maynard Keynes, Milton Friedman , Richard Brumberg,
among other economists. The study of income on consumption behavior , tried to analyze the the
impact of a unit change in income on consumption (increase or decrease in income) under the
research objective: To find the cause and effect of income on household consumption. The
research looked at consumption that included all goods and services acquired or purchased by the
households but excluded those used for business purposes or accumulation of wealth but
included windfalls.
The study used the Keynesian theory of consumption as the focal point of reference and
inference. The Keynesian regression equation was that ,C=a+c Yd ,whereby a=autonomous
consumption(windfall),c marginal propensity to consume and Yd is real income .Valuable
empirical literature existed that studies the relationship between the two valuables at a cross-
country level. However, not much literatures existed on a country specific level. The main
objective of the study therefore was to fill the gap in a country specific level by exploring the
relation between a changes in income on household consumption at the Kenyan level.The study
tried to find answers to these questions i)What is the cause-and –effect between income and
consumption?ii) Is there any correlation between income and household consumption?iii) What
are the implications of these changes of income on household consumption? Under the umbrella
objective of finding the cause and effect between income and consumption.
The study used secondary data from varied government (Ministry of Labor) sources and non-
governmental organizations (World Bank) to analyze the causality between the variables of
consumption and income by applying regression and correlation analysis of the data collected.
The results showed a weak positive of 0.3 correlation between the variables; that’s a unit
increase in income led to a corresponding but not equal increase in consumption. Reasons found
were that they tried to divert their consumption to other areas such as tuition fee, savings or
reduce consumption due to the cost of living especially in urban areas and finally they grew their
own food thus lowering the purchase of goods and opting for self sufficiency. The research
further found out that in cases where consumption declined households income increased
constantly. The study suggested that the government to cushion consumers so as enable them
avoid decline in consumption as it was witnessed in 1997-1998 among others.
12. 1
CHAPTER ONE
1.0 INTRODUCTION
1.1BACKGROUND OF THE STUDY
The research study found out that household consumption is a major component of income.
Various hypothesis derived by renowned economists had indicated that income and
household are strong positively correlated .However, as it was found in the study income and
consumption even though they positively correlated their correlation is weak.
Browning and collado detected that there is a change in consumption but not a sensitive one
when there’s a small change in income and where due to rationality. Indeed as the research
found out that income increase was relatively small to influence changes in consumption a
function that formed the background of my study.
1.2 STATEMENT OF THE PROBLEM
Consumption has been a center of focus for over a century now since the times of John
Keynes .The significant place it holds reflects the consumer behavior to an income change in
real income. According to Shea(1995),noted that different consumption models imply that
different responses of consumption to predicted income increase and declines. This was well
shown as consumers increased consumption as income rose but later declined and various
reasons were found out between the variables.
Evidently, there were some correlation between income and consumption. Therefore the
purpose of the study was to analyze the impact of a change in income on household
consumption and the extent of this impact on a country specific level.
13. 2
Various studies have been done relating to the field of study. :(Browning and
Collado2000,Garcial et al1997,Shea1995, Jappeli and Pistferi2000 and Souleles 2000).None
of these studies were on a country specific level, hence the research sought to fill the gap.
1.3 RESEARCH QUESTIONS
i)What is the cause-and –effect between income and consumption?
ii) Is there any correlation between income and household consumption?
iii) What are the implications of these changes of income on household consumption?
1.4 RESEARCH OBJECTIVES
I) MAIN OBJECTIVE
To find out the cause and effect between income and household consumption
i)SPECIFIC OBJECTIVE
To find out the correlation between income and household consumption and analyze it.
To find out how a change in income influences household consumption and its applicability.
1.5 SIGNIFICANCE OF THE STUDY
The study basically sought to analyze the impact of a change in income on household
consumption. To the greatest of my knowledge this study helped to derive conclusions and
recommendations both to the households and government on how to come-up with policies
aimed at encourage household (demand) to promote the economy (part on government) or to
reduce consumption and encourage savings for investment to cater for future joblessness or
retirements(part of households).
The research based its study on the Keynesian theory of consumption (1936) in the Kenyan
context.
14. 3
The trigger of the study targeted majorly Kenyan households who did small income jobs and
did their purchases in either shopping areas or grew their own food. Therefore it split the
targeted population rural (agricultural industry) and urban areas (Nairobi, Kisumu and
Mombasa)
1.6 SCOPE AND LIMITATIONS OF THE STUDY
The scope of this study was to stimulate the hidden truth and explore open secret behind
income changes on household consumption in Kenya. So, it was my obvious aim to bring out
the black and white analysis of households consumption in relation to an income change. On
the other hand, everything has its own pros and cons, thus this research study cannot be
exception to this limitation. The limitation that this study consist of;
i) Quality of research
The originator of the primary research are largely self-governed and controlled by their own
opinions .Therefore, the study had to scrutinize closely since the data validity may be
questionable.
ii) Incomplete information
In many cases information was not complete hence, the researcher had to carry out some
estimations and averaging an issue that was of concern in the study especially income on
urban households in 1997 and 2001
iii) Not timely
Extensive scrutiny was carried out to ensure data used was relevant to the current situation so
as to avoid use of invalid data, a problem mostly associated with secondary data.
15. 4
2.0 LITERATURE REVIEW
2.1 INTRODUCTION
This section analyzed the various theoretical studies that have been carried out by various
researchers .They formed a major point of reference during the study.
2.2 THEORETICAL LITERATURE
The theory that supported this research study was the Keynesian theory of consumption. This
theory was developed by John Keynes in 1936.It focused on income and how it affected the
household’s consumption behaviors. The implication of this is that peoples’ consumption
depends on their exogenously given level of real income. The Keynesian Theory is a neo-
classical theory which looks at income from various points of view. A key implication of this
consumption function fueled the study.
ASSUMPTIONS OF THE KEYNESIAN THEORY
The research used the macroeconomic study of Keynesian theory of consumption function on
income, which relied on three key basic assumptions
i) Rigid prices: Keynesian theory assumes that prices are inflexible and do not quickly
adjust to equilibrium.
ii) Keynesian also assumed that consumption expenditures depend on actual income
received by household in each sector. If the household sector had more income
because the economy is expanding then the increase consumption expenditure.
The Keynesian Theory formed the focus of my study .However, it had few weaknesses as
discussed below
i) The Keynesian consumption function only bases consumption on current income and
ignores potential future income
16. 5
ii) As it was established the Keynesian model in order to be valid, the two basic
determinant of income namely, the consumption function and the investment must
remain constant .At the very least it must be possible for these two variables to
remain constant, if they are not generally the Keynesian model is to remain constant
for the required length of time .
iii) It’s an important fact usually overlooked, that the Keynesian assumption of a rigid
consumption function assumes a given distribution of income .Therefore, the change
on the distribution of income will cause change of unknown direction and magnitude
in the consumption function .Furthermore, the undoubted emergence of capital gains
will change the consumption function.
2.3 EMPIRICAL LITERATURE
Income is recognized as a major contributor to changes in consumption. The changes may show
some episodes of decline and increase depending on change in income. As it was established the
change in household consumption also dependent on individual’s sensitivity to income change.
Garcial et.al (1997) used a statistical approach to distinguish between positive and negative
expected income growth. Found out that in some instances consumers (households) are more
sensitive to income growth based on past information. Shea (1995), noted that different
consumption to predicted income increase and declines. Under myopia, consumption tracts
income and consumption should respond equally to predictable income increases and declines.
According to Jappeli and Pistaferri (2000), used the subjective and quantitative income
expectations available for a sample of Italian households as an instrument for income growth and
found enough evidence between income increase and decline on consumption.
17. 6
Episode of income increase
The research established that income increased among the households at one point, which
resulted from employee pay rise, increase in windfalls from government or friends or taking a
loan from bank or Chama’s. According to Browning and Collado(2001),they detected that there
is a change in consumption but not a sensitive one when there’s a small change in income where
due to consumer rationality. Consumers tend to smooth consumption and follow the theory when
expected income changes are large but are less sensitive when the changes are small.
Episodes of income decline
The research study looked at the existing literatures on the cases of income decline and its impact
on consumption. The most predictable decline in one’s income and subsequent consumption
occurs at retirement or retrenchment. According to Banks ,James and Blundell (1998), who
used cross-sectional data on the England families and found out that consumption declined at
one’s retirement .Barnherein et al (2001) repeated the test for the United States using the PSID
and also found out evidence of a substantial consumption drop at retirement.
There are other factors that causes a decline in consumption; they include retrenchments,
diversion of income to education, health, insurance and leisure. Indeed according to
Souleles(2000)studied the consumption effect of expected disposable income declines that were
induced by paying college fees.
The various studies that have been carried out on income changes on consumption helped to find
the knowledge gap that most Kenyans in tend to either adjust their consumption upwards or
downwards depending on the prevailing economic conditions. However, some ought to remain in
18. 7
their current state despite income increase so as to divert extra income into education, health,
insurance, savings etc., while others adjust their consumption in relation to a change ins income
19. 8
CHAPTER THREE: RESEARCH METHODOLOGY
3.1 INTRODUCTION
The study explored the problem in a positive view, using descriptive research strategy because it
aimed to know more about the phenomenon that income has impact on household consumption.
The study looked at the problem by utilizing data from various secondary sources that’s from the
Ministry of Labor and the World Bank. As well as explored different literatures related to the
study.
3.1 RESEARCH DESIGN
It’s the blue print of gathering and analyzing data. It was a work plan owing to the objective of
the research study. The study used descriptive research design because the characteristics of the
study required to study questions like how a unit change in one variable influences the other
variable. In descriptive I chose time series data because of time limitation
3.2 THEORETICAL FRAMEWORK
The theory that supported the study was the Keynesian theory of consumption which was
developed by John Keynes in 1936.The theory mainly focused on consumption and how it
associates with income as stated below
C=α+β Y
Where; c is consumption
α is autonomous consumption which is independent on income
β is marginal propensity to consume
Y is real income
20. 9
On this regards the relationship between independent variable and dependent variable was
identified as follows
Independent variables Dependent variables
Autonomous income denoted as α Household consumption denoted as c
Marginal propensity to consumer denoted asβ
Real income y
3.4 WORKING HYPOTHESIS
Absolute income hypothesis based its argument that consumption is a function of absolute
consumption depends on pure income.
Ho:α=0 Alpha is not statistically significant
Ha:α≠0 Alpha is statistically significant
Ho:β=0 Beta is not statistically significant
Ha:β≠0 Beta is statistically significant
3.5 MODEL SPECIFICATION
The study specified its model as follows
C=α+β Y
Where; c is consumption
21. 10
α is autonomous consumption which is independent on income if an individual income fell to
zero of his existing spending could be sustained by using savings.This is known as desaving.
β is marginal propensity to consume ,Simply ,it is the percentage of each additional shilling
earned that will be spent.There was a positive relationship between spending and income though
a weak one in that a rise in income resulted to arise but unproportional rise in consumption.
Y is real income
3.6 NATURE AND TYPE OF DATA
Data is a piece of fact ,the wholesome aggregate of which gives the information. The
information actually contributed to the inquiry of truth and approaches to the reality .The nature
of data I used in my research project was secondary data. This is because it was already available
and has been collected by the World Bank and the Ministry of Labor and was very crucial for my
investigation. Since this study was mounted on the base of description and analysis, therefore
secondary data was a must. The various internal source that the Ministry of Labor and external
source that’s the World Bank were utilized for acquiring the secondary data.
3.7 QUANTITATIVE RESEARCH
Since this study was based on and more concentrated on the impact of income on households
consumption, on this regard quantitative research was carried out. This type of was very useful to
quantify the information on the findings in the numerals. Quantifying of logical information to
numerals was the best way to come to inferences. This was because it helped to analyze the
calculated information with the standard normative values and helped in comparisons. The type
of research diagnoses casual relationship between the variables and the parameters was
conducted and expressed in terms of ratios.
22. 11
3.8QUALITATIVE RESEARCH
Since the objective of the research was to analyze the casual relationship between income and
consumption, theoretical approach was very crucial as it provided a basis of forming the
statistical relationships.
3.9 DATA COLLECTION PROCESS
The research study used secondary data therefore data from on consumption was collected from
the World Bank website ,however data from the Ministry of Labor on income was accessed
from their office with permission from the officials.
3.10 DATA PROCESSING AND ANALYSING
The secondary data collected was molded as per the requirement and objectives of the
research.The various steps that were followed included;
i) Data processing
a) Editing : Data was edited to make sure that there no errors and omissions so as to
avoid violations of OLS assumptions of heteroskedasticity ,multycollineality and
autocorrelation.
b) Coding: Data was coded so as to make the research study more systematic and
scientific ,numerals were assigned and symbols done in a coherent manner.
c) Classification: Data was in large volumes there it had to be classified into
homogenous groups that’s in rural and urban income for easier analysis.
d) Tabulation: After the successful classification of data,it was then arranged in tables
or tabulated in away to meet the standards and quality of the research.Tabulation was
essential for the systematic and logical arrangement of data for further manipulation.
23. 12
ii) Analysis
Analysis was the means to estimate the unknown values and parameters of the data.This
was very crucial to provide cases for and against the hypothesis .To achieve these goal
analysis was divided into two categories viz descriptive and inferential
a)Descriptive Analysis :It incorporated the study of distribution pof variables.This
study provided the information about the various types and nature of income and
consumption behaviors
b)Inferential Analysis: Basically I opted to use the normal method of obtaining the
ANOVA and the Spearman rank correlation coefficient to obtain the variables and draw
conlusions .This was so because the data did not attain the thirty required mark so as to
apply SPSS.
3.11 DATA ANALYSIS
The collected data was analyzed using descriptive statistics. Due the data failing to meet the
thirty mark required to apply the SPSS therefore I applied the normal method to obtain the
ANOVA and Spearman’s rank coefficient determination to obtain the correlation. . Data
collected was also scanned to ensure it was complete and that all instructions had been followed
by the respondents. Descriptive statistics included mean scores, and proportions which were used
to establish the importance of variables under study. A simple regression analysis was conducted
to test the relationship between the independent variables and the dependent variable .Results of
data analysis were presented in the form of tables and figures to help establish how income
affects consumption in Kenya.
24. 13
3.12 ETHICAL CONSIDERATIONS
The study was carried out with the available funds and within the available timeframe without
compromising its quality. Ethical considerations included confidentiality of information, names,
and sources The researcher ensured that all data collected was from distinguishable sources and
they were included in the references.In cases where data access required permission for example
accessing the ministry of labor all due considerations were made.
25. 14
4.0 CHAPTER FOUR: RESEARCH FINDINGS AND ANALYSIS
4.1 Introduction
This chapter covers data findings and analysis of the research. The data was summarized and
presented in the form of tables and graphs. The study established the consumer behavior in
relation to a unit change in real income .The research looked at data on income in rural areas
(agricultural industry) and urban areas (Nairobi, Kisumu and Mombasa).
Table 4.1 Gazette Monthly Basic Minimum Wages for Agricultural Industry (rural areas)
Type of employee(18
years and above)
1997 1998 1999 2000 2001 2002 2003 2004
Unskilled employee 1095 1259 1347 1428 1535 1642 1808 2096
Stockman, herdsman
and watchman
1263 1453 1555 1648 1772 1896 2180 2420
House servant 1249 1436 1537 1629 1751 1874 2155 2392
Farm foreman 1973 2269 2428 2574 2767 2961 3405 3780
Farm artisan 1278 1470 1573 1667 1792 1917 2257 2585
Tractor driver 1309 1505 1610 1707 1835 1963 2393 2505
Combined driver 1387 1595 1707 1809 1945 2081 2636 2656
Lorry driver 1628 1757 1880 1993 2142 2292 2767 2926
Section foreman 1604 1845 1974 2092 2249 2406 2529 3701
Average 1421 1621 1735 1839 1976 2115 2459 2781
Source: Economic survey central bureau of statistics from ministry of labor and human
resource development.
26. 15
Graph 4.12 Agricultural industry
The research established that income in the agricultural sector increased or rose at an
approximately 25% each year. Factors that were found out is that the cost of living pushed the
consumers to demand a pay rise resulting to a constant increase in income throughout the years.
The study further analyzed data in urban areas and the information was presented in the table
below.
0
500
1000
1500
2000
2500
1997 1998 1999 2000 2001 2002
average income
average income
28. 17
Graph 4.22 income in urban areas
Urban income provided a significant point of focus at the data showed high relarative rise in
income as compared to rural areas. This crucial as the cost of living in urban areas was high as
compared to rural areas where individuals provided their own food therefore self sufficiency.
Consumption data was collected from the World Bank and presented in table 4.3
Table 4.3 Kenyan household consumption in Kshs
Year Consumption value
1997 10231240000
1998 10657320000
1999 9867677000
2000 9781105000
0
1000
2000
3000
4000
5000
6000
7000
1997 1998 1999 2000 2001 2002 2003 2004
average income
average income
29. 18
2001 9618951000
2002 10633640000
2003 11497520000
2004 13572130000
Source: World Bank national accounts data. WB
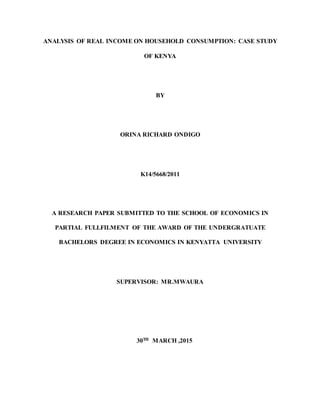
The graph 4.33 below shows consumption in vertical axis and years in horizontal axis
Consumption was taken as overall to cover both in rural and urban areas,therefore individual
consumption rose from 1997-1998 and then dropped further in 1999-2001 and then rose again
from 2002-2004.The consumption cycles observed were due to inflation rates in the country,
consumer behaviors and policies adopted by the government to promote or discourage
consumption.
0
2E+09
4E+09
6E+09
8E+09
1E+10
1.2E+10
1.4E+10
1.6E+10
1997 1998 1999 2000 2001 2002 2003 2004
CONSUMPTION
CONSUMPTION
30. 19
4.2RESEARCH FINDINGS
The research found out that income in rural areas was different from that in urban areas, but
consumption was taken as a combination of both rural and urban areas .It was established that
income in agricultural industry (rural areas) rose at an approximately 25% annually while that in
urban areas also by 25% .However, consumption did not take the same correlation as it rose from
1997-1998 then dropped drastically from 1999-2001 and then rose from 2002-2004.
The research found out that as income rose by 25% both rural and urban consumption rose by
4.165% from 1997-1998 then dropped by 0.877% from 1998-2001.The reasons cited were that
households diverted their income to cater for
I) To cater for education fees
ii) To increase their savings so as to take advantage of future investment opportunities
iii)High cost of living forcing households to cut down their consumption behaviors
iv) Households diverted from purchasing in formal outlets and grew their own food. So as to
have more income for speculative and precautionary purposes.
31. 20
4.3 CORRELATION ANALYSIS
In testing linear relationship between the dependent and independent variable, correlation
analysis was used as a very important indicator in determining the strengths and weaknesses of
variables in the model. Correlation greater than 0.8, reflects a high correlation among the
variables. The analysis was presented in the table4.4 below
YEAR AVERAGE
OF RURAL
AND
URBAN
INCOME (X)
CONSUMPTION(Y) R(X) R(Y) D(RX-
RY)
D2
1997 2222.5 10231240000 1 4 -3 9
1998 2837 10657320000 2 6 -4 16
1999 5716 9867677000 8 3 5 25
2000 3217 9781105000 3 2 1 1
2001 3459 9618951000 4 1 3 9
2002 4239 10633640000 5 5 0 0
2003 4737 11492520000 6 7 -1 1
2004 4692 13572030000 7 8 -1 1
∑D=0 ∑D2=62
32. 21
The correlation above was analyzed by use of spearman’s rank coefficient, as calculated below
𝑅 = 1 −
6𝜀𝐷2
𝑁(𝑛2 − 1)
= 0.2619 approx.0.3
The research study concluded that income and consumption had a weak correlation of 0.3
meaning that income change had a relatively small impact on consumption. Therefore it was
found that income had a 30% impact on household consumption and the other factors being held
constant.
4.4 REGRESSION ANALYSIS
The variables having passed all the statistical tests ,regression analysis was conducted. The study
estimated simple regression model. The results were tabulated as shown in table 4.5
BY ANALYSIS OF VARIANCE
SOURCE OF
VARIATION
SUM OF SQUARES DEGREE OF
FREEDOM
MEAN SUM OF
SQUARES
BETWWEN
SAMPLES
16.895 2-1 16.895/1=16.895
WITHIN SAMPLES 6.753 8-2 6.753/6=1.1255
TOTAL 23.648 8-1 F=16.895/1.1255=15.011
TABLE 4.5 ANOVA
33. 22
The F critical was calculated as follows F,1,6,0.05 ( I used the 5% level of significance)
F critical =6.61. Therefore :15.011>6.61 .This means that the overall model is statistically
significant meaning that income influences consumption.
4.5CONCLUSION
It can be concluded that income had an impact on household consumption but not a major
impact. This was shown in that income rose significantly thought the years at 25% but
consumption rose by 4.1665% from 1997-1998 then fell by 0.887% from 1999-2001 then rose
again by 15.28% from 2002-2004.This scenario indicated that even though income and
consumption had a positive correlation ,their association was weak to some extent thus positively
weakly correlated. The results showed a weak positive of 0.3 correlation between the
variables; that’s a unit increase in income led to a corresponding but not equal increase in
consumption. Reasons found were that they tried to divert their consumption to other areas such
as tuition fee, savings or reduce consumption due to the cost of living especially in urban areas
and finally they grew their own food thus lowering the purchase of goods and opting for self
sufficiency. The research further found out that in cases where consumption declined households
income increased constantly.
34. 23
CHAPTER FIVER: RESEARCH SUMMARY, CONLUSIONS AND
RECOMMENDATIONS
5.1 INTRODUCTION
This chapter presents the research summary of the collected findings, the conclusion drawn from
these findings and the recommendations the research study made.
5.2 SUMMARY FINDINGS
This study investigated the influence of an income change on household consumption in Kenya.
The objectives of this study were categorically and majorly founded on the Keynesian Theory of
consumption which looked on how consumption and income are related. This model was
regressed and correlated by use of ordinary methods, this was so because the time series data did
not reach 30 so as to apply the SPSS. The correlation analysis was calculated using the
Spearman’s rank matrix and it showed that income and household consumption had a weak
positive correlation of 0.3 meaning that their association was not such strong. Also the regression
analysis involved use of normal method of calculation due to the inability of the data to attain the
required total of 30 so as to apply the SPSS. The regressed data used the ANOVA method
showed that the variables were statistically significant.
The population included the Kenyan household consumers who did small, jobs and spend their
income on daily purchases both in rural and urban areas.
The study revealed that income in rural areas was different from that in urban areas, but
consumption was taken as a combination of both rural and urban areas .It was established that
income in agricultural industry (rural areas) rose at an approximately 25% annually while that in
urban areas also by 25% .However, consumption did not take the same correlation as it rose from
1997-1998 then dropped drastically from 1999-2001 and then rose from 2002-2004.
35. 24
The research found out that as income rose by 25% both rural and urban consumption rose by
4.165% from 1997-1998 then dropped by 0.877% from 1998-2001
5.3 CONCLUSIONS
It can be concluded that income had an impact on household consumption but not a major
impact. This was shown in that income rose significantly thought the years at 25% but
consumption rose by 4.1665% from 1997-1998 then fell by 0.887% from 1999-2001 then rose
again by 15.28% from 2002-2004.This scenario indicated that even though income and
consumption had a positive correlation ,their association was weak to some extent thus positively
weakly correlated. The results showed a weak positive of 0.3 correlation between the
variables; that’s a unit increase in income led to a corresponding but not equal increase in
consumption. Reasons found were that they tried to divert their consumption to other areas such
as tuition fee, savings or reduce consumption due to the cost of living especially in urban areas
and finally they grew their own food thus lowering the purchase of goods and opting for self
sufficiency. The research further found out that in cases where consumption declined households
income increased constantly.This evident showed the reasons why most households demanded
a pay hike and the fact that inflation currently stands at 7% .
5.4 RECOMMENDATIONS
Based on the study findings, the Kenyan household consumers increased their consumption
from 1997-1998 and then declined from1999-2001 and again rose from 2002-2004.From the
above analysis it was evident that between 1998 -2001 the decline was due to the depression
experienced in the country. The government should come up with policies to cushion consumers
in cases of unprecedented economic cycles like depression which include subsidization of daily
consumed commodities such as food, clothes so as to encourage demand and therefore enhance
36. 25
investments due to ready markets. The government should also encourage savings so as to cater
for sudden events such as retrenchments and retirements.
Finally the study recommended that households to strive to avoid too much spending in case of a
rise in income and instead divert the extra income to investment projects as a way to reduce
overdependence on only income.
5.5 SUGGESTIONS FOR THE FUTURE
This study investigated the change in income on household consumption in Kenya. Lack of
proper government mechanism to guide household and subsidize their purchases may have
resulted to change in household consumption (increase and decline over the economic
cycles).Further studies on specific country level will help identify these cause and effect between
the variables and thus increase data base for policy makers in Kenya.
37. 26
REFERENCES
Banks,James and Blundell (1998),”Is there a retirement-saving puzzle?”, IFS Working Papers
w95/04, institute for Fiscal Studies.
Browning M,Collado MF.2001.The response of expenditures to anticipated income changes:
panel data estimates.Am .Econ.Rev. 91:681-92
Bernheim BD,2001.What accounts for the variation in retirement wealth among US households?
Am.Econ.Rev.91:832-57
Economic survey central bureau of statistics from ministry of labor and human resource
development.
Friedman,M.1957 A Theory of the Consumption Function
Garcial et al 1997.Excess sensitivity and asymmetrics in consumption:an empirical
investigation.J.Money Credit Bank.29(2):154-76.Rev.44:337-58
Jappelli T, Pistaferri L.2000.Using subjective income expectation to test the excess sensitivity of
consumption to predicted income changes.Eur.Econ
John Maynard Keynes, The Economic Consequences: Indo- European Publishing 1941
Shea J.1995. Union contracts and the life cycle permanent income hypothesis.Am .Econ.Rev
85:186-200
Souleles NS 2000.College tuition and household savings and consumption.J.Public .Econ
77(1):185-207
World Bank website : World Bank national accounts data