Performance evaluation of dense bituminous macadam
11.-Vol-28-No-2-Paper-8
1. Malaysian Journal of Civil Engineering 28(2):270-283(2016)
All rights reserved. No part of contents of this paper may be reproduced or transmitted in any form or by any means
without the written permission of Faculty of Civil Engineering, Universiti Teknologi Malaysia
PREDICTION OF SOAKED CBR USING INDEX PROPERTIES, DRY
DENSITY AND UNSOAKED CBR OF LEAN CLAY
Sheikh Shahriar Ahmed, Nusaeir Hossain, Abdul Jabbar Khan* &
Mohammad Shariful Islam
Department of Civil Engineering, Bangladesh University of Engineering and Technology, Dhaka,
Bangladesh
*Corresponding Author: ajkhan66@gmail.com
Abstract: Load bearing capacity of subgrade soil is of great importance to the integrity of
pavement. Soaked CBR of subgrade soil is used as a design parameter for determining the total
thickness of a pavement for an estimated ESAL. However, determination of soaked CBR values
for pavement design involves soaking a large number of representative soil samples for four days.
This is both time consuming and economically discouraging. Establishment of mathematical
models for determining soaked CBR values for different types of soils using their index
properties, dry densities and unsoaked CBR values is likely to aid design more quickly. With this
background in mind, in this study soil samples were collected from sub-grade of an existing
flexible pavement in Savar Cantonment Area, Dhaka, Bangladesh. The soil samples were then
tested and the index properties were determined. The tested soil samples were identified as Lean
Clay and CBR test was performed both in soaked and unsoaked conditions at different densities.
The test results of the sample soil have led to the formulation of three empirical equations for
predicting soaked CBR values. Index properties of soil from grain size analysis, Atterberg limits
test and compaction characteristics from CBR test are used in the first equation to predict soaked
CBR value of this lean clay soil. The second equation relates dry density with soaked CBR
whereas the third equation relates unsoaked CBR with soaked CBR values for a varying range of
dry densities. These equations may be used to predict soaked CBR value where the sub-grade
consists of Lean Clay.
Keywords: Soaked CBR, equivalent single axle load, unsoaked CBR, sub-grade, lean clay.
1.0 Introduction
Roads and highways are in the center of economic activities in countries where land
based communication is dominant. The construction, operation and maintenance of the
roadways play vital role in the economy. To get uninterrupted and sustainable service
from the roadways, the first requirement is to construct the roads in such a way that
these are able to withstand heavy traffic loads and weathering effects during the
expected service life. The strength of soil on which the roads will be constructed is the
2. Malaysian Journal of Civil Engineering 28(2):270-283(2016) 271
basis of pavement design. So, predicting the strength of soil is of vital importance.
California Bearing Ratio (CBR) test is developed to predict the strength of soil with
reasonable accuracy under different site conditions, which helps to determine the
required sub-grade thickness for the construction of a road (LGED, 2005). The present
practice is to simulate the worst possible field condition for sub-grade soil in the
laboratory by submerging the sample soil under water for four days and determine its
strength. The samples are collected from different chainage along the centreline of a
proposed road, the number of which is significantly large and takes a very long time to
determine the strength. This affects the overall condition of the road construction project
negatively. To overcome the negative effects of the elongated time requirement, it can
be proposed that the strength of a particular type of sub-grade soil at worst field
condition can be predicted by developing empirical relationships between standard
laboratory strength of soil in four days soaked condition and properties of soil which are
quickly and easily determinable through standard laboratory tests. This study is focused
on the development of relationships through which soaked CBR can be predicted using
the rather easily determinable index properties and unsoaked CBR value of a particular
type of soil.
2.0 Available Prediction Models
The number of studies carried out to predict soaked CBR from easily identifiable
properties of soil is minimal. Only a handful of models are proposed to predict four days
soaked CBR of sub-grade soil. A model to predict CBR for plastic, fine-grained soils
from percentage passing No. 200 U.S. sieve in decimal (w) and plasticity index (PI) was
proposed in the Guide for Mechanistic and Empirical–Design for New and Rehabilitated
Pavement Structures by NCHRP (2001). The R2
value for this model is 0.67, which
indicates that the validity of this model is not reliable. The equation is:
(1)
Satyanarayana Reddy and Pavani (2006) developed a model to predict soaked CBR
value from percentage of fines (%F), liquid limit (LL) and maximum dry density of soil
(MDD). This model is applicable only when the anticipated soaked CBR value lies
within 12.8 to 56.8. When lower soaked CBR values are anticipated, this model cannot
predict reliably. The model is:
CBRS = - 0.388F - 0.064LL + 20.38MDD (2)
Vinod and Reena (2008) proposed a model to predict soaked CBR value from fraction
of soil coarser than 425 micron (%C) and liquid limit (LL). This model can predict
soaked CBR value with desired accuracy only when the CBR value lies within the limit
from 8.9 to 30.4. The model is expressed as:
3. 272 Malaysian Journal of Civil Engineering 28(2):270-283(2016)
CBRS = -0.889(WLM) + 45.616 (3)
Where, WLM= LL (1 – C/100)
Patel and Desai (2010) proposed a multiple linear regression model to determine soaked
CBR from plasticity index (Ip), maximum dry density (MDD) in g/cc unit and optimum
moisture content (OMC). This model is reasonably accurate when CBR value is within
1.54 to 4.42. Higher soaked CBR values cannot be predicted reliably with this model.
The model is:
CBRS = 43.907 - 0.093Ip - 18.78MDD - 0.3081OMC (4)
Yildirim and Gunaydin (2011) developed several models to predict soaked CBR from
the following parameters namely percentage of gravel(%G), percentage of sand (%S),
percentage of fines(%F), liquid limit(LL), plastic limit(PL), maximum dry density(MDD)
in g/cc unit and optimum moisture content(OMC). Equation 5 and 6 are only applicable
for particular type of soil. Equation 5 is applicable for coarse grained soil whereas
equation 6 is applicable for fine grained soil. These two equations cannot predict CBR
value of soil when it is contained with both fine and coarse particles. In equation number
7 and 8, MDD and OMC are determined from standard Proctor compaction test. In case
of modified Proctor compaction test, use of these parameters becomes questionable. The
proposed models are as follows:
CBRS = 0.2353G + 3.0798 (5)
CBRS = -0.1805F + 18.508 (6)
CBRS = 0.22G + 0.045S + 4.739MDD + 0.122OMC (7)
CBRS = 0.62OMC + 58.9 MDD + 0.11LL + 0.53PL - 126.18 (8)
A general multiple linear regression analysis (MLRA) model to predict soaked CBR
from index properties and compaction characteristics for all types of soil is proposed by
Ramasubbarao and Siva Sankar (2013). However, the accuracy of prediction for coarse
grained soils is not documented. The proposed model is:
CBRS = 0.064(%Fines) + 0.082 (%Sand) + 0.033 (%Gravel) - 0.069LL +
0.157PL - 1.810MDD - 0.061OMC
(9)
Here, %Fines is the sum of percentage of clay and silt from grain size analysis of soil as
per unified soil classification system (ASTM D 1883, 2004).
4. Malaysian Journal of Civil Engineering 28(2):270-283(2016) 273
Rakaraddi and Gomarsi (2015) proposed a multiple linear regression model to predict
soaked CBR from liquid limit, plastic limit, % fines and specific gravity of soil. As the
model ignores the percentage of sand and gravel, the accuracy of prediction is
questionable for coarse grained soils. The model is as following:
CBRS=0.275LL+0.118PL+0.033F+5.106G (10)
Yadav et al. (2014) conducted investigation on different types of soil and proposed a
multiple linear regression model to determine soaked CBR from liquid limit, plastic
limit, optimum moisture content, maximum dry density and % fines. This model
accuracy is questionable as it did not include particle size of soils. The model is as
following:
CBRS= -3.06 +188.64/LL-24.15/PL+ 38.06/OMC +0.225 MDD + 0.018/ F
(11)
Sathawara and Patel (2013) experimented on CL type soil and established a correlation
between 4-day soaked CBR and unsoaked CBR for the dry density achieved under
different Proctor compaction efforts. Ho ever there predicted model’s 2
value is quite
far from unity and indicates some extent of errors to a small scale. The developed model
to relate unsoaked CBR with 4-Day soaked CBR is as following:
Y=0.936X0.819
, [R2
= 0.828] (12)
Where, 'Y' stands for 4-day soaked CBR and 'X' stands for unsoaked CBR value.
3.0 Methodology and Results
3.1 Soil Sample Collection
Three soil samples were collected from three different chainage of the sub-grade of an
existing flexible pavement in Savar Cantonment, Dhaka. Then following laboratory tests
were carried out on the collected samples at the Geotechnical Engineering Laboratory of
Bangladesh University of Engineering and Technology (BUET):
Atterberg Limits Test
Grain Size Analysis
Proctor Compaction Test at different energies
Soaked and Unsoaked CBR Test
5. 274 Malaysian Journal of Civil Engineering 28(2):270-283(2016)
3.2 Identification of Soil Sample
The soil sample was identified according to Unified Soil Classification System (ASTM
D 4318, 2004; ASTM D 2487, 2004) and BNBC (1993) guideline as Lean Clay with
group symbol CL. The results are summarized in Table 1.
Table 1: Index Properties of the Collected Soil Sample
Chainage
Liquid
limit
(LL)%
Plastic
Limit
(PL)%
Plasticity
Index
(PI)%
Sand
(%)
Silt (%) Clay (%) USCS Classification
300 m 38 14 24 4 50 46 Lean Clay(CL)
600 m 40 14 26 3 51 47 Lean Clay(CL)
800 m 38 13 25 6 50 44 Lean Clay(CL)
3.3 Proctor Compaction Test Results
Proctor compaction test with different compactive efforts was performed to determine
optimum moisture contents for subsequent soaked and unsoaked CBR tests. The energy
used in compaction test is presented in Table 2 and the results of Proctor compaction
test is presented in Table 3.
Table 2: Energy used for Proctor Compaction
Compaction
Method
Energy
(kN-m/m3
)
½ of standard 309
Standard 594
Intermediate 1,620
Modified 2,700
Table 3: Optimum Moisture Content from Proctor Compaction
Chainage
Maximum
Dry Density
(kN/m3
)
Optimum
Moisture
Content(%)
300 m 18.51 13.43
600 m 18.97 13.66
800 m 18.71 13.59
6. Malaysian Journal of Civil Engineering 28(2):270-283(2016) 275
3.4 Unsoaked CBR and Soaked CBR Test Results
Optimum moisture contents determined from Proctor compaction test were used as
reference moisture content to perform both soaked and unsoaked CBR tests. The
compactive energies used for CBR tests were slightly less than that for Proctor
compaction test. The purpose of using reduced energy is to ensure that approximately 95%
of maximum dry density is achieved in CBR test to properly resemble the field
condition. The summary of the soaked and unsoaked CBR test results are listed in Table
4 and Table 5.
Table 4: Soaked CBR Results
Chainage
Target Moisture
Content (%)
Energy Used
(kN-m/m3
)
Obtained
Moisture
Content (%)
Achieved
Dry Density
(kN/m3
)
Soaked
CBR value
300 m 13.43
297 13.37 13.37 1.62
591 13.12 14.13 1.90
1,613 13.43 16.08 2.57
2,688 13.80 17.56 3.62
600 m 13.66
297 13.57 14.10 1.43
591 13.50 15.83 2.09
1,613 13.48 17.02 2.85
2,688 13.50 18.31 3.42
800 m 13.59
297 13.57 13.65 1.43
591 13.50 14.83 1.90
1,613 13.48 17.02 2.66
2,688 13.50 18.09 3.62
Table 5: Unsoaked CBR Results
Chainage
Target Moisture
Content (%)
Energy Used
(kN-m/m3
)
Obtained
Moisture
Content (%)
Achieved
Dry Density
(kN/m3
)
Unsoaked
CBR value
300 m 13.43
297 13.42 14.82 2.79
591 13.35 16.58 3.57
1,613 13.41 17.68 4.74
2,688 13.32 18.40 5.13
600 m 13.66
297 13.56 14.23 2.01
591 14.49 16.36 3.18
1,613 13.54 17.45 4.35
2,688 13.18 18.50 4.93
800 m 13.59
297 13.53 14.10 2.11
591 13.56 15.83 4.15
1,613 12.06 17.02 4.93
2,688 13.60 18.31 5.71
7. 276 Malaysian Journal of Civil Engineering 28(2):270-283(2016)
4.0 Analysis and Discussion
4.1 Multiple Linear Regression Analysis (MLRA) Model
Using the index properties, moisture content and maximum dry density of soaked CBR
test as independent variable, a multiple linear regression model is prepared using
statistical data analysis tool to predict soaked CBR. From the experimental data
presented in Table 6, the following model is prepared:
CBRS = - 0.163*(Sand %) + 0.166*(Silt %) + 0.001*(Clay %) - 0.402LL - 0.001PL +
0.222MC + 0.462MDD
(13)
Table 6: Data used to Derive MLRA Model
4.1.1 Validity of the Proposed MLRA Model
The validity of the proposed MLRA model is checked by performing Analysis of
Variance (ANOVA). The outcome of the analysis is shown in Table 7.
Chainage
Liquid
limit
(LL)%
Plastic
Limit
(PL)%
Sand
(%)
Silt
(%)
Clay
(%)
Moisture
Content
(%)
Dry
Density
(KN/m3
)
Soaked
CBR
300 m
38 14 4 50 46 13.37 13.37 1.62
38 14 4 50 46 13.12 14.13 1.9
38 14 4 50 46 13.43 16.08 2.57
38 14 4 50 46 13.8 17.56 3.62
600 m
40 14 3 51 47 13.57 14.1 1.43
40 14 3 51 47 13.5 15.83 2.09
40 14 3 51 47 13.48 17.02 2.85
40 14 3 51 47 13.5 18.31 3.42
800 m
38 13 6 50 44 13.57 13.65 1.43
38 13 6 50 44 13.5 14.83 1.9
38 13 6 50 44 13.48 17.02 2.66
38 13 6 50 44 13.5 18.09 3.62
8. Malaysian Journal of Civil Engineering 28(2):270-283(2016) 277
Table 7: ANOVA for Testing Significance of Proposed MLRA Model
Degree of
Freedom
(d.o.f)
Sum of Squares
(SS)
Mean Square
(MS)
F = MSR/MSE
Regression 7 77.8053 MSR=77.8053/7=11.1150 530.7987
Residual 7 0.2052 MSE= 0.2052/7=0.0293
Total 14 78.0105
A F-test is performed with degree of freedom (d.o.f) df1=7 and df2=7 at 95% confidence
level. The critical region will include values exceeding 3.79 for the above mentioned
criteria. If the calculated value of F exceeds the tabulated F value, then the developed
model can be considered valid. In this particular case, the calculated value, F=530.7987
is larger than tabulated value of F=3.79. So, the proposed model can be accepted as
valid.
4.1.2 Prediction of Soaked CBR using Index Properties
A comparison is made between the soaked CBR predicted using the proposed MLRA
model and observed soaked CBR for the tested soil samples. This is shown in Table 8.
Table 8: Comparison between Observed and Predicted Soaked CBR
Chainage
Observed
Soaked
CBR
Predicted Soaked CBR
using Proposed MLRA
Model
Ratio Between
Predicted and Observed
Soaked CBR
% Difference
300 m
1.62 1.55 0.96 4.38
1.9 1.84 0.97 2.91
2.57 2.81 1.10 -9.51
3.62 3.58 0.99 1.10
600 m
1.43 1.46 1.02 -1.87
2.09 2.24 1.07 -7.20
2.85 2.79 0.98 2.25
3.42 3.39 0.99 0.99
800 m
1.43 1.40 0.98 2.39
1.9 1.93 1.01 -1.34
2.66 2.93 1.10 -10.26
3.62 3.43 0.95 5.20
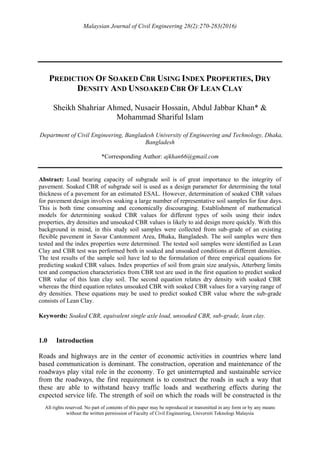
A graphical representation of the outcome from proposed MLRA model presented in
equation No. (13) is shown in Figure 1.
9. 278 Malaysian Journal of Civil Engineering 28(2):270-283(2016)
Figure 1: Result from the Proposed MLRA Model
4.2 Power Based Regression Model
4.2.1 Power Based Model using Dry Density
A model is developed to predict soaked CBR from dry density of soil subjected to
different compactive efforts. The data used to develop the model is summarized in Table
9. Graphical representation of the model is shown in Figure 2. This model has R2
value
0.921 which is close to unity and thus can be used with good certainty for predicting
soaked CBR value. The proposed model is:
CBRS=0.0007(Dry Density)2.9181
, [R2
=0.921] (14)
Figure 2: Proposed Model Relating with Dry Density
0
1
2
3
4
5
0 1 2 3 4 5
PredictedSoakedCBR
Observed Soaked CBR
Predicted Soaked
CBR vs Observed
Soaked CBR
y = 0.0007x2.9181
R² = 0.921
0
1
2
3
4
12 14 16 18 20
SoakedCBR(%)
Dry Density (kN/m3)
Soaked CBR vs Dry
Density
Power (Soaked CBR vs
Dry Density)
10. Malaysian Journal of Civil Engineering 28(2):270-283(2016) 279
Table 9: Data table for Relating Dry Density with Soaked CBR values
Chainage
Energy Used
(kN-m/m3
)
Achieved
Dry Density
(kN/m3
)
Soaked
CBR value
300 m
297 13.37 1.62
591 14.13 1.90
1,613 16.08 2.57
2,688 17.56 3.62
600 m
297 14.10 1.43
591 15.83 2.09
1,613 17.02 2.85
2,688 18.31 3.42
800 m
297 13.65 1.43
591 14.83 1.90
1,613 17.02 2.66
2,688 18.09 3.62
4.2.2 Power Based Model using Unsoaked CBR Values
Three regression equations relating dry density with Soaked CBR and three regression
equations relating dry density with Unsoaked CBR were formed to calculate the CBR
values at soaked and unsoaked conditions for a specified range of dry density. The
format of the six equations is like:
Y=AXB
(15)
Where, Y = CBR value at Soaked/Unsoaked Condition
X= Dry Density in kN/m3
A, B = Constants
The range of dry density was selected based on the observed maximum and minimum
dry densities in CBR tests at different compactive energies. The obtained results are
presented in Table 10.
11. 280 Malaysian Journal of Civil Engineering 28(2):270-283(2016)
Table 10: Unsoaked and Soaked CBR from Experimental Regression Equations
Chainage 300 m Chainage 600 m Chainage 800 m
Dry
Density
(kN/m3
)
Unsoaked
CBR
Soaked
CBR
Unsoaked
CBR
Soaked
CBR
Unsoaked
CBR
Soaked
CBR
13.5 2.16 1.68 1.94 1.47 2.08 1.35
14.0 2.40 1.86 2.21 1.66 2.36 1.52
14.5 2.66 2.06 2.50 1.87 2.65 1.69
15.0 2.94 2.27 2.82 2.10 2.98 1.88
15.5 3.23 2.49 3.16 2.35 3.33 2.09
16.0 3.55 2.72 3.54 2.62 3.71 2.30
16.5 3.88 2.97 3.94 2.91 4.12 2.53
17.0 4.23 3.24 4.38 3.23 4.56 2.78
17.5 4.61 3.52 4.85 3.56 5.03 3.05
18.0 5.00 3.81 5.36 3.92 5.54 3.33
18.5 5.41 4.12 5.90 4.31 6.08 3.62
Using the data mentioned in Table 10, a power-based equation was developed to relate
unsoaked CBR with soaked CBR. Graphical representation of the equation is shown in
Figure 3. With this equation, soaked CBR value can be predicted from the unsoaked
CBR value for CL type soil. The equation is as following:
CBRS=0.767(CBRUS)0.9362
, [R2
=0.9174] (16)
Figure 3: Soaked CBR versus Unsoaked CBR
y = 0.767x0.9362
R² = 0.9174
0
1
2
3
4
5
6
7
1 2 3 4 5 6 7
SoakedCBR(%)
Unsoaked CBR (%)
Soaked CBR vs
Unsoaked CBR
Power (Soaked CBR vs
Unsoaked CBR)
12. Malaysian Journal of Civil Engineering 28(2):270-283(2016) 281
The variation between predicted soaked CBR values using the proposed model and the
model suggested by Sathawara and Patel (2013) is graphically represented in Figure 4.
Figure 4: Comparison of Soaked CBR between proposed model and Sathawara and Patel (2013)
5.0 Conclusion
Soaked CBR of the soil is an important parameter in designing a pavement. Thereby a
quick and correct measure of soaked CBR value plays a vital part. In this study efforts
have been made to develop a correlation between soaked CBR and unsoaked CBR for
lean clay. The findings of the investigation are as follows:
a) A multiple linear regression equation has been developed to determine soaked CBR
from index properties, particle size distribution, liquid limit, plastic limit, maximum
dry density and moisture content. The equation is as following:
CBRS = - 0.163*(Sand %) + 0.166*(Silt %) + 0.001*(Clay %) - 0.402LL -
0.001PL + 0.222MC + 0.462MDD
b) A regression equation has been developed to relate soaked CBR values from
available dry density data. The equation is as follows:
CBRS = 0.0007(Dry Density)2.9181
, [R2
=0.921]
y = 0.936x0.819
y = 0.767x0.9362
2
3
4
5
6
2 3 4 5 6 7 8 9
SoakedCBR(%)
Unsoaked CBR (%)
model proposed by
Sathawara J.K and Patel
A.K(2013)
proposed model for
predicting soaked CBR
value
13. 282 Malaysian Journal of Civil Engineering 28(2):270-283(2016)
c) A regression equation has been developed to relate soaked CBR with unsoaked CBR
for lean clay based on the laboratory test results. The equation is as follows:
CBRS=0.767(CBRUS)0.9362
, [R2
=0.9174]
d) Comparison has been made with similar equation developed by Sathawara and Patel
(2013) and the results from this investigation closely resemble their findings.
Additional number of soil samples can be tested for further refinement of developed
model. The same procedure of the investigation can be used for other types of soils to
develop a correlation of soaked and unsoaked CBR values which can be used in the
practical works with great convenience.
References
ASTM D 4318 (2004). Standard Test Methods for Liquid Limit, Plastic Limit and Plasticity Index
of Soils, ASTM International, West Conshohocken, PA.
ASTM D 2487 (2004). Standard Practice for Classification of Soils for Engineering Purposes
(Unified Soil Classification System), ASTM International, West Conshohocken, PA.
ASTM D 1883 (2004). Standard Test Method for CBR (California Bearing Ratio) of Laboratory-
Compacted Soils, ASTM International, West Conshohocken, PA.
BNBC (1993). Bangladesh National Building Code Housing and Building Research Institute,
Dhaka, Bangladesh.
LGED (2005). Road Design Standards Local Government Engineering Department(LGED),
Dhaka, Bangladesh.
NCHRP. (2001). National Cooperative Highway Research Program Guide for Mechanistic and
Empirical–Design for New and Rehabilitated Pavement Structures, Final Document,
Appendix CC-1: Correlation of CBR Values with Soil Index Properties, West University
Avenue Champaign, Illinois, USA.
Patel, R.S. and Desai, M.D. (2010). CBR predicted by index properties for alluvial soils of South
Gujarat. Proceedings of the Indian Geotechnical conference. Mumbai, India, 79-82.
Rakaraddi, P.G. and Gomarsi, V. (2015). Establishing Relationship Between CBR with Different
Soil Properties. International Journal of Research in Engineering and Technology, 4(2),
pp.182-188.
Ramasubbarao, G.V. and Siva Sankar, G. (2013). Predicting Soaked CBR value of fine grained
soils using index and compaction characteristics. Jordan Journal of Civil Engineering,
7(3): 354-360.
Sathawara J.K. and Patel A.K. (2013). Comparison between Soaked and Unsoaked CBR.
International Journal of Advanced Engineering Research and Studies, 2 (1): 132-135.
Satyanarayana Reddy, C.N.V. and Pavani, K. (2006). Mechanically Stabilised Soils-Regression
Equation for CBR Evaluation, Proceedings of the Indian Geotechnical Conference,
Chennai, India, 731-734.
Vinod, P. and Reena, C. (2008). Prediction of CBR Value of Lateritic Soils Using Liquid Limit
and Gradation Characteristics Data. Highway Research Journal, IRC, 1 (1): 89-98.
14. Malaysian Journal of Civil Engineering 28(2):270-283(2016) 283
Yadav, D., Jain P.K. and Kumar, R. (2014) Prediction of Soaked CBR of Fine Grained Soils
from Classification and Compaction Parameters. International Journal of Advanced
Engineering Research and Studies, 3 (4): 119-121.
Yildirim, B., and Gunaydin, O. (2011). Estimation of California bearing ratio by using soft
computing systems. Expert Systems with Applications, 38(5), 6381-6391.