Download to read offline

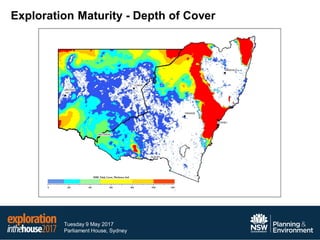
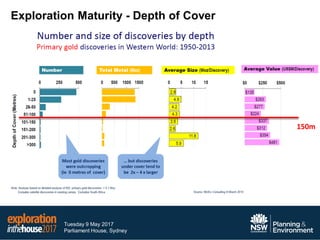
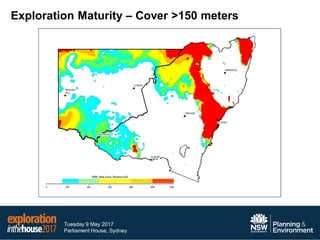
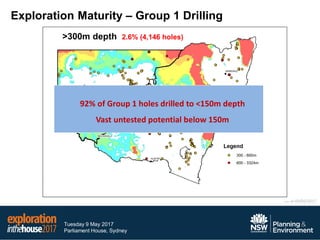
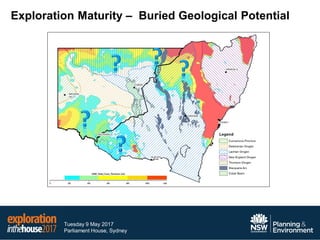
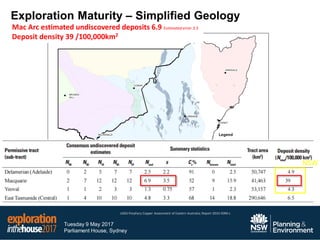
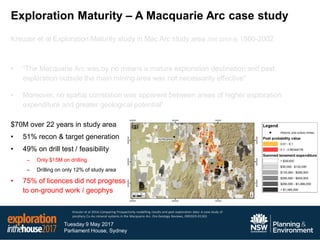
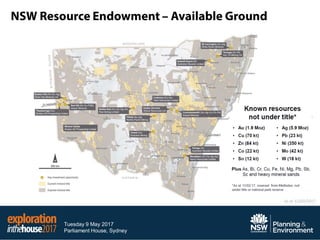
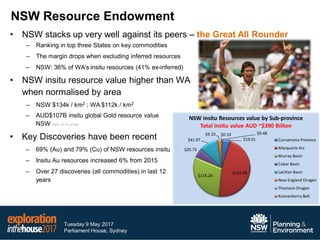
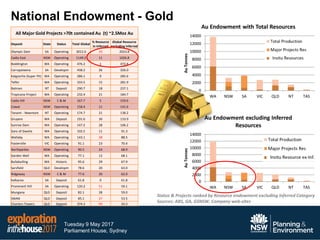
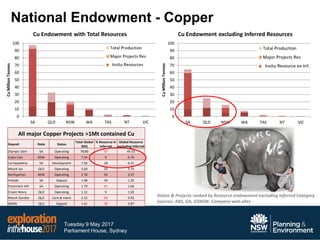

This document discusses the exploration potential of New South Wales (NSW), Australia. It notes that exploration maturity is low, as only a small percentage of drilling has reached depths below 150 meters where potential deposits may be buried. Much of the prospective Macquarie Arc and Thompson Orogen regions remain untested under shallow cover. NSW has a large endowment of resources like gold and copper, ranking highly compared to other Australian states. However, these resources are largely untapped below 150 meters depth. The document argues that NSW presents excellent opportunities for mineral discoveries, as vast areas of prospective geology remain under-explored at depths with potential for tier 1 deposits.


