5. Graph
DESCRIPTIVES VARIABLES=MarkBall MarkCall
/STATISTICS=MEAN KURTOSIS SKEWNESS.
Descriptive Statistics
N Mean Skewness Kurtosis
Statistic Statistic Statistic Std. Error Statistic Std. Error
Total of Extraversion 44 34.4773 .488 .357 2.845 .702
Total of Self Esteem 43 28.4419 .941 .361 1.921 .709
Valid N (listwise) 43
PPLOT
6. /VARIABLES=MarkBall MarkCall
/NOLOG
/NOSTANDARDIZE
/TYPE=P-P
/FRACTION=BLOM
/TIES=MEAN
/DIST=NORMAL.
PPlot
Model Description
Model Name MOD_2
Series or Sequence 1 Total of Extraversion
2 Total of Self Esteem
Transformation None
Non-Seasonal Differencing 0
Seasonal Differencing 0
Length of Seasonal Period No periodicity
Standardization Not applied
Distribution Type Normal
Location estimated
Scale estimated
Fractional Rank Estimation Method Blom's
Rank Assigned to Ties Mean rank of tied values
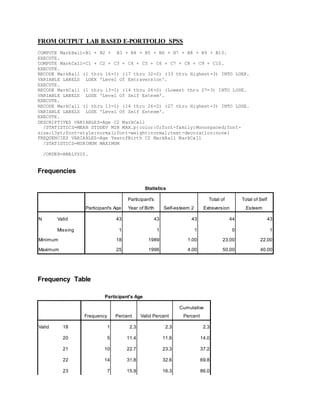
Applying the model specifications from MOD_2
Case Processing Summary
Total of
Extraversion
Total of Self
Esteem
Series or Sequence Length 44 44
Number of Missing Values in
the Plot
User-Missing 0 1
System-Missing 0 0
The cases are unweighted.
7. Estimated Distribution Parameters
Total of
Extraversion
Total of Self
Esteem
Normal Distribution Location 34.4773 28.4419
Scale 4.50575 3.68590
The cases are unweighted.
Total of Extraversion