
Recommended
Recommended
More Related Content
What's hot
What's hot (20)
Similar to An introduction to structural equation models in R using the Lavaan package
Similar to An introduction to structural equation models in R using the Lavaan package (20)
More from Noam Ross
More from Noam Ross (13)
Recently uploaded
Recently uploaded (20)
An introduction to structural equation models in R using the Lavaan package
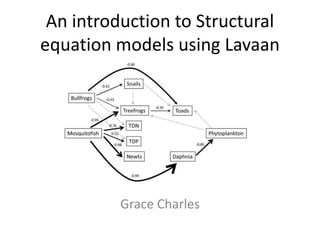
- 1. An introduction to Structural equation models using Lavaan Grace Charles
- 2. Jim Grace at USGS has a great website that goes through basics of SEMs http://www.nwrc.usgs.gov/SEM/ Other tutorials http://lavaan.ugent.be/tutorial/tutorial.pdf http://jarrettbyrnes.info/ubc_sem/
- 3. Why SEMs? • Good for testing complex hypotheses and alternative hypotheses – Typically involve multiple equations and represent “network” hypotheses • Can test direct and indirect interactions between variables • Variables can be both exogenous (predictors) and endogenous (response)
- 4. Sample size (taken from Jim Grace) • First, there are problems with any guidance on sample size. • Second, simulations show we would really like to have huge • sample sizes (see Model Evaluation module) • People often talk about absolute sample sizes (e.g., 200 best, 100 OK, 50 minimal). But, it depends on model complexity (and signal-to-noise ratios) • (1) We would love to have 20 samples per parameter (2) It would be helpful to have 10 samples per parameter (3) We hope to have a minimum of at least 5 samples per estimated parameter (4) It is claimed that Bayesian estimates are stable with as few as 2.5 samples per parameter.
- 7. What can you specify? • Direct and indirect pathways • “Latent” variables • Covariance between variables (assumed for regressions, have to specify otherwise) • Other things not covered today: composite variables, non-linear relationships, time series, etc.
- 8. What does summary output actually mean??? • This is actually a poor fit • P-value represents the probability you will reject your null hypothesis, but in this case the null hypothesis is that your model is the right fit for your data. I would use modindices(fit) to look for possible missing links.
- 9. What does summary output actually mean???
- 10. Other possibilities • Nonlinearities in data • “Composite” variables • Time Series • Bayesian approaches • Spatial autocorrelation