Boost PC performance: How more available memory can improve productivity
Unknown E
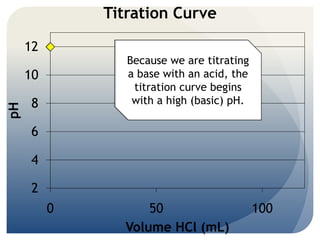
1. Titration Curve
12
Because we are titrating
10 a base with an acid, the
titration curve begins
8 with a high (basic) pH.
pH
6
4
2
0 50 100
Volume HCl (mL)
2. Titration Curve
12
The titration curve begins
to flatten, hinting that
10
we are nearing a pKa
8
pH
6
4
2
0 50 100
Volume HCl (mL)
3. Titration Curve
12
The curve
10 begins to roll
over, confirming
8 that we have a
pH
pKa≈9.5
6
4
2
0 50 100
Volume HCl (mL)
4. Titration Curve
12
10
The steep drop
8 in pH indicates
pH
that we are
6 passing the
equivalence
4 point
2
0 50 100
Volume HCl (mL)