1. 1
Abstract:
Background: Like any other fastest growing cities in third world countries slums are becoming dominant type of human settlement
in Bhubaneswar, craving their way into the fabric of the main city. An estimated 0.3 million (BMC, 2008) people reside in the slums
of the City of Temple, which is almost one third of its total population size. Due to high population density, overcrowding, lack of
safe water and sanitation slums are productive breeding grounds for several communicable diseases majority of which are water
and vector borne in nature. Seasonal outbreaks of such diseases are common phenomenon in slums. Available surveillance system
does not help much in prediction of those epidemics. Eventually Health services providers are grappling with management of such
outbreaks. Current study was an effort to find out the hot-spots (significant clusters) of those diseases across Bhubaneswar slums
based on two years’ of data collected from the OPD registers of urban slums health centers. The identified outbreak pattern would
help the concerned authority to design control measures in advance. The study also aimed to demonstrate how such value additions
in the existing surveillance system can make management of outbreaks more effective.
Methods: Pure Spatial and Space-time cluster identification was done for water borne diseases using spatial and space-time scan
statistics, where as for water based vector borne diseases only pure spatial clusters were identified. Data of new cases over the year
2011-2012 were taken from the OPD registers of the urban slum health centers located within the slums. The discrete Poisson
model for spatial and space-time scan statistics was chosen for detecting high risk clusters (hot-spot)
Results: Total 9 spatial clusters and 6 space time clusters were identified in case of water borne diseases with varying radios and
significance. Further scanning revealed that diarrhea hot spots are located in northern part where as dysentery hotspots are located
in the southern part of the city. Only three spatial clusters were found in case of water based vector borne diseases. Those again
coincided with three clusters of water borne diseases. The overlapping suggests that poor environmental sanitation and socio-
economy in slums mediate risk factors for both types of diseases.
Conclusions: Water borne diseases like diarrhea and dysentery and water based vector borne diseases like malaria, fileria etc. have
spatial and spatio-temporal clusters. It indicates the need to address prevention and control measures in those identified hotspots.
Sndromic surveillance system as depicted in the study can be adopted for the slums of entire city .It can predict outbreaks in
advance and can help them manage effectively.
Key wards | Water borne disease; water based vector borne diseases; spatial cluster; spatiotemporal cluster; urban slums;
Syndromic survelliance
Identification of hot-spots of Water borne diseases and Water based vector borne
diseases in slums of Bhubaneswar City
Introduction
According to Census 2011, Odisha is one of the top five
states with 23.1% of its urban households located in the
slums. In the state capital Bhubaneswar total 0.3 million
population reside in slums across Bhubaneswar
Municipal Corporation (BMC) area and it’s out growth.
The last decade has seen a prolific growth of slum
population in the city due to vast devastation caused by
super cyclone. It led to huge in-migration from rural
hinterlands, other parts of states and even outside of
the states in search of employment mainly in the
construction sector. The city has total 377 slums out of
which only 99 slums are authorized (BMC, 2008). Most
of the slums are located encroaching unutilized govt.
land / railway land which were temporarily vacant. Low
2. 2
income group people reside in those areas in poor living
condition devoid of basic services and amenities .With
the proliferation of slums the city started getting its
share of challenges in terms of complex disease
etiologies and risk factors. Absence of proper
infrastructure, especially primary health care services
for urban poor is making the health outcomes more
skewed. Slum areas are witnessing seasonal outbreaks
of diarrhea and malaria. Bhubaneswar Municipal
Corporation with the support from National Rural
Health Mission (NRHM) and in collaboration with eleven
local NGOs is running urban slum health centers located
within the slums. These centers render basic health care
services to the urban poor. However seasonal outbreaks
of water borne and water based vector borne diseases
in slums has evolved as perpetual public health
challenges for the city. Chief Municipal Medical Officer
of Bhubaneswar Municipal Corporation Hospital
approached Population Foundation of India seeking
support in mapping the spatial outbreak pattern of the
water borne disease in slums of the city. This is how
the idea of undertaking the current study was
germinated.
Despite clear dissimilarity of the etiologic agents water
based vector borne diseases (mainly malaria, fileriasis)
and water borne diseases( diarrhea, dysentery, typhoid
etc.) both seem to share common risk factors which are
largely mediated by poor environmental sanitation
infrastructure and socioeconomic condition. In this
pioneering study these two type of diseases were
considered for identification of their hot spots.
Ideally such spatiotemporal studies should be
undertaken in all the slums in the cities. However
current study was confined within 168 slums where
HUP has its presence. In such epidemiological studies
clusters of disease occurrence and their statistical
significance etc. are determined by applying certain
mathematical (discrete Poisson distribution model was
used in current study) model. A robust database
comprising of cases along with its time of diagnosis,
place of occurrence, geo location and population size
of those places of occurrences over a significant period
of time is a prerequisite for this kind of study. In present
study the supply of data was one of the major
hindrances. Often existing surveillance system provides
the data of cases over a considerable period of time.
Mainly Census or other type of survey is the source of
population data of particular geographical units (in
present case it was slum). It was difficult to extract slum
specific case data from existing surveillance system.
Getting slum population data over a regular interval of
time was also difficult as census has recently started
capturing slum data. To overcome this constrains only
HUP intervention slums were opted. In those slums
population survey in two consecutive years (2011 &
2012) was conducted as a part of HUP intervention. The
outpatient registers of the all five urban slum health
centers serving those slums were the sources of cases
and their place of occurrence, date of diagnosis, age,
gender etc. The corresponding time interval was kept
from 1st
January 2011 to 31st
December 2012.
Objectives:
1. To identify significant high risk clusters of
occurrence of water borne and water based
vector borne diseases across slums of
Bhubaneswar
3. 3
2. To demonstrate how existing surveillance
system can be upgraded for effective
management of outbreak which is otherwise a
perpetual challenge for health service provides.
Methods
Study area
As mentioned in the previous section current study was
confined within 168 slums across 24 municipal wards of
Bhubaneswar city. Out of those slums 142 were
coterminous with the catchment areas of five urban
slums health centers (Fig: 1). However there was no
designated urban slums health centers for remaining 26
slums located across ward no 1,2,7 and 8 and they were
dependent on the health centers located at adjacent
ward number 9( Fig:9) Each urban slum health centers is
supposed to cater 25,000 slum populations.
Data Sources
The study was conducted by using primary and
secondary data. The disesas case data were obtained
by screening OPD registers of five urban slums health
cneters along with date of diagnosis, age , gender and
habitual location of patients. Survey conducted by HUP
was the source of population data for the identified
habitual locations. Gramin GPS tracker was used to
record latitude and longitude of all the identified
locations. Out of five some of the urban slum health
centers were started functioning since last quarter of
2010, rest were from 1st
quarter of 2011. To keep
symetry only case data of complete 2011 and 2012
were screend and considered for the current study.
Screening of OPD registers revealed five types of water
borne diseases and two types of vector borne disease
were predominantly diagnosed in the year 2011 and
2012. In current study only those diseases were
included. Following table depicts the classification of
diseases
Type of diseases Name of diseases
Waterborne diseases(WBD) Diarrhea
Dysentery
Cholera
Typhoid
Hepatitis A,D/Jaundice
Water based vector borne
diseases(WBVB)
Malaria
Filaria
Table 1| Disease categorization
While creating the database all the new cases were
captured to represent the incidence only for the
corresponding diseases. Once the database was ready
all the cases without the information of patient’s
residing area/slum were excluded.
Analytical and modeling technique:
Incidence analysis
Incidence of water borne diseases and water based
vector borne diseases were plotted against covariates
like age group and sex. Also an age -sex composite
distribution of the diseases were analyzed and
presented with pyramid. MS Excel and SPSS v16 were
used for incidence analysis
Cluster Analysis
A retrospective purely spatial and space-time scan
statistic was applied to detect high risk clusters
[vulnerable pockets] of waterborne diseases and water
based vector borne diseases by using SaTScan™
software (version 9.2) with a discrete Poisson model.
The Poisson distribution model is used to describe
Figure 1| Ward map showing study area
4. 4
discrete quantitative data such as counts (incidence of
diseases) in which population size (say N) is large, the
probability of an individual event (occurrence of
diseases per 100,000 populations, say p) is small but
expected number of events Np is moderate. SaTScan™
uses a Poisson-based model, where the number of
events in a geographical area is Poisson-distributed,
according to a known underlying population at risk. The
distribution formula says ܲ௫ ሺܺሻ = ሺܺ = ݇ሻ =
݁ି
ߣ
/݇! where
k= actual case of
occurrence and ߣ
= expected
number of
occurrence.
In case of spatial
scan statistics it
imposes a circular
window on the
map. The window
is in turn
centered around
each of several
possible centroids positioned throughout the study
region. For each centroid, the radius of the window
varies continuously in size from zero to some upper
limit. In present study it was taken 50% of the
population at risk to avoid any pre selection bias. In this
way, the circular window is flexible both in location and
size. In total, the method creates an infinite number of
distinct geographical circles, with different sets of
neighboring census areas within them, and each being a
possible candidate for a cluster. The set of centroids
used is defined either in a special grid file, or they are
taken to be identical to the different census locations as
specified in the coordinates file. The latter option
ensures that each census area is a potential cluster in
itself.
The space-time scan statistic is defined by a cylindrical
window with a circular geographic base and with height
corresponding to time. The base is defined exactly as for
the purely spatial scan statistic, while the height reflects
the time period of potential clusters. The cylindrical
window is then moved in space and time, so that for
each possible geographical location and size, it also
visits each possible time period. In effect, we obtain an
infinite number of overlapping cylinders of different size
and shape, jointly covering the entire study region,
where each cylinder reflects a possible cluster.
The cylindrical window moves over space and time
scanning for an elevated risk within the space-time
window as compared to outside the window.
The null hypothesis assumes that incidences of diseases
are randomly distributed. The alternative hypothesis for
each scanning window is that there is an elevated risk
inside the window as compared to outside.
Hypothesis:
H0: The incidence rate is the same over the study area
(homogeneous or relative risk =1)
Ha: The rate is higher in A (Fig:2)
Under null hypothesis and when there are no
covariates, the expected number of cases (ߣ) in each
area is proportional to the population size or person
year of that area.
The difference of the incidence inside and outside each
window was calculated by the log likelihood ratio (LLR).
L0 = Likelihood under the null hypothesis
La = Likelihood under the alternative hypothesis
LLR= La / L0
According to the Kulldorff’s scan statistics if K be the
total number of incidence of diseases in the study area
and k be the observed number of incidence in within
the circular/ cylindrical window and ߣ be the
covariates adjusted expected number of incidence in
the window under null hypothesis. Let the number of
diseases incidences in the study area follow Poisson
distribution then
LLR= La / L0 ߙ ቂ
ఒ
ቃ
ቂ
ି
ିఒ
ቃ
ି
ܫሺሻ
Since the analysis is conditioned on the total number of
cases observed, K-ߣ is the expected number of cases
outside the window. I() is an indicator function. When
SatScanTM
is set to scan only for clusters with high rates,
Figure 2| Illustration of scan window
5. 5
I() =1 when the window has more cases than expected
under null hypothesis, and 0 otherwise.
Significant results (based on Monte Carlo simulation)
from these were defined as a cluster. Among the
statistically significant clusters, the cluster with the
maximum LLR indicates one that is least likely to have
occurred by chance which is thus the most likely cluster.
Secondary clusters were those in rank order after the
most likely cluster, based on their likelihood ratio test
statistic. The relative risk of each cluster is the ratio of
the estimated risk within the cluster to that outside the
cluster (Kulldorff.M, 2013)
SaTScanTM
adjusts for the underlying spatial in
homogeneity of a background population. It can also
adjust for any number of categorical covariates
provided by the user, as well as for temporal trends,
known space-time clusters and missing data. It is
possible to scan multiple data sets simultaneously to
look for clusters that occur in one or more of them.
Though covariates like age and sex were an integral part
of the database yet those were not incorporated in the
model to keep the output simple.
Result
After doing all adjustments for the study duration,
habitual residence of patients total 2476 cases of
waterborne diseases were identified to be used in the
model and total 61 cases of water based vector borne
diseases were identified. In case of water borne
diseases Diarrhea occupies the top slot with 74
%(n=2476) identified cases followed by Dysentery.
Whereas in case of water based vector borne diseases
Malaria was the majority with 92% identified cases
(n=61)
Type of diseases Name of
diseases
No of case
identified
Waterborne
diseases(WBD)
Diarrhea 1864
Dysentery 605
Cholera 0
Typhoid 1
Hepatitis
A,D/Jaundice 5
Water based vector
borne diseases(WBVB)
Malaria 56
Filaria 5
Table 2| Distribution of reported cases
Age groups have been found one of the deciding factors
in terms of both waterborne and water based vector
borne diseases. Following table depicts the distribution
of diseases according to age groups.
Age groups WBD WBVBD
0-1 132 0
1-5 508 3
5-15 499 7
15-25 352 17
25-35 429 15
35-45 244 12
45-55 130 4
55-65 82 3
≥65 94 0
Missing vale 6 0
Total 2476 61
Table 3 | Age wise distribution of disease distribution
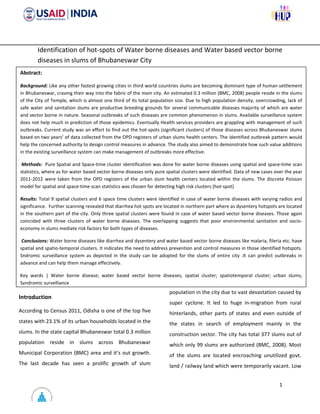
In both the category of diseases number of female
patients was found more than the number of male
patients.
Sex WBD N WBVBD N
Count % Count %
Female 1380 56 2476 33 59 61
Male 1096 44 28 41
Table 4| Sex wise diseases incidence distribution
6. 6
Figure 4| Age-sex distribution of WBVBD
Cluster detected
With a purely spatial scanning considering all the water
borne diseases together nine clusters with elevated risk
were detected.(Fig:5) Out of nine three were found
statistically insignificant(p>.000001). The primary
cluster of water borne disease was found on the
northern part of city across ward number 9 with radios
of 0.12 km. Three adjacent slums come under this
cluster comprising three adjacent slums. The log
likelihood ratio was found 868.79 (p<.000001). The
maximum likelihood ratio indicates this cluster is less
likely to be formed by chance and also the value of
relative risk (RR=9.5) signifies how intense the cluster
was. All the clusters were plotted by ArcView GIS 3.2
and presented in map
With the same data set however space-time scan
statistics detects 6 significant clusters (Fig:6), where the
centroid of primary cluster got slightly shifted from the
primary cluster identified in previous case(Fig:5). While
Panda Park was the centriod of the primary cluster in
previous case, HKNagar evolved as the centriod in
present case. The radius of primary cluster this time is
bigger covering .37 km and containing five adjacent
slums and cluster lasted only for 2012. The relative risk
was found slightly lower than the previous case
(RR=8.65). Since the different water borne diseases
have different etiological agents with the segregation of
disease clustering pattern gets totally changed. While
the northern part of the city was identified with the
primary clusters of diarrhea (Fig: 7), slums of the
southern part were more prone to dysentery (Fig:8).
Despite clear dissimilarity of the etiologic agents water
based vector borne diseases (mainly malaria, filarial)
and water borne diseases( diarrhea, dysentery, typhoid
etc.) both seems to share common risk factors which
are largely mediated by poor environmental sanitation
infrastructure and socioeconomic condition. Pure
spatial scan statistics identified three clusters of Water
based vector borne diseases two of which coincides
with the same geographical area having indentified with
clusters of water borne disease(Fig:9 & 7 ) No space
time clusters of water based vector borne diseases were
identified based on available data.
0
2
3
7
-9
4
1
2
0
0
1
4
10
6
8
3
1
0
10 0 10 20
0-1
1-5
5-15
15-25
25-35
35-45
45-55
55-65
>65
Female
Male
79
241
254
130
148
110
55
38
38
53
267
245
222
281
134
75
44
56
400 200 0 200 400
0-1
1-5
5-15
15-25
25-35
35-45
45-55
55-65
>65
Female
Male
Figure 3| Age-sex distribution of WBD cases
7. 7
Following table depicts the details of nine spatial clusters identified
Cluster Location ID Long Lat Raious(km) Location LLR
p-
value Observed Expected OR RR
1 PandaPark 20.32587 85.798745 0.12 3 868.797479
1.00E-
17 714 101.25 7.05 9.5
2 Mundasahi 20.282232 85.805044 0 1 212.570223
1.00E-
17 343 92.53 3.71 4.14
3 JanataNagar 20.301508 85.81132 0.083 2 80.893849
1.00E-
17 252 103.23 2.44 2.6
4 JayadevNagarBasti 20.247004 85.840296 0.49 2 59.511693
1.00E-
17 81 18.04 4.49 4.61
5 KapileswarBhoiSahi 20.230106 85.830032 0 1 55.259999
1.00E-
17 40 4.12 9.7 9.84
6 NilachakraNagar 20.302421 85.817028 0 1 48.486951
1.00E-
17 285 153.68 1.85 1.97
7 KapileswarBasti 20.229712 85.816737 0 1 7.15407 0.024 13 3.66 3.55 3.57
8 GangaNagar 20.262421 85.815095 0 1 1.964492 0.975 14 7.84 1.79 1.79
9 Balitotasahi 20.280774 85.814593 0 1 1.683479 0.992 42 31.27 1.34 1.35
Table 5| Detail of the nine clusters of water borne diseases
Figure 5| Spatial cluster of water borne disease
8. 8
Kapileswar Bhoisahi ranked 5 th based on its LLR score. It is one of the significant secondary clusters of water borne
diseases. However its relative risk (RR=9.84) is higher than even primary clusters (9.5). This signifies the intensity of this
cluster and
Following table depicts the detail of space time clusters with end and beginning time of the clusters
Clust
er Location ID Lat Long
Radios(k
m) Start date End date
No
location LLR
p-
value
observ
ed
expect
ed OR RR
1 HKNagar
20.3280
91
85.7995
36 0.37
01/01/20
12
31/12/20
12 5
781.1711
55
1.00E-
17 689 106.69 6.46 8.56
2 Mundasahi
20.2822
32
85.8050
44 0
01/01/20
12
31/12/20
12 1
165.7162
53
1.00E-
17 214 46.33 4.62 4.96
3 JanataNagar
20.3015
08
85.8113
2 0.083
01/01/20
11
31/12/20
11 2
102.3506
78
1.00E-
17 252 90.4 2.79 2.99
4
JayadevNagarBa
sti
20.2470
04
85.8402
96 0.49
01/01/20
11
31/12/20
11 2
91.73251
1
1.00E-
17 79 10.52 7.51 7.72
5
NilachakraNaga
r
20.3024
21
85.8170
28 0
01/01/20
11
31/12/20
11 1
85.69790
2
1.00E-
17 193 64.9 2.97 3.14
6
KapileswarBhoi
Sahi
20.2301
06
85.8300
32 0
01/01/20
11
31/12/20
11 1
70.22669
6
1.00E-
17 35 1.84
19.0
6
19.3
2
Table 6| Details of the six space-time clusters of water borne diseases
The primary space- time cluster was found existing within 2012 only and it was found comprising 5 locations with HK
Nagar being the centriod. Out of five locations one is Panda Park the centroid of the primary cluster detected in purely
Figure 6| Space time cluster of Water borne diseases
9. 9
spatial scanning. Cluster 2 in rank of log likelihood ratio was also found to exist within 2012. However remaining four
secondary clusters’ duration were confined within 2011. The 4th
secondary cluster with Jaydevnagar basti as its centroid
demands special attention apart from primary clusters as it spreads over .49 km area containing two adjacent slums
having relative risks RR= 7.72 which is at per the primary cluster. Despite relatively low LLR score 6th
cluster again
demands special attention as it RR= 19.3 is even greater than the primary cluster.
Following table depicts the detail of four identified hot-spots of diarrhea
CLUST
ER LOC_ID
LATITU
DE
LONGIT
UDE
RADI
US
START
DATE
END
DATE
No of
LOC LLR
p
VALUE
OBSERV
ED
EXPECT
ED OR RR
1 HKNagar
20.3280
91
85.7995
36 0.37
01/01/20
12
31/12/2
012 5
643.568
378
1.00E-
17 544 80.27
6.7
8
9.1
6
2 Mundasahi
20.2822
32
85.8050
44 0
01/01/20
12
31/12/2
012 1
212.545
714
1.00E-
17 211 34.86
6.0
5 6.7
3 JanataNagar
20.3015
08
85.8113
2 0.083
01/01/20
11
31/12/2
011 2
147.396
683
1.00E-
17 246 68.02
3.6
2
4.0
1
4
NilachakraN
agar
20.3024
21
85.8170
28 0
01/01/20
11
31/12/2
011 1
80.9430
53
1.00E-
17 159 48.83
3.2
6
3.4
7
Table 7| Detail of four Diarrhea clusters
All the four clusters are found significant however geographically located in the northern side of the city. The primary
cluster which comprises five locations and with radius 0.37 km began in 2012 and ended in the same year. One of the
secondary clusters was also confined within 2012. Remaining two clusters were started on 2011 and ended in the same
year. Since the time precision was taken only year this scan statistics does not show any intermediate clusters
When dysentry cases are scanned seperately the primary clusters appeared in the southern part of the city with
relativly bigger radius of 1.94 km , while Samantrapur Basti remained the centriod of the clsuter it spread across 7 other
location. This cluster was bengan in 2011 and it implies that that year southern part of the city has come acrros certain
out breaks of dysentry. Other two secondary clusters how ever coincide with the cluster centriod of dirrhoea and the
Figure 7 | Space time clusters of Dirrhea
10. 10
clusters began only in 2012. Following map shows the location of the identified clusters of dysentry along with the
detail description of the clusters their likelihood ratio, p-value; ods ratio and relative risks.
Following table is presenting the details of the identified hotspots of the dysentery across slums of Bhubaneswar.
LOC_ID
LATITUD
E
LONGITU
DE
RADIU
S
START
DATE END DATE
NUMBER
LOC LLR P VALUE
OBSERVE
D
EXPECTE
D OR RR
SamantrapurBa
sti
20.22952
8
85.83999
8 1.94
01/01/201
1
31/12/20
11 8
187.0721
89 1.00E-17 113 9.39
12.0
3
14.5
7
PandaPark 20.32587
85.79874
5 0.12
01/01/201
2
31/12/20
12 3
163.1254
82 1.00E-17 117 12.96 9.03
10.9
5
NilachakraNaga
r
20.30242
1
85.81702
8 0
01/01/201
2
31/12/20
12 1
15.04009
9
0.000016
7 51 21.69 2.35 2.48
Table 8| Detail of the dysentery clusters
In case of water based vector borne diseases small numbers of cases were obtained from OPD registers and that too of
Malaria and Fileria. No space –time clusters were identified with the data however three pure spatial clusters were
detected in the study area. Out of three only the primary clusters with LLR value 31.24 were found statistically
significant. Though first secondary cluster with its centroid located at Kapileswar Bhoi Sahi was found statistically
insignificant ( p>.00001) yet its maximum relative risks (RR=10.29) demands special attention. All three clusters have
been found to share same geographic location with previously identified hot-spots of water borne diseases. Following
table represents the detail of the clusters for water based vector borne diseases.
CLUSTER LOC ID LATITUDE LONGITUDE RADIUS No of LOC LLR p VALUE OBSERVED EXPECTED OD RR
1 Mundasahi 20.282232 85.805044 0 1 31.241963 4.88E-15 32 6.84 4.68 8.73
2 kapileswarBhoiSahi 20.230106 85.830032 0 1 4.222975 0.059 3 0.31 9.83 10.29
3 GangaNagar 20.262421 85.815095 0 1 1.072667 0.831 2 0.58 3.45 3.53
Table 9| Detail of the clusters of water based vector borne diseases
Figure 8| Location of the clusters of the dysentery in Bhubaneswar slums
11. 11
Figure 9| Location of clusters of vector borne diseases
Figure 10| Common hot spots
12. 12
Conclusion
Current study was an effort to demonstrate such
surveillance system can be helpful in various ways from
planning for preventive measures, management of
outbreaks to policy formation. Continuous surveillance
system can validate the identified clusters and further
longitudinal studies can be undertaken there for
identification of causal factors.
In case of space – time scan statistics the precision time
was taken one year (2011-12) due to paucity and poor
quality of data. Once active or syndromic surveillance
system is in place clustering pattern in month, weak and
even day basis is possible. Managing outbreaks can be
more effectively with that prediction.
Current study reveals that northern part of the city is
more prone do diarrhea while in southern part a large
cluster of dysentery was indentified. Secondary
information also suggests the yearly outbreaks of water
borne diseases in southern part. Sources from Public
Health Engineering department suggest it is because of
the land formation of the area. Laterite soil is
predominant in this area which is porous in nature.
Eventually it leads to subsurface water contamination.
High prevalence of using of dug well in this area also
may be another reason. All the facts demand further
integration. Laboratory test can confirm if different
etymological agents are really active in different
geographical area.
In the current study no covariates like age, sex, socio
economy etc was considered while modeling.
Incorporation of such covariates can give us more
robust information helpful for preventive measures and
policy formation.
Overlapping of the hot spots of water borne diseases
and water based vector borne disease proves that slums
are having common risk factors which are mainly
mediated by poor environmental sanitation and socio
economic condition.
In conclusion water borne diseases like diarrhea and
dysentery and water based vector borne diseases like
malaria; fileriosis etc. have special and spatiotemporal
clusters. With proper data the seasonal nature of the
outbreaks can be identified and prevention and control
measures can be designed.
Limitation
The prime limiting factor of this current study was
availability and quality of data. Since it was difficult to
extract slum specific data from the existing surveillance
system case dada was obtained from OPD registers of
urban slums health centers. While the study was
undertaken most of the centers were only two years old
in their operation. However such study demands data of
comparatively longer periods for trend analysis.
Data quality was another constraint and several
adjustments had to make. Still some bias like chances of
over reporting or under reporting cannot be ruled out.
The study lacks in comprehensiveness as it was confined
only in HUP intervention areas.
Another limitation of this current study lies in the
nature of circular scan statistics, which does not allow
for irregular geographic shapes.
As there is no consensus and optimal maximum- size of
the spatial cluster size setting in current study
recommended value of 50% of the population at risk in
scanning window was used to avoid pre-selection bias.
However bigger clusters often identifies area with
comparatively lower relative risk. But from policy
makers point of view identification of those clusters are
essential than the smaller clusters with elevated risks.
Proximity of health center or disperse community can
be another confounding factor in terms of case
13. 13
reporting. To keep the study simple no further
adjustment were made.
Acknowledgement
We would like to thanks all the HUP partner NGOs
managing urban slum health centers in collaboration
with NRHM and Bhubaneswar Municipal Corporation,
for sharing their OPD registers of two consecutive years.
Dr. Dinabandhu Sahoo, Joint Director NUHM( Tech) and
former Chief Municipal Medical Municipal Officer
deserves special thanks as without his instigation this
study would not have been materialized. We would
also like to thank Mr. Ratikanta Behera who with his
team did the most tedious part of the study by
screening case by case form OPD register and made the
essential database for this study.
References
1. Kulldorff. M(2013), SatScanTM
User Guide,
Information Management Services, USA
2. Kulldorff. M(1997), A Spatial Scan Statistics.
Commun Statistics-Theory Meth USA. Vol 26, No- 6,
pp-1481-1496
3. Kulldorff. M(1999), Scan Statistics and Applications,
Birkhäuser , Boston
4. Flanders W.D et al (1995). Basic Models for Diseases
Occurrence in Epidemiology. International Journal
of Epidemiology. UK Vol 24, No 1, pp1-3
5. Xie. Y et al (2014) Spatiotemporal Clustering of
Hand, Foot and Mouth Diseases at County Level in
Gangxi , China. Plos one. Vol 9,
6. Chen. J et al. Visula Analysis of Spatial Scan Statistics
Results. Pennsylvania State University
7. Swmyanarayan. T et al(2008). Investigation of a
Hepatitis A outbreak in Children in an Urban Slums
in Vellore, Tamil Nadu, using Geographic
Information System. Indian Journal of Medicine.
Volume 128( July), No-1, pp-32-37
8. Takahashi K et al (2008) .A Flexible Shaped Space
Time Scan Statistics for Diseases Outbreak detection
and Monitoring. International Journal of Health
Geography. Vol- 7 (April), No-14
9. Wu S et al( 2012). Incidence Analysis and Space
time Cluster Detection of Hepatitis C in Fujian
Province of China from 2006 to 2010. Plos one Vol
7(7):c40872, doc 10.1371/ journal.pone.0040872
10. Ali et al (2012). A Spatial and Temporal Analysis of
Notifiable Gastrointestinal illness in the North West
Territories of Canada, 1991-2008. International
Journal for Helath Geography 11:17 http:// www.ij
healthgeography/content/11/1/17
11. Odoi A et al (2004), Investigation of Clusters of
Giardiasis using GIS and Spatial Scan statistics.
International Journal of Health Geography. Vol:3
(June), No-11
12. Ogbonna J. U (2012), Epidemiological GIS:
Understanding Emerging Critical Issues. American
Journal of Geographic Information System. Vol 1,
No-2, pp :29-32
13. Fobil. J.N et al (2012), Mapping Urban Malaria and
Diarrhea Mortality in Accra, Ghana: Evidence of
Vulnerabilities and Implication for urban health
policies. Journal of Urban Health: Bulletin of the
New York Academy of Medicine. Vol 89 (December),
No- 6