More Related Content
More from Thomas Jézéquel
More from Thomas Jézéquel (20)
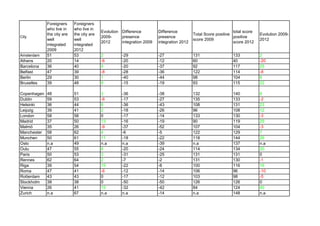
Table eurobarometer
- 1. City
Foreigners
who live in
the city are
well
integrated
2009
Foreigners
who live in
the city are
well
integrated
2012
Evolution
2009-
2012
Difference
presence
integration 2009
Difference
presence
integration 2012
Total Score positive
score 2009
total score
positive
score 2012
Evolution 2009-
2012
Amsterdam 51 53 2 -29 -27 131 133 2
Athens 20 14 -6 -20 -12 60 40 -20
Barcelona 36 40 4 -20 -37 92 117 25
Belfast 47 39 -8 -28 -36 122 114 -8
Berlin 29 30 1 -40 -44 98 104 6
Bruxelles 39 48 9 -15 -19 93 115 22
Copenhagen 48 51 3 -36 -38 132 140 8
Dublin 59 53 -6 -17 -27 135 133 -2
Helsinki 36 44 8 -36 -43 108 131 23
Leipzig 39 41 2 -18 -26 96 108 12
London 58 58 0 -17 -14 133 130 -3
Madrid 37 50 13 -16 -19 90 119 29
Malmö 35 26 -9 -37 -52 107 104 -3
Manchester 58 62 4 -6 -5 122 129 7
Munchen 50 61 11 -18 -22 118 144 26
Oslo n.a 49 n.a n.a -39 n.a 137 n.a
Oulu 47 55 8 -20 -24 114 134 20
Paris 50 53 3 -31 -25 131 131 0
Rennes 62 64 2 -7 -2 131 130 -1
Riga 39 54 15 -22 -8 100 116 16
Roma 47 41 -6 -12 -14 106 96 -10
Rotterdam 43 43 0 -17 -12 103 98 -5
Stockholm 38 38 0 -50 -50 126 126 0
Vienna 26 41 15 -32 -42 84 124 40
Zurich n.a 67 n.a n.a -14 n.a 148 n.a