2019 SOCCSKSARGEN Annual Regional Economic Situationer
•
1 like•448 views

2019 SOCCSKSARGEN Annual Regional Economic Situationer

Recommended
Recommended
More Related Content
What's hot
What's hot (20)
Similar to 2019 SOCCSKSARGEN Annual Regional Economic Situationer
Similar to 2019 SOCCSKSARGEN Annual Regional Economic Situationer (20)
More from National Economic and Development Authority XII
More from National Economic and Development Authority XII (17)
Recently uploaded
Recently uploaded (20)
2019 SOCCSKSARGEN Annual Regional Economic Situationer
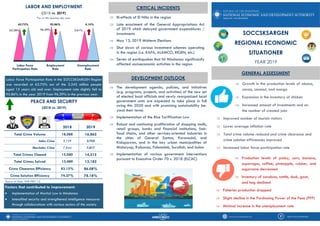
- 1. GENERAL ASSESSMENT Growth in the production levels of abaca, cacao, coconut, and mango Expansion in the inventory of chicken Increased amount of investments and on the number of created jobs Improved number of tourists visitors Lower average inflation rate Total crime volume reduced and crime clearance and crime solution efficiencies improved Increased labor force participation rate PEACE AND SECURITY (2018 vs. 2019) 2018 2019 Total Crime Volume 18,088 16,862 Index Crime 3,129 2,704 Non-Index Crime 7,844 7,817 Total Crimes Cleared 15,040 14,515 Total Crimes Solved 13,489 13,182 Crime Clearance Efficiency 83.15% 86.08% Crime Solution Efficiency 74.57% 78.18% Source of Data: PNP-PRO 12 Factors that contributed to improvement: Implementation of Martial Law in Mindanao Intensified security and strengthened intelligence measures through collaborations with various sectors of the society The development agenda, policies, and initiatives (e.g. programs, projects, and activities) of the new set of elected local officials and newly reorganized local government units are expected to take place in full swing this 2020 and with promising sustainability be- yond their terms Implementation of the Rice Tariffication Law Robust and continuing proliferation of shopping malls, retail groups, banks and financial institutions, fast- food chains, and other services-oriented industries in the cities of General Santos, Koronadal, and Kidapawan, and in the key urban municipalities of Midsayap, Kabacan, Polomolok, Surallah, and Isulan Implementation of various government interventions pursuant to Executive Order 70 s. 2018 (ELCAC) Ill-effects of El Niño in the region Late enactment of the General Appropriations Act of 2019 which delayed government expenditures / investments May 13, 2019 Midterm Elections Shut down of various investment schemes operating in the region (i.e. KAPA, ALAMCO, RIGEN, etc.) Series of earthquakes that hit Mindanao significantly affected socioeconomic activities in the region CRITICAL INCIDENTS DEVELOPMENT OUTLOOK LABOR AND EMPLOYMENT (2018 vs. 2019) Labor Force Participation Rate in the SOCCSKSARGEN Region was recorded at 62.75% out of the 3.243 million people aged 15 years old and over. Employment rate slightly fell to 95.86% in the year 2019 from 96.39% in the previous year. www.nro12.neda.gov.ph NEDA SOCCSKSARGEN Labor Force Participation Rate Employment Rate Unemployment Rate 62.28% 62.75% 96.39% 95.86% 3.61% 4.14% Production levels of palay, corn, banana, asparagus, coffee, pineapple, rubber, and sugarcane decreased Inventory of carabao, cattle, duck, goat, and hog declined Fisheries production dropped Slight decline in the Purchasing Power of the Peso (PPP) Minimal increase in the unemployment rate *as of 4th Quarter the year SOCCSKSARGEN REGIONAL ECONOMIC SITUATIONER YEAR 2019
- 2. Source of Data: PSA XII REGIONAL ECONOMIC PERFORMANCE AGRICULTURE AND FISHERY INDICATORS INVESTMENTS Source of Data: PSA XII Source of Data: PSA XII Source of Data: DOT XII The region experienced high demand for poultry and livestock products in 2019, especially during campaign and election peri- ods, thanksgiving celebra- tions, and during the inaugu- ration of LGU officials. These factors contributed to the reduction of their inven- tory in the said year. Cattle Goat Carabao Chicken Duck Hog The dry spell during the 1st semester of 2019 led to the decrease in the production of palay and corn. Shifting of crops from one to other varieties and types contributed to the decline of production of some crops while increase in the others. The over-all production in the region decreased in 2019. The notable increase in aquaculture was brought by the expansion of tilapia culture due to its high demand and better survivability of fingerlings. Although there were no recorded BOI-approved invest- ments in the second quarter of the year, SOCCSKSARGEN had nearly PhP 6.818 Billion worth of investments in 2019. This was 64.53% higher than in 2018. Further, these invest- ments led to the creation of a total of 1,884 jobs for the people of the region. In 2019, tourist arrivals in the region hit a 7.51% growth from 2018. Sarangani was the most visited place with 1,593,262 recorded visitors while the number of tourists in Koronadal City rocketed by 169.50%. Prices for all items in SOCCSKSARGEN Region posted an average inflation rate of 2.80% for 2019 as compared to 6.20% in 2018. www.nro12.neda.gov.ph NEDA SOCCSKSARGEN Palay 1,187,279.31 MT 2018 2019 PRODUCTION 2018 2019 Change TOTAL 326,318.5 320,900.07 (1.66%) Commercial 282,227.08 279,688.65 (0.90%) Municipal Inland 19,676.84 14,813.21 (24.72%) Municipal Marine 11,547.66 10,533.46 (8.78%) Aquaculture 12,866.92 15,864.75 23.30% 1,343,124.70 MT Corn Abaca 1,231,074.00 MT 1,165.16 MT 1,114.65 MT Banana 1,108,187.29 MT 1,182,437.58 MT 1,198,233.25 MT Asparagus 1,341.51 MT 1,715.92 MT Cacao 189.59 MT 157.01 MT Coconut 1,181,792.57 MT 1,103,984.88 MT Coffee 20,560.10 MT 22,046.16 MT Mango 59,994.46 MT 52,961.59 MT Pineapple 804,892.66 MT 805,254.30 MT Rubber 152,724.49 MT 153,677.73 MT Sugarcane 535,317.11 MT 630,070.11 MT 199,895 204,776 194,065 197,911 9,674,996 9,447,492 1,453,793 1,567,675 219,005 225,469 800,434 816,580 (2018 vs. 2019) INVESTMENT* 2018 2019 4,143.66 M 6,817.70 M JOBS GENERATED 2018 2019 583 1,884 TOURISM *Note: Excluding Cotabato City following its transfer to BARMM TOURIST ARRIVALS* 2018 2019 6,217,660 6,684,873 (2018 vs. 2019) Most Visited: SARANGANI Most Improved: KORONADAL CITY * Only investments reported by DTI-BOISource of Data: DTI-Board of Investments PURCHASING POWER OF PESO (2018 vs. 2019) 2018 2019 0.83 0.81 Source of Data: PSA XII (2018 vs. 2019) The average PPP in the region slightly dropped to 0.81 in 2019 from 0.83 in 2018, based on 2012 constant prices. INFLATION RATES Restaurant and Miscellaneous Goods and Services Health Alcoholic beverages and tobacco Furnishing, Household Equipment and Routine Maintenance of the House Recreation and culture Clothing and footwear Housing, Water, Electricity, Gas and Other FuelsTransport Food and Non- Alcoholic Beverages Communication Education 1,165.16 MT 1,114.65 MT 14.50 21.80 (2018 vs. 2019) 1.50 1.10 4.90 1.60 1.60 -1.80 0.80 6.90 6.40 4.90 3.80 2.40 2.50 5.80 6.70 2.90 5.00 5.20 2.90 5.90