
Recommended
More Related Content
What's hot
What's hot (8)
Viewers also liked
Similar to myDIALS v3.0 Data Sheet
Similar to myDIALS v3.0 Data Sheet (20)
myDIALS v3.0 Data Sheet
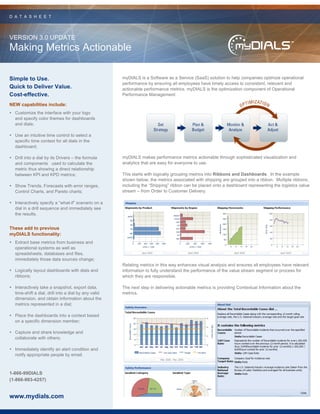
- 1. D A T A S H E E T VERSION 3.0 UPDATE Making Metrics Actionable Simple to Use. myDIALS is a Software as a Service (SaaS) solution to help companies optimize operational performance by ensuring all employees have timely access to consistent, relevant and Quick to Deliver Value. actionable performance metrics. myDIALS is the optimization component of Operational Cost-effective. Performance Management: NEW capabilities include: • Customize the interface with your logo and specify color themes for dashboards and dials; • Use an intuitive time control to select a specific time context for all dials in the dashboard; • Drill into a dial by its Drivers – the formula myDIALS makes performance metrics actionable through sophisticated visualization and and components used to calculate the analytics that are easy for everyone to use. metric thus showing a direct relationship between KPI and KPD metrics; This starts with logically grouping metrics into Ribbons and Dashboards. In the example shown below, the metrics associated with shipping are grouped into a ribbon. Multiple ribbons, • Show Trends, Forecasts with error ranges, including the “Shipping” ribbon can be placed onto a dashboard representing the logistics value Control Charts, and Pareto charts; stream – from Order to Customer Delivery. • Interactively specify a “what-if” scenario on a dial in a drill sequence and immediately see the results. These add to previous myDIALS functionality: • Extract base metrics from business and operational systems as well as spreadsheets, databases and files, immediately those data sources change; Relating metrics in this way enhances visual analysis and ensures all employees have relevant • Logically layout dashboards with dials and information to fully understand the performance of the value stream segment or process for ribbons; which they are responsible. • Interactively take a snapshot, export data, The next step in delivering actionable metrics is providing Contextual Information about the time-shift a dial, drill into a dial by any valid metrics. dimension, and obtain information about the metrics represented in a dial; • Place the dashboards into a context based on a specific dimension member; • Capture and share knowledge and collaborate with others; • Immediately identify an alert condition and notify appropriate people by email. 1-866-99DIALS (1-866-993-4257) www.mydials.com
- 2. ATASHEET D VERSION 3.0 UPDATE Making Metrics Actionable Effective Performance Metrics are: The example above shows Embedded Knowledge about the metric definitions, how they are calculated and how they can be interpreted. This can also contain links to any web-based • Related to strategic goals; information. The information helps ensure each person in the organization has a consistent understanding of the metrics and how they should be used. • Timely; The next level of context is to ensure that as people “drill into” the metrics to obtain additional • Individualized and relevant for each detail, they retain the perspective of the original information and the path taken to the more decision maker; detailed information. When drilling, the user is presented with valid dimensions based on the specific dial they select. Below is an example of a multi-level “Drill-tree”. • Consistent and accurate; • Span a value stream or business process; • Support a continuous improvement methodology. Performance Metrics can be: • Key Performance Indicators (KPIs) or outcomes; • Key Performance Drivers (KPDs) that affect outcomes or are leading indicators that point to potential outcomes. Performance Metrics are made actionable by: • Directly relating KPI and KPD metrics; • Logically grouping KPI and KPD metrics by value stream, business process or function; • Providing the capability to drill into metrics or obtain more detail; • Showing metric snapshots, trends over time, and period over period comparisons; • Presenting the metrics in context - either by dimension or time; Without closing the drill-tree, the user can change the navigation path by selecting a different dial at any level in the tree or selecting a different dimension to use for more detail. In this way • Capturing user knowledge about the metrics the person making a decision can quickly navigate to the root cause of a performance issue and related analysis; and obtain sufficient information to make an informed decision. Another level of providing Context is to relate all dials in a dashboard to a specific dimension member as shown below. • Using trends, forecasts, Pareto and control charts to determine the characteristics of an issue; • Performing “what-if” analysis to determine the most appropriate scenario or action to take.
- 3. D A T A S H E E T VERSION 3.0 UPDATE Making Metrics Actionable myDIALS Version 3.0 enhances context setting by allowing a user to set the Time-period Context for all dials on the dashboard. This intuitive control, as shown below, provides the ability to “zoom in” or “zoom out” in the time hierarchy, for example to move from months to weeks or days; or to move from months to quarters or years. The user can also easily select a specific time period of interest, for example May of 2009. Using myDIALS to Cement a Culture For Safety on the Production Site Adelaide Brighton Cement is one of the leading providers of cement to the Australian myDIALS 3.0 also provides the ability to drill into a dial to determine its underlying Performance construction, engineering and infrastructure Drivers. Many KPI metrics, which represent outcomes, are calculated from core metrics. For actionable information, a decision maker needs to know how the KPI was calculated and the industries. Its employees operate in a status of the underlying metrics, since these tend to be Key Performance Drivers or KPD production environment defined by heavy metrics and hence are more actionable. machinery and high temperatures – a combination that could easily prove risky As can be seen below, myDIALS uses the contextual drill-tree to expand a dial by drivers and without thorough safety measures. provides the expression as well as the underlying metrics. Vince Aurora, Plant Manager, was tasked with ensuring a high safety record which began with analyzing appropriate data. “We needed to be able to visualize the data that was being reported, but we certainly didn't want a complete ERP software implementation,” Aurora explains. “We wanted a solution that was innovative but also quick to install with low risk.” “The important thing with myDIALS,” Aurora continues, “was that it would display and provide drill-down access to information from the systems that we already had.” Since deployment, hazard identification doubled while incident reporting improved by seventy percent. A new cross-functional weekly OH&S review meeting has been instituted to help manage the increase in reports and to ensure follow-up action where required. The supervisors who attend these meetings are Just as when drilling by a dimension, it is possible to continue to expand the drill-tree by leading the plant's drive to improve safety and selecting another dial, and expanding either by a relevant dimension or by that dial’s drivers. eliminate hazards. For example, the user could select the Availability dial above and drill into it by the drivers to see components that make up availability – such as scheduled and unscheduled downtime as a Aurora points out, “We could only get to this factor of available time during the period. level once we started to get reliable, real time information.” Optimizing operational performance also entails identifying issues that are limiting performance and taking actions to correct the problem. In many cases there may be more than one action that could be taken and it can be difficult to determine the most appropriate action to achieve the optimal result.
- 4. D A T A S H E E T VERSION 3.0 UPDATE Making Metrics Actionable myDIALS makes sophisticated analytics easy NEW ANALYTIC CAPABILITIES: to use for all employees. Once a performance issue has been identified, the optimal corrective myDIALS 3.0 features sophisticated analytic capabilities suitable for use by all employees. action must be determined. Rather than wait The first component of the optional Analytics Module is interactive “What-if” scenario analysis. for a review by a business analyst, each person While analyzing current performance by drilling into a dial and expanding by a dimension or by making an operational decision can now obtain drivers, the decision maker can now specify a scenario to analyze. Immediately, myDIALS will the information they need to make those show the resulting “roll-up” of that scenario within the active drill-tree. decisions quickly and effectively. This is very powerful for asking simple questions, for example: Examining trends, forecasts and controls charts • If our plant in Germany could deliver more production what would the overall production can quickly show whether an issue is an level be? abnormality or an ongoing problem. A Pareto • If our office in Los Angeles could sell more baseballs, what would the resultant product chart can highlight areas contributing most to sales mix for the USA be? the problem. And performing “what if” scenario By combining the scenario analysis with the ability to drill into drivers, more complex analysis shows which actions will lead to the questions can be asked, such as: best business outcome. • What would be the impact on gross margin if we changed product mix? Combining this level of analytics with the ease- • If we were able to reduce turnaround time what is the impact on OEE? of-use inherent in myDIALS ensures everyone As can be seen below, asking one of these questions is as simple as selecting a dial in a drill can take advantage of analyses that until now tree, highlighting a bar, segment or point of interest, and then specifying a new value for that has typically been reserved for a small number metric for that time period. of business analysts. myDIALS 3.0 takes operational performance management to a new level by focusing on optimization. The intuitive visual presentation, interactive drills, embedded knowledge, context setting, inherent association of KPI and KPD metrics, interactive scenario analysis and sophisticated analytics allow you to quickly understand performance, identify the root cause of performance issues and determine the best corrective action. Scenarios can also be run on multiple points at once including future values. Other components of the Analytics Module are sophisticated mathematical charting capabilities such as Trend lines based on a number of different algorithms, Forecast Projections with error ranges, Control Charts and Pareto Charts. 1-866-99DIALS (1-866-993-4257) www.mydials.com These help decision makers at all levels to understand the nature of a performance issue such