Junnasandra Call Girls: 🍓 7737669865 🍓 High Profile Model Escorts | Bangalore...
Model
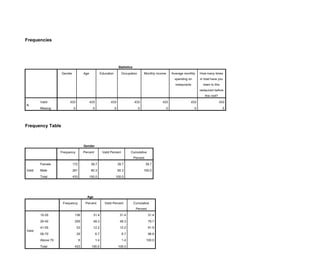
1. Frequencies
Statistics
Gender Age Education Occupation Monthly income Average monthly
spending on
restaurants
How many times
in total have you
been to this
restaurant before
this visit?
N
Valid 433 433 433 433 433 433 433
Missing 0 0 0 0 0 0 0
Frequency Table
Gender
Frequency Percent Valid Percent Cumulative
Percent
Valid
Female 172 39.7 39.7 39.7
Male 261 60.3 60.3 100.0
Total 433 100.0 100.0
Age
Frequency Percent Valid Percent Cumulative
Percent
Valid
10-25 136 31.4 31.4 31.4
26-40 209 48.3 48.3 79.7
41-55 53 12.2 12.2 91.9
56-70 29 6.7 6.7 98.6
Above 70 6 1.4 1.4 100.0
Total 433 100.0 100.0
2. Education
Frequency Percent Valid Percent Cumulative
Percent
Valid
High School 41 9.5 9.5 9.5
Intermediate 64 14.8 14.8 24.2
Bachelor 115 26.6 26.6 50.8
Master 131 30.3 30.3 81.1
MS and Above 82 18.9 18.9 100.0
Total 433 100.0 100.0
Occupation
Frequency Percent Valid Percent Cumulative
Percent
Valid
Empoyee (Public) 57 13.2 13.2 13.2
Employee (Private) 124 28.6 28.6 41.8
Own Business 80 18.5 18.5 60.3
Student 108 24.9 24.9 85.2
Other 64 14.8 14.8 100.0
Total 433 100.0 100.0
Monthly income
Frequency Percent Valid Percent Cumulative
Percent
Valid
Below 20,000 127 29.3 29.3 29.3
20,000 - 30,000 94 21.7 21.7 51.0
30,001 - 60,000 111 25.6 25.6 76.7
60,001 - 100,000 50 11.5 11.5 88.2
Above 100,000 51 11.8 11.8 100.0
Total 433 100.0 100.0
3. Average monthly spending on restaurants
Frequency Percent Valid Percent Cumulative
Percent
Valid
Below 3000 135 31.2 31.2 31.2
3000 - 6000 200 46.2 46.2 77.4
6001 - 9000 67 15.5 15.5 92.8
9001 - 12000 17 3.9 3.9 96.8
Above 12000 14 3.2 3.2 100.0
Total 433 100.0 100.0
How many times in total have you been to this restaurant before this visit?
Frequency Percent Valid Percent Cumulative
Percent
Valid
1-5 257 59.4 59.4 59.4
6-10 82 18.9 18.9 78.3
11-15 60 13.9 13.9 92.1
16-20 19 4.4 4.4 96.5
Above 20 15 3.5 3.5 100.0
Total 433 100.0 100.0
Histogram
4.
5.
6.
7.
8.
9. matrix.
get dat/file = */variables = RIc FQc CSc
/names = vnames/missing = 9999.
compute ninit = nrow(dat).
get dat/file = */variables = RIc FQc CSc
/names = vnames/missing = omit.
get tmp/file = */variables = RIc /names =
yname/missing = omit.
get tmp2/file = */variables = FQc /names =
xname/missing = omit.
get tmp/file = */variables = CSc /names =
mnames/missing = omit.
get tmp/file = */variables = w999999t
z999999t v999999t q999999t.
compute wname=tmp(1,1).
do if (wname = ' ').
compute wname = 'xxx'.
end if.
compute zname=tmp(1,2).
do if (zname = ' ').
compute zname = 'xxx'.
end if.
compute vname=tmp(1,3).
do if (vname = ' ').
compute vname = 'xxx'.
end if.
compute qname=tmp(1,4).
do if (qname= ' ').
compute qname = 'xxx'.
end if.
compute n = nrow(dat).
compute p0=-.322232431088.
compute p1 = -1.
compute p2 = -.342242088547.
compute p3 = -.0204231210245.
compute p4 = -.0000453642210148.
compute q0 = .0993484626060.
compute q1 = .588581570495.
compute q2 = .531103462366.
compute q3 = .103537752850.
compute q4 = .0038560700634.
compute badend = 0.
compute priorlo = -9999999.
compute priorhi = 9999999.
compute criterr = 0.
10. Resources
Processor Time 00:00:03.64
Elapsed Time 00:00:03.72
[DataSet1] C:UsersRajaDocumentsThesisData AnalysisZohaibZohaib.sav
Run MATRIX procedure:
************* PROCESS Procedure for SPSS Release 2.16.1 ******************
Written by Andrew F. Hayes, Ph.D. www.afhayes.com
Documentation available in Hayes (2013). www.guilford.com/p/hayes3
**************************************************************************
Model = 4
Y = RIc
X = FQc
M = CSc
Sample size
433
**************************************************************************
Outcome: CSc
Model Summary
R R-sq MSE F df1 df2 p
.7551 .5702 .2610 571.8933 1.0000 431.0000 .0000
Model
coeff se t p LLCI ULCI
constant .3177 .1480 2.1464 .0324 .0268 .6086
FQc .8849 .0370 23.9143 .0000 .8122 .9576
**************************************************************************
Outcome: RIc
Model Summary
R R-sq MSE F df1 df2 p
.7980 .6368 .2693 376.9369 2.0000 430.0000 .0000
Model
coeff se t p LLCI ULCI
constant .0601 .1512 .3974 .6913 -.2370 .3572
CSc .6458 .0489 13.1996 .0000 .5497 .7420
FQc .3334 .0573 5.8155 .0000 .2207 .4461
******************** DIRECT AND INDIRECT EFFECTS *************************
Direct effect of X on Y
Effect SE t p LLCI ULCI
.3334 .0573 5.8155 .0000 .2207 .4461
11. Indirect effect of X on Y
Effect Boot SE BootLLCI BootULCI
CSc .5715 .0549 .4714 .6868
******************** ANALYSIS NOTES AND WARNINGS *************************
Number of bootstrap samples for bias corrected bootstrap confidence intervals:
5000
Level of confidence for all confidence intervals in output:
95.00
------ END MATRIX -----
restore.
/* PROCESS for SPSS 2.16.1 */.
/* Written by Andrew F. Hayes */.
/* www.afhayes.com */.
/* Copyright 2012-2016 */.
/* Online distribution other than through */.
/* www.afhayes.com or processmacro.org is not authorized */.
/* Please read the documentation */.
/* available in Appendix A of */.
/* Hayes (2013) prior to use */.
/* www.guilford.com/p/hayes3 */.
/* Documentation available in Appendix A of http://www.guilford.com/p/hayes3 */.
preserve.
set printback=off.
Matrix
[DataSet1] C:UsersRajaDocumentsThesisData AnalysisZohaibZohaib.sav
Run MATRIX procedure:
************* PROCESS Procedure for SPSS Release 2.16.1 ******************
Written by Andrew F. Hayes, Ph.D. www.afhayes.com
Documentation available in Hayes (2013). www.guilford.com/p/hayes3
**************************************************************************
Model = 4
Y = RIc
X = RSQc
12. M = CSc
Sample size
433
**************************************************************************
Outcome: CSc
Model Summary
R R-sq MSE F df1 df2 p
.7142 .5100 .2976 448.6406 1.0000 431.0000 .0000
Model
coeff se t p LLCI ULCI
constant .7262 .1479 4.9113 .0000 .4356 1.0168
RSQc .8106 .0383 21.1811 .0000 .7354 .8859
**************************************************************************
Outcome: RIc
Model Summary
R R-sq MSE F df1 df2 p
.8047 .6476 .2613 395.1110 2.0000 430.0000 .0000
Model
coeff se t p LLCI ULCI
constant .0577 .1424 .4050 .6857 -.2222 .3375
CSc .6372 .0451 14.1184 .0000 .5485 .7260
RSQc .3552 .0512 6.9325 .0000 .2545 .4559
******************** DIRECT AND INDIRECT EFFECTS *************************
Direct effect of X on Y
Effect SE t p LLCI ULCI
.3552 .0512 6.9325 .0000 .2545 .4559
Indirect effect of X on Y
Effect Boot SE BootLLCI BootULCI
CSc .5166 .0444 .4309 .6036
******************** ANALYSIS NOTES AND WARNINGS *************************
Number of bootstrap samples for bias corrected bootstrap confidence intervals:
5000
Level of confidence for all confidence intervals in output:
95.00
------ END MATRIX -----
restore.
/* PROCESS for SPSS 2.16.1 */.
/* Written by Andrew F. Hayes */.
/* www.afhayes.com */.
/* Copyright 2012-2016 */.
13. /* Online distribution other than through */.
/* www.afhayes.com or processmacro.org is not authorized */.
/* Please read the documentation */.
/* available in Appendix A of */.
/* Hayes (2013) prior to use */.
/* www.guilford.com/p/hayes3 */.
/* Documentation available in Appendix A of http://www.guilford.com/p/hayes3 */.
preserve.
set printback=off.
Matrix
[DataSet1] C:UsersRajaDocumentsThesisData AnalysisZohaibZohaib.sav
Run MATRIX procedure:
************* PROCESS Procedure for SPSS Release 2.16.1 ******************
Written by Andrew F. Hayes, Ph.D. www.afhayes.com
Documentation available in Hayes (2013). www.guilford.com/p/hayes3
**************************************************************************
Model = 4
Y = RIc
X = PEQc
M = CSc
Sample size
433
**************************************************************************
Outcome: CSc
Model Summary
R R-sq MSE F df1 df2 p
.6097 .3718 .3815 255.0563 1.0000 431.0000 .0000
Model
coeff se t p LLCI ULCI
constant 1.5287 .1458 10.4853 .0000 1.2421 1.8152
PEQc .6178 .0387 15.9705 .0000 .5418 .6939
**************************************************************************
Outcome: RIc
14. Model Summary
R R-sq MSE F df1 df2 p
.8040 .6464 .2622 393.0015 2.0000 430.0000 .0000
Model
coeff se t p LLCI ULCI
constant .1717 .1354 1.2681 .2055 -.0944 .4378
CSc .6948 .0399 17.4017 .0000 .6164 .7733
PEQc .2756 .0405 6.8123 .0000 .1961 .3552
******************** DIRECT AND INDIRECT EFFECTS *************************
Direct effect of X on Y
Effect SE t p LLCI ULCI
.2756 .0405 6.8123 .0000 .1961 .3552
Indirect effect of X on Y
Effect Boot SE BootLLCI BootULCI
CSc .4293 .0368 .3607 .5024
******************** ANALYSIS NOTES AND WARNINGS *************************
Number of bootstrap samples for bias corrected bootstrap confidence intervals:
5000
Level of confidence for all confidence intervals in output:
95.00
------ END MATRIX -----
restore.