Top profile Call Girls In Varanasi [ 7014168258 ] Call Me For Genuine Models ...
Bk6profile
1. 10
1
3
2
6
5
1
11 9
5
6
42
31
9
7
8
5
3
42
1
6
2
1
4
ATLANTIC AVE.
COURTST.
WARREN ST.
4thAVE.
PACIFIC ST.
FLATBUSHAVE.
PROSPECTPK.W
EST
15th
ST.
EAST RIVER
COLUMBIAST.
GOWANUS CREEK
UPPER
NEW YORK
BAY RED
HOOK
GOWANUS
PARK
SLOPE
CARROLLGARDENS
COBBLEHILL
15
10
12
16
17
14
18
11
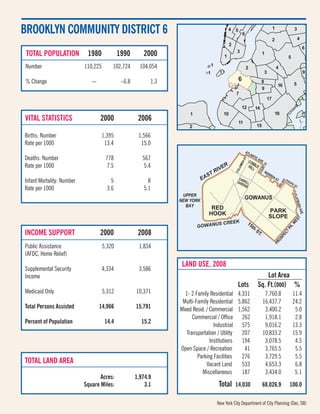
BROOKLYN COMMUNITY DISTRICT 6
TOTAL POPULATION 1980 1990 2000
110,225 102,724 104,054
- -6.8 1.3
Number
% Change
VITAL STATISTICS 2000 2006
Births: Number
Rate per 1000
Deaths: Number
Rate per 1000
Infant Mortality: Number
Rate per 1000
INCOME SUPPORT 2000 2008
Public Assistance
(AFDC, Home Relief)
Supplemental Security
Income
Medicaid Only
Total Persons Assisted
Percent of Population
TOTAL LAND AREA
Acres:
Square Miles:
1- 2 Family Residential
Multi-Family Residential
Mixed Resid. / Commercial
Commercial / Office
Industrial
Transportation / Utility
Institutions
Open Space / Recreation
Parking Facilities
Vacant Land
Miscellaneous
Total
LAND USE, 2008
Lot Area
Sq. Ft.(000) %Lots
New York City Department of City Planning (Dec.
,
08)
1,974.9
3.1
5,320 1,834
4,334 3,586
5,312 10,371
14,966 15,791
14.4 15.2
1,395 1,566
13.4 15.0
778 567
7.5 5.4
5 8
3.6 5.1
4,331 7,760.8 11.4
5,862 16,437.7 24.2
1,562 3,400.2 5.0
262 1,918.1 2.8
575 9,016.2 13.3
207 10,833.2 15.9
194 3,078.5 4.5
41 3,765.5 5.5
276 3,729.5 5.5
533 4,653.3 6.8
187 3,434.0 5.1
14,030 68,026.9 100.0
2. Table PL P-103: Total Population by Mutually Exclusive Race and Hispanic Origin
New York City Community Districts, 1990 and 2000
and Total Housing Units
1990 2000 Change 1990-2000
Brooklyn Community District 6 Number Percent Number Percent Number Percent
Total Population 102,724 100.0 104,054 100.0 1,330 1.3
Nonhispanic of Single Race: - - - - - -
White Nonhispanic 56,266 54.8 57,106 54.9 840 1.5
Black/African American Nonhispanic 16,342 15.9 14,034 13.5 (2,308) -14.1
Asian or Pacific Islander Nonhispanic 3,326 3.2 4,622 4.4 1,296 39.0
American Indian and Alaska Native Nonhispanic 257 0.3 173 0.2 (84) -32.7
Some Other Race Nonhispanic 266 0.3 493 0.5 227 85.3
Nonhispanic of Two or More Races - - 3,274 3.1 - -
Hispanic Origin 26,267 25.6 24,352 23.4 (1,915) -7.3
Population Under 18 Years 20,769 100.0 20,345 100.0 (424) -2.0
Nonhispanic of Single Race: - - - - - -
White Nonhispanic 7,562 36.4 7,982 39.2 420 5.6
Black/African American Nonhispanic 4,652 22.4 3,844 18.9 (808) -17.4
Asian or Pacific Islander Nonhispanic 653 3.1 683 3.4 30 4.6
American Indian and Alaska Native Nonhispanic 55 0.3 41 0.2 (14) -25.5
Some Other Race Nonhispanic 108 0.5 134 0.7 26 24.1
Nonhispanic of Two or More Races - - 869 4.3 - -
Hispanic Origin 7,739 37.3 6,792 33.4 (947) -12.2
Population 18 Years and Over 81,955 100.0 83,709 100.0 1,754 2.1
Nonhispanic of Single Race: - - - - - -
White Nonhispanic 48,704 59.4 49,124 58.7 420 0.9
Black/African American Nonhispanic 11,690 14.3 10,190 12.2 (1,500) -12.8
Asian or Pacific Islander Nonhispanic 2,673 3.3 3,939 4.7 1,266 47.4
American Indian and Alaska Native Nonhispanic 202 0.2 132 0.2 (70) -34.7
Some Other Race Nonhispanic 158 0.2 359 0.4 201 127.2
Nonhispanic of Two or More Races - - 2,405 2.9 - -
Hispanic Origin 18,528 22.6 17,560 21.0 (968) -5.2
Total Population 102,724 100.0 104,054 100.0 1,330 1.3
Under 18 Years 20,769 20.2 20,345 19.6 (424) -2.0
18 Years and Over 81,955 79.8 83,709 80.4 1,754 2.1
Total Housing Units 46,907 - 48,945 - 2,038 4.3
Race categories are from the 2000 Census and are not strictly comparable with categories used in 1990.
Source: U.S. Census Bureau, 2000 Census PL File and SF1 and 1990 Census STF1
Population Division - NYC Department of City Planning (Oct 2001)
3. Demographic Profile - New York City Community Districts
2000 Census SF1
Brooklyn Community District 6 Number Percent
Total Population 104,054 100.0
White Nonhispanic 57,106 54.9
Black Nonhispanic 14,034 13.5
Asian and Pacific Islander Nonhispanic 4,622 4.4
Other Nonhispanic 666 0.6
Two or More Races Nonhispanic 3,274 3.1
Hispanic Origin 24,352 23.4
Female 55,061 52.9
Male 48,993 47.1
Under 5 years 6,130 5.9
5 to 9 years 5,928 5.7
10 to 14 years 5,326 5.1
15 to 19 years 4,612 4.4
20 to 24 years 6,973 6.7
25 to 44 years 44,430 42.7
45 to 64 years 21,461 20.6
65 years and over 9,194 8.8
18 years and over 83,709 80.4
In households 102,903 98.9
In family households 70,574 67.8
Householder 22,864 22.0
Spouse 14,892 14.3
Own child under 18 years 17,678 17.0
Other relatives 12,961 12.5
Nonrelatives 2,179 2.1
In nonfamily households 32,329 31.1
Householder 23,804 22.9
Householder 65 years and over living alone 3,022 2.9
Nonrelatives 8,525 8.2
In group quarters 1,151 1.1
Total Households 46,668 100.0
Family households 22,864 49.0
Married-couple family 14,892 31.9
With related children under 18 years 6,976 14.9
Female householder, no husband present 6,419 13.8
With related children under 18 years 4,115 8.8
Male householder, no wife present 1,553 3.3
With related children under 18 years 648 1.4
Nonfamily households 23,804 51.0
Households with one or more persons 65 years and over 6,990 15.0
Persons Per Family 2.99 -
Persons Per Household 2.21 -
Total Housing Units 48,945 -
Occupied Housing Units 46,668 100.0
Renter occupied 33,860 72.6
Owner occupied 12,808 27.4
By Household Size:
1 person household 16,804 36.0
2 person household 15,640 33.5
3 person household 7,064 15.1
4 person household 4,335 9.3
5 persons and over 2,825 6.1
By Age of Householder:
15 to 24 years 2,228 4.8
25 to 44 years 24,794 53.1
45 to 64 years 13,509 28.9
65 years and over 6,137 13.2
Source: U.S. Census Bureau, 2000 Census SF1 Population Division - NYC Department of City Planning (Dec 2001)
4. VANBRUNTST
DE GRAW ST
WYCKOFF ST
HAMILTONAV
CLINTONST
LORRAINE ST
MILL ST
HENRYST
PRESIDENT ST
HICKSST
KANE ST
COLUMBIAST
ATLANTIC AV
DOUGLASS ST
HOYTST
PIONEER
ST
RICHARDS
ST
W 9 ST
VERONA
ST
STERLING PL
FLATBUSHAV
PROSPECTPARKW
CONOVER
ST
BEARD
ST
COLUMBIAST
HICKSST
5AV
PACIFIC ST
CARROLL ST
COURTST
3AV
GOWANUSCNLSHL
UNION ST
2AV
11 ST
7 ST
4AV
6AV
5 ST
1 ST
IMLAY
ST
WARREN ST
COURTST
15 ST
13 ST
6 ST
9 ST
51
165
67
4947
71
69
85
161
159
157
63
127
65
57
129.02
129.01
77
59
155
153
123
55
3.02
177
141
149
151
167
13
5
3.01
319
1
7
11
21
23
25
27
29.02
29.01
31
33
35
37
39
41
4345
75
101
117
121
125 131
133
135
137
139
143
145
147
163
169
171
179
181
183
185.02
185.01187
CENSUS 2000: BROOKLYN COMMUNITY DISTRICT 6
LEGEND
COMMUNITY DISTRICT
BOUNDARYCENSUS TRACT
BOUNDARY
STREET
CENSUS TRACT
NUMBER4
STREET NAMEREADE ST.
Department of City Planning, New York City
5. Change in Total Population, 1990 to 2000
Brooklyn Community District 6
Population Change, 1990-2000Total Population
PercentNumber20001990Census Tract
(5.6)(17)284301000302 *
5.31743,4443,2700045
102.55671,1205530047
8.42012,5932,3920049
9.31782,0931,9150051
10.7202071870055
6.71021,6311,5290057
(8.3)(99)1,0991,1980059
7.21221,8211,6990063
(0.3)(17)5,1365,1530065
6.52153,5003,2850067
6.62083,3403,1320069 *
(13.3)(705)4,6095,3140071 *
12.44914,4543,9630075
7.62753,9053,6300077
(8.2)(654)7,2787,9320085
22.35092,7882,2790117 *
12.11941,7961,6020121
13.7383152770123 *
23.92391,2401,0010125
17.65103,4052,8950127 *
4.4952,2392,144012901 *
4.1842,1252,041012902 *
0.9353,9943,9590131
8.62893,6673,3780133
(5.9)(177)2,8303,0070135
(5.5)(173)2,9723,1450137
7.22583,8323,5740139
8.42122,7372,5250141 *
(4.4)(219)4,7744,9930149 *
(0.8)(27)3,3903,4170151
(7.7)(247)2,9553,2020153
(1.7)(56)3,3123,3680155
(5.3)(230)4,1434,3730157
3.91905,0914,9010159 *
(6.3)(174)2,5682,7420161 *
(2.8)(138)4,8474,9850165
0.3134,5344,5210167
199.12213321110319*
* Census tract is within two or more community districts. Data are
for entire census tract.
6. Total Population by Mutually Exclusive Race and Hispanic Origin
by Census Tract, 2000
Brooklyn Community District 6
Nonhispanic by Race
Two orSingle Race
Hispanic OriginMoreBlack/ AfricanTotalCensus
(of any race)RacesOtherAsianAmericanWhitePopulationTract
2080712237284000302 *
25611525173672,8083,4440045
352477831614701,1200047
377121113042291,5512,5930049
581103151631331,0982,0930051
80123291012070055
9768019161743661,6310057
6266013131812061,0990059
2701011165541,3201,8210063
581147151431324,1185,1360065
39314014105572,7913,5000067
930171331891801,8373,3400069 *
1,8586621541,9406704,6090071 *
697171421451113,2884,4540075
580192211692232,7203,9050077
3,0845739243,979957,2780085
1,549104251802516792,7880117 *
9127681451345211,7960121
173121181203150123 *
52412212351264211,2400125
1,7635427361,1583673,4050127 *
73983151194927912,239012901 *
4486221784151,1012,125012902 *
1,30684151448881,5573,9940131
821115202063672,1383,6670133
72572161013081,6082,8300135
83971221342291,6772,9720137
1,09686462674621,8753,8320139
1,132165622231719842,7370141 *
1,483154392163672,5154,7740149 *
517142281771792,3473,3900151
26291253301452,1022,9550153
304102221432602,4813,3120155
303101142143143,1974,1430157
416142323106173,5745,0910159 *
474116131326201,2132,5680161 *
282118451952103,9974,8470165
543115311892363,4204,5340167
381161302013320319*
* Census tract is within two or more community districts. Data are
for entire census tract.
7. Total Households by Household Family Type
by Census Tract, 2000
Brooklyn Community District 6
AverageAverageTotalTotal
FamilyHouseholdNon-FamilyFamilyTotalCensus
SizeSizeHouseholdsHouseholdsHouseholdsTract
2.852.304966115000302 *
2.731.979627811,7430045
2.812.212312755060047
2.792.045254669910049
2.882.145014699700051
3.322.354741880055
3.342.682233856080057
3.262.551652554200059
2.752.015004059050063
2.741.991,4181,1652,5830065
2.802.118098531,6620067
3.012.218107011,5110069 *
3.222.675471,1711,7180071 *
2.882.051,1939772,1700075
2.802.011,0688491,9170077
3.282.629301,8472,7770085
3.462.714525781,0300117 *
3.502.613213686890121
3.302.4665611260123 *
3.162.492172564730125
3.392.665357291,2640127 *
3.062.29527451978012901 *
3.092.14635354989012902 *
3.062.239668151,7810131
2.932.198827891,6710133
3.072.296326061,2380135
2.992.276456551,3000137
3.172.467328191,5510139
3.272.604665851,0510141 *
3.102.369811,0091,9900149 *
2.912.207847511,5350151
2.842.117136161,3290153
2.992.158197211,5400155
2.821.951,2718562,1270157
2.731.851,6951,0322,7270159 *
2.942.107095051,2140161 *
2.872.031,2801,0952,3750165
2.832.141,1299872,1160167
2.611.9482791610319*
* Census tract is within two or more community districts. Data are
for entire census tract.
8. Age and Nativity
by Census Tract, 2000
Brooklyn Community District 6
%%%%TotalCensus
Foreign Born65 and over18 to 64under 18PopulationTract
7.46.375.418.328400302 *
15.57.877.814.43,4440045
20.54.776.319.01,1200047
17.324.162.513.42,5930049
25.77.876.116.12,0930051
16.47.267.625.12070055
18.97.560.831.61,6310057
7.65.862.831.41,0990059
22.211.474.813.81,8210063
15.111.974.014.15,1360065
12.29.773.217.13,5000067
17.78.375.416.33,3400069 *
11.09.161.029.94,6090071 *
13.511.973.514.64,4540075
15.013.673.113.33,9050077
6.59.053.937.17,2780085
26.47.668.723.72,7880117 *
32.29.068.322.71,7960121
20.39.275.215.63150123 *
20.611.269.319.51,2400125
17.39.865.125.23,4050127 *
26.66.675.817.62,239012901 *
17.36.778.015.22,125012902 *
20.75.975.518.63,9940131
15.37.775.317.03,6670133
15.45.373.820.92,8300135
17.99.172.318.62,9720137
25.67.572.719.83,8320139
28.27.671.920.52,7370141 *
20.46.574.519.04,7740149 *
15.37.075.317.83,3900151
18.68.376.015.62,9550153
11.56.773.819.53,3120155
10.47.177.015.94,1430157
17.17.278.414.45,0910159 *
23.06.678.714.72,5680161 *
10.37.773.418.94,8470165
17.57.576.416.14,5340167
* Census tract is within two or more community districts. Data are
for entire census tract.
Source: U.S. Census Bureau, 2000 Census SF1 and SF3 New York City Department of City Planning (Dec 2003)
9. Income and Education
by Census Tract, 2000
Brooklyn Community District 6
% College% High School% Familes% PersonsMedian
GraduatesGraduates orPopulationbelowbelowHouseholdCensus
or HigherHigher25 +PovertyPovertyIncomeTract
70.894.81920.010.4$112,41400302 *
75.193.32,8001.35.7$68,1820045
52.984.373316.920.3$49,4270047
54.875.22,1135.710.2$62,3440049
45.582.41,6519.410.0$51,7670051
39.683.3960.03.8$46,5000055
25.975.495120.322.1$32,5630057
11.752.156633.836.3$21,6740059
56.985.81,3687.37.3$60,2740063
55.586.54,0746.39.0$62,0490065
69.288.22,7752.35.3$70,5360067
57.878.12,5217.011.2$55,4170069 *
21.564.72,72135.333.8$22,0110071 *
62.886.53,4123.57.0$69,1070075
41.178.63,19210.413.4$44,4440077
3.444.93,84651.454.6$10,3720085
18.464.01,73324.427.2$30,8330117 *
19.265.61,14419.822.9$36,3430121
42.077.718852.637.4$34,3750123 *
19.363.391515.025.5$26,6250125
16.454.32,08135.038.2$19,0000127 *
45.678.41,6657.411.4$48,024012901 *
59.790.51,6026.28.5$55,625012902 *
44.879.62,91117.419.2$51,1310131
59.088.72,6896.09.6$57,8850133
54.190.02,0017.613.4$51,4200135
49.883.91,93710.210.5$57,0420137
46.575.02,64215.716.9$42,3610139
36.971.61,87212.213.7$41,8400141 *
43.380.33,33011.114.4$47,5690149 *
70.991.52,4986.89.8$66,8150151
70.993.02,3402.24.8$66,8090153
69.492.82,5703.65.8$63,0730155
74.894.93,2601.95.8$68,7870157
75.395.14,1311.56.0$67,3170159 *
67.689.81,9958.410.0$65,1920161 *
78.797.83,7410.63.2$77,8710165
71.492.23,5432.95.6$68,1250167
* Census tract is within two or more community districts. Data are
for entire census tract.
Source: U.S. Census Bureau, 2000 Census SF3 New York City Department of City Planning (Dec 2003)