2. Business Cycles
√ The term business cycle
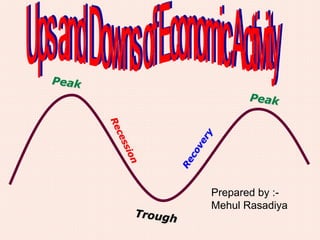
refers to the recurrent ups and
downs in the level of economic
activity, which extend over several
years.
√ Individual business cycles
may vary greatly in duration and
intensity.
√ All display a set of phases.
3. THE BUSINESS CYCLE
Phases of the Business Cycle
PEAK
RECESSION TROUGH
RECOVERY
Level of business activity
Time
4. Level of business activity
PEAK
Time
√ Peak or prosperity phase:
Real output in the economy is at
a high level
Unemployment is low
Domestic output may be at its
capacity
Inflation may be high.
5. Level of business activity
RECESSION
Time
√ Contraction or recession phase:
Real output is decreasing
Unemployment rate is rising.
As contraction continues, inflation pressure fades.
If the recession is prolonged, price may decline
(deflation)
The government determinant for a recession is two
6. Level of business activity
TROUGH
Time
√ Trough or depression phase:
Lowest point of real GDP
Output and unemployment “bottom out”
This phase may be short-lived or prolonged
There is no precise decline in output at
which a serious recession becomes a
7. Level of business activity
RECOVERY
Time
√ Expansionary or recovery:
Real output in the economy is increasing
Unemployment rate is declining
The upswing part of the cycle.
9. Recessions since 1950 show that duration
and depth are varied:
Period Duration in months Depth
(decline in real GDP)
1953-54 10 — 3.0%
1957-58 8 — 3.5%
1960-61 10 — 1.0%
1969-70 11 — 1.1%
1973-75 16 — 4.3%
1980 6 — 3.4%
1981-82 16 — 2.6%
1990-91 8 — 2.6%
2001 8 app. —3.3%
10. How Indicators Monitor the
Four Phases of the Business Cycle
• The Leading Indicator System
… provides a basis for monitoring the
tendency to move from one phase to the next.
…assesses the strengths and
weaknesses in the economy
… gives clues to a quickening or slowing
of future rates of economic growth
… indicates the cyclical turning points in
moving from the upward expansion to the
downward recession, and from the recession to
the upward recovery.
11. Leading indicators anticipate the direction in
which the economy is headed.
The coincident indicators provide
information about the current status of the
economy
1) changing as the economy moves from
one phase of the business cycle to the
next
2) telling economists that an upturn or
downturn in the economy has arrived.
Lagging indicators change months after a
downturn or upturn in the economy has begun
12. Based on the theory that expectations of future
profits are the motivating force in the economy.
Companies may expand production of goods
and services and investment in new structures
and equipment,when business executives
believe that their sales and profits will rise.
When they believe profits will decline, they
reduce production and investment.
These actions generate the four phases of
the business cycle.
13. Causes of Fluctuations
Innovation
Political events
Random events
Wars
Level of consumer spending
Seasonal fluctuations
Cyclical Impacts — durable and non
durable
14. An Actual Business Cycle
1981 - 1990 ($ billion, 1992 dollars)
Real GDP
6000 Peak
5200
Peak
4600
Trough
‘80 82 ‘85 ‘90
One Cycle
18. Global Depression, 1929-1932
Ave. Unemployment Rate, 1925-1928
Ave. Unemployment Rate, 1929-1933
Percent Decrease in Prices, 1929-1932
19. Six Million “Rosie the Riveters”
World War II Production of these items brought us ou
of the Great Depression.
300,000 warplanes
124,000 ships
289,000 combat vehicles and tanks
36 billion yards of cotton goods
41 billion rounds of ammunition
2.4 million military trucks
111,527 tank guns and howitzers
•$288 billion was spent on the war,
•$100 billion in the first six months.
Unemployment hit an all-time low of 1.2%
and personal savings were 25.5%.