KY Accidents Infographic trends 2015
•
0 likes•63 views

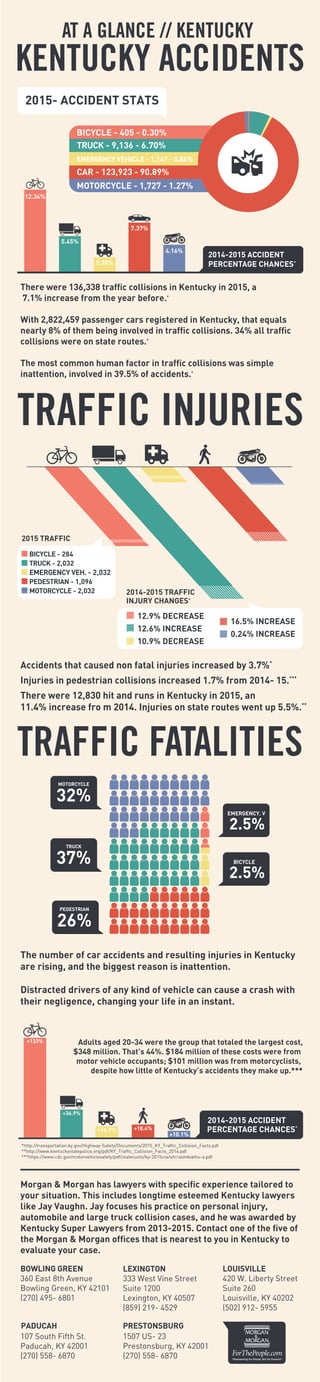
The number of traffic collisions in Kentucky increased 7.1% in 2015 compared to 2014, with nearly 8% of all registered passenger vehicles involved in an accident. The most common factor was simple inattention, a cause in 39.5% of accidents. Accidents causing non-fatal injuries rose 3.7% and pedestrian injury collisions increased 1.7%. Hit and runs also rose substantially. Young adults aged 20-34 accounted for the largest costs of accidents at $348 million or 44% of the total. Distracted driving continues to be a major safety issue.
Recommended

Recommended
More Related Content
What's hot
What's hot (8)
Viewers also liked
Viewers also liked (18)
Similar to KY Accidents Infographic trends 2015
Similar to KY Accidents Infographic trends 2015 (20)
Recently uploaded
Recently uploaded (20)
KY Accidents Infographic trends 2015
- 1. KENTUCKY ACCIDENTS AT A GLANCE // KENTUCKY There were 136,338 traffic collisions in Kentucky in 2015, a 7.1% increase from the year before.* With 2,822,459 passenger cars registered in Kentucky, that equals nearly 8% of them being involved in traffic collisions. 34% all traffic collisions were on state routes.* The most common human factor in traffic collisions was simple inattention, involved in 39.5% of accidents.* BICYCLE - 405 - 0.30% EMERGENCY VEHICLE - 1,147 - 0.84% TRUCK - 9,136 - 6.70% CAR - 123,923 - 90.89% 2015- ACCIDENT STATS Accidents that caused non fatal injuries increased by 3.7%* Injuries in pedestrian collisions increased 1.7% from 2014- 15.*** There were 12,830 hit and runs in Kentucky in 2015, an 11.4% increase fro m 2014. Injuries on state routes went up 5.5%.** The number of car accidents and resulting injuries in Kentucky are rising, and the biggest reason is inattention. Distracted drivers of any kind of vehicle can cause a crash with their negligence, changing your life in an instant. TRAFFIC INJURIES 2014-2015 TRAFFIC 2015 TRAFFIC INJURY CHANGES* 12.9% DECREASE 12.6% INCREASE 10.9% DECREASE 16.5% INCREASE 0.24% INCREASE TRAFFIC FATALITIES Adults aged 20-34 were the group that totaled the largest cost, $348 million. That’s 44%. $184 million of these costs were from motor vehicle occupants; $101 million was from motorcyclists, despite how little of Kentucky’s accidents they make up.*** *http://transportation.ky.gov/Highway-Safety/Documents/2015_KY_Traffic_Collision_Facts.pdf **http://www.kentuckystatepolice.org/pdf/KY_Traffic_Collision_Facts_2014.pdf ***https://www.cdc.gov/motorvehiclesafety/pdf/statecosts/ky-2015costofcrashdeaths-a.pdf BICYCLE - 284 TRUCK - 2,032 PEDESTRIAN - 1,096 MOTORCYCLE - 2,032 EMERGENCY VEH. - 2,032 TRUCK 37% MOTORCYCLE 32% PEDESTRIAN 26% EMERGENCY. V 2.5% BICYCLE 2.5% +16.7% PERCENTAGE CHANCES* +36.9% +133% +18.4% +10.1% LEXINGTON 333 West Vine Street Suite 1200 Lexington, KY 40507 (859) 219- 4529 PRESTONSBURG 1507 US- 23 Prestonsburg, KY 42001 (270) 558- 6870 BOWLING GREEN 360 East 8th Avenue Bowling Green, KY 42101 (270) 495- 6801 PADUCAH 107 South Fifth St. Paducah, KY 42001 (270) 558- 6870 LOUISVILLE 420 W. Liberty Street Suite 260 Louisville, KY 40202 (502) 912- 5955 “Representing the People, Not the Powerful” Morgan & Morgan has lawyers with specific experience tailored to your situation. This includes longtime esteemed Kentucky lawyers like Jay Vaughn. Jay focuses his practice on personal injury, automobile and large truck collision cases, and he was awarded by Kentucky Super Lawyers from 2013-2015. Contact one of the five of the Morgan & Morgan offices that is nearest to you in Kentucky to evaluate your case. 2014-2015 ACCIDENT MOTORCYCLE - 1,727 - 1.27% 2.30% 2014-2015 ACCIDENT PERCENTAGE CHANCES* 5.45% 7.37% 4.16% 12.34%