(mobileYouth) The 2011 SMART index: Handset Brands
•
8 likes•2,233 views

Download the full SMART index data http://www.mobileyouthreport.com Keywords in this presentation SMART, advocacy, word of mouth, influence, earned media, youth, teens, gen-y, generation y, geny, millennials, trends, marketing, keywords, engagement, advertising, social media, telecoms, handsets, mobile, mobile youth, mobileyouth, graham brown, malaysia, asia, south africa, usa, america, nokia, blackberry, sonyericsson, motorola, lg, samsung, apple, iphone, bbm, apps, appstore, survey, research, data, statistics, case studies, insights

Recommended
Recommended
More Related Content
More from Graham Brown
More from Graham Brown (20)
Recently uploaded
Recently uploaded (20)
(mobileYouth) The 2011 SMART index: Handset Brands
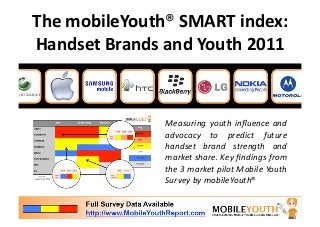
- 1. The mobileYouth® SMART index: Handset Brands and Youth 2011 Measuring youth influence and advocacy to predict future handset brand strength and market share. Key findings from the 3 market pilot Mobile Youth Survey by mobileYouth®
- 2. The Power of Influence Which handset brands are youth recommending the most? Where can each brand find its beachhead of vocal fans? How does influence vary by brand, age, gender and locaDon? Full Survey Data Available http://www.MobileYouthReport.com
- 3. Smart phones need SMART brands Winning the influenDal youth segment means using the right metrics, that’s why we pioneered the mobileYouth® SMART index – a simple measure of youth advocacy that strongly correlates with profitability Full Survey Data Available http://www.MobileYouthReport.com
- 4. 1. Key QuesHons Answered Full Survey Data Available http://www.MobileYouthReport.com
- 5. Blackberry: App store or BBM? Why does Blackberry need to focus 100% on BBM and less on the app store? Why does BB need to start involving youth in its product development process to stay ahead of the curve? Full Survey Data Available http://www.MobileYouthReport.com
- 6. Apple & Teens: Pandora’s Box Why are the next 3 years going to be a real test of Apple’s control based business model as an increasing number of teens get hold of Iphones? Full Survey Data Available http://www.MobileYouthReport.com
- 7. Samsung: Reliability or InnovaHon? Why is Samsung’s future brand strength with youth dependant on its ability to become the most reliable handset? Why is a heavy focus on the app store and high tech a distracDon for Samsung? Full Survey Data Available http://www.MobileYouthReport.com
- 8. Motorola or Sony Ericcson? Why is the survival of these brands dependant on which one wins the 20‐24 yr old male student market? How can they turn cashless innovators into their leading source of brand appeal? Why will only one of these mobile brands survive in tact 5 years from now? Full Survey Data Available http://www.MobileYouthReport.com
- 9. Nokia: Game Over or Last Life? Why do 25‐29 yr olds represent the bridge between the Nokia brand and the lost teenage generaDon? Why is Nokia’s posiDon in emerging markets under threat from the Big 3? What does Nokia need to do now? Full Survey Data Available http://www.MobileYouthReport.com
- 10. 2. About the Mobile Youth Survey Full Survey Data Available http://www.MobileYouthReport.com
- 11. What is this document and why should I read it? White Paper on youth influence and handset brands This Document: MYS 2011 Contains 3 elements: You are reading a summarizing the key 1) SMART Index scores findings and recommenda6ons from the 2) The mobileYouth Brand Heatmap 2011 mobileYouth Survey (2011 MYS). 3) Recommenda6ons All charts are available for download at MYS contains key implica6ons about www.MobileYouthReport.com marke6ng and product development for handset brands globally. The Survey was conducted by mobileYouth with the Youth Research If you are focused on youth you will find Partners in 3 markets (Mr Youth USA, data and recommenda6ons that will Rlabs SA and Youthworks Malaysia) to both challenge your assump6ons and test and share our findings. place you ahead of the curve. Full Survey Data Available http://www.MobileYouthReport.com
- 12. Why did we create the 2011 mobileYouth® Survey? A Powerful Tool to Measure and Forecast Brand Strength Behavior to AXtude: Comparing Behavior and AXtude Companies need to move from relying Based Research Data in Youth Market on behavior based metrics to aQtude. Behavior AXtude Behavior is historical, aQtude future‐ facing. In the table we compare the Example SMS Usage Brand Recommenda6on qualita6ve differences. What value, for example, another survey that shows US Timeframe Last Quarter Next Quarter youth use 3,000 texts a month? We Use Repor6ng Predic6on believe such data simply adds to the noise. We created the 2011 MYS to help brands focus on the one key metric that maWers now: recommenda6on. Full Survey Data Available http://www.MobileYouthReport.com
- 13. 2011 mobileYouth® Survey Results A Summary of Findings from the 2011 Mobile Youth Survey Forecasts & ImplicaHons SonyEricsson & Motorola: Both occupy Apple: Market share will increase in same behavioral niche when it comes to 15‐19 year olds. App store piracy and recommenda6on. Only one can survive. hacking to increase. Poten6al legal Support beachhead of 20‐24 yr old issues to Apple’s control based model. males. Blackberry: Con6nued strength in 20‐ Nokia: Broad appeal eroded by niche something females esp. Emerging players – Apple (innova6on), Blackberry Markets. Focus less on Appstore more (social badge) and Samsung (cost). on doing one thing well (BBM). Needs to leverage 25‐29 yr olds to act as marke6ng role models to 15‐19 yr olds. Samsung: Recommenda6on driven by reliability & durability no applica6ons. Full Survey Data Available http://www.MobileYouthReport.com
- 14. 3. Measuring Influence Full Survey Data Available http://www.MobileYouthReport.com
- 15. What is the mobileYouth® SMART Index? Simple Mobile Advocacy & RecommendaDon Tracker RecommendaHon Drives Profit: Bad Metrics = Bad Results: 65% of youth handset purchases are The old McKinsey saw “What measures driven by word of mouth. What youth gets done” holds true in every say is far more important than what our organiza6on. Widely used does not marke6ng departments say. mean successful. Beware false wisdom. The challenge is moving from outdated Most agency metrics are too marke6ng models to more effec6ve complicated to ac6on requiring a ones without finding suitable metrics to reliance on the agency itself to both measure performance. That’s why we interpret and implement measurement. developed the SMART index – a That’s why we’ve kept it simple – the powerful tool to help mobile brands Simple Mobile Advocacy and become part of youth conversa6ons. Recommenda6on Tracker. Full Survey Data Available http://www.MobileYouthReport.com
- 16. How does the mobileYouth® SMART Index work? So Simple You Don’t Need an Agency to Tell You Your Results A Simple YES/NO QuesHon: 40% Survey 1000 youth asking a simple 30% ques6on “Would you recommend this brand to a friend?” 20% Recommended Brands (+% SMART) 10% 650 youth recommended the brand and 0% 350 didn’t, the SMART index is (650‐350)/1000 = +30% ‐10% ‐20% Ignored Brands (‐% SMART) 375 youth recommended the brand and ‐30% 625 didn’t, the SMART index is Recommended Brand Ignored Brand (375‐625)/1000 = ‐25% Full Survey Data Available http://www.MobileYouthReport.com
- 17. 65% of Youth Buy Handsets Because of Peer Influence Are you focusing on Paid or Earned Media? Full Survey Data Available http://www.MobileYouthReport.com
- 18. Why should you make RecommendaHon the #1 metric? Change in profit strongly correlated to change in SMART index SMART INDEX 60% BlackBerry Apple 40% Samsung 20% Sony Ericsson Motorola CHANGE IN -60% -40% -20% 20% 40% 60% SHARE OF Handset brands that have successfully MARKET PROFIT -20% increased their recommenda6on scores have also seen an increase in their share of market Nokia profit as a % share. For example, Apple’s -40% SMART index recommenda6on score for youth has increased nearly 50% while its Source: mobileYouth 2011 share of total markets has increased nearly -60% 50% Full Survey Data Available http://www.MobileYouthReport.com
- 19. SMART index scores compared RecommendaDon: The single youth metric that drives all metrics Word of Mouth MulH‐Dimensional SMART TargeHng Top level SMART scores only tell part of Sell to the sold. It’s the sold that the story. Nokia, for example, has a par6cipate in product development and youth SMART score of ‐20% sugges6ng generate Earned Media for your brand. poor performance. But focus only on It’s the sold that forgive you when you 25‐29 yr olds and the score rises to screw up. It’s the sold that are the first +10%. Consider males and it rises to buy the new products. SMART tells further s6ll. you where your fans are. Full Survey Data Available http://www.MobileYouthReport.com
- 20. SMART index comparison 2011 Which brands are youth recommending the most? +45% +40% +33% +11% +2% ‐12% mobileYouth SMART index scores Source: mobileYouth 2011 Our 2011 Survey iden6fied the Big 3 of Youth Earned Media: Apple, Blackberry and Samsung. They are also the 3 most profitable brands. Analyzing SMART scores by age, gender and region reveals each brand (from Apple to Nokia) has its own key Beachhead it needs to focus on Full Survey Data Available http://www.MobileYouthReport.com
- 21. 4. Sample Brand Heatmaps Full Survey Data Available http://www.MobileYouthReport.com
- 22. If you don’t know who your fans are… you only have customers Where is your Beachhead? How do you measure your impact on them? Full Survey Data Available http://www.MobileYouthReport.com
- 23. The mobileYouth® 2011 SMART brand heat map where are the hot spots for youth word of mouth? USA South Africa Malaysia Apple Key 15‐19 20‐24 25‐29 Blackberry Red Hot Preview Black‐ berry Hot Samsung Extensive Data Available at Motorola www.MobileYouthReport.com Warm Nokia Cold Sony Ericsson Ice Cold HTC No Data LG 15‐19 20‐24 25‐29 Male Female Moto‐ Sony Source: rola Ericsson mobileYouth 2011 Full Survey Data Available More data & insights: www.MobileYouthSurvey.com http://www.MobileYouthReport.com
- 24. Sample SMART index data Females drive Blackberry Earned Media in South Africa KEY South Africa Apple RED HOT BlackBerry HOT Samsung WARM Motorola Nokia COLD Sony Ericsson ICE COLD HTC NO DATA LG Source: mobileYouth 2011 Full Survey Data Available http://www.MobileYouthReport.com
- 25. Sample SMART index data Survey reveals key Motorola beachhead in 20‐24 yr males KEY USA RED HOT Apple BlackBerry HOT Samsung WARM Motorola COLD Nokia ICE COLD Sony Ericsson Source: mobileYouth 2011 NO DATA Full Survey Data Available http://www.MobileYouthReport.com
- 26. SMART: Motorola and Nokia A closer look at the data reveals key beachheads overlooked 15‐24 yrs fail to recommend Preview Nokia at all More Heatmaps, Charts and Data Available at but 25‐29 yr www.MobileYouthReport.com olds are posi6ve 20‐24 yr olds recommend Motorola the Source: most mobileYouth 2011 Full Survey Data Available More data & insights: www.MobileYouthSurvey.com http://www.MobileYouthReport.com
- 27. 5 Youth Behavioral Trends Which trends will impact which brand and who’s driving them? BEHAVIOR DEMOGRAPHIC BRANDs PIRACY 15‐19 yr males Apple ACCESSORIZATION 20‐29 yr females Blackberry ASSURANCE All ages Samsung SELF‐DISCOVERY 20‐24 yr males Motorola, SonyEricsson NOSTALGIA 25‐29 yr m&f Nokia Full Survey Data Available http://www.MobileYouthReport.com
- 28. 5. 5 Key QuesHons You Need to Ask Full Survey Data Available http://www.MobileYouthReport.com
- 29. 1. Are we targeHng customers or fans? Full Survey Data Available http://www.MobileYouthReport.com
- 30. 2. Where is our Beachhead? Where are hotspots on our Brand Heatmap? Full Survey Data Available http://www.MobileYouthReport.com
- 31. 3. What are their key drivers? How can we win share of customer not market? Full Survey Data Available http://www.MobileYouthReport.com
- 32. 4. What is our SMART index score? Does our markeHng increase or decrease it? What is our target score? Full Survey Data Available http://www.MobileYouthReport.com
- 33. 5. How do we know we’re halfway there? Full Survey Data Available http://www.MobileYouthReport.com
- 34. 6. More InformaHon Full Survey Data Available http://www.MobileYouthReport.com
- 35. Technical Data about the Survey Methodology: Partners • The research was conducted across 3 mobileYouth countries: United States, South Africa & Mr Youth USA Malaysia. Rlabs South Africa • 2011 MYS covered 3638 respondents Youthworks Asia across the 3 countries between the ages of 15‐29. To access detailed data and insights • A mix of both offline and online specific to your market or to discuss method was adopted to collect how these insights could also be applied responses. to your company/market then refer to • Handset brands included: Apple the next slide: Ac6on Points. iPhone, BlackBerry, Samsung, Motorola, Nokia, Sony Ericsson, HTC, LG Full Survey Data Available http://www.MobileYouthReport.com
- 36. Get the full version & charts www.MobileYouthReport.com MobileYouthReport: Download the 2011 Survey Data You are viewing a preview version of the To access the data and downloadable Mobile Youth Survey without the charts you need to sign up at extended brand heatmaps or datasets. www.MobileYouthReport.com Our exis6ng clients have full access to If you’d prefer to talk to a youth the 2011 Mobile Youth Survey, the full specialist then call mobileYouth: downloadable file, insights and UK: +44 20 3286 3635 recommenda6ons here: North America: +1 646 867 3635 www.MobileYouthReport.com South Africa: + 27 11 08 3635 1 The site also gives you access to over Asia: +852 8176 3650 400 charts for 65 countries detailing youth mobile culture. Full Survey Data Available http://www.MobileYouthReport.com
- 37. THE MOBILEYOUTH 2013 REPORT Want more trends? MOBILEYOUTH youth marketing mobile culture since 2001
- 38. THE MOBILEYOUTH 2013 REPORT youth marketing insights for handset brands, content providers and operators features: 29 reports 400+ pages data, charts, cases mobileYouth: tracking youth & mobile culture since 2001 MOBILEYOUTH youth marketing mobile culture since 2001
- 39. THE MOBILEYOUTH 2013 REPORT http://www.mobileyouth.org MOBILEYOUTH youth marketing mobile culture since 2001